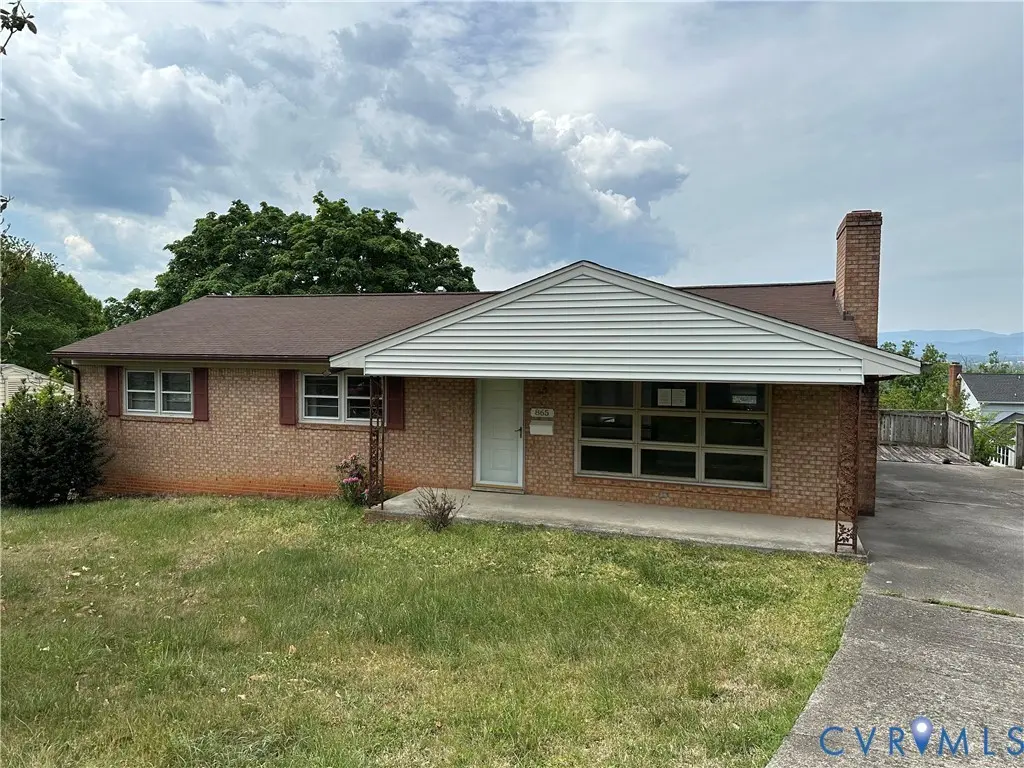
865 Olney Rd · Vinton, VA
Flood risk 1/10 · Minimal
- FEMA flood zone
- X (unshaded)
- Chance of flooding over 30 yrs
- 0.0%
- Est. flood insurance / yr
- $473 – $860
Fire risk 4/10 · Minor
- Est. fire insurance / yr
- $666 – $1,236
Heat risk 5/10 · Moderate
- Hot days now (above 100°F)
- 7 days/yr
- Hot days in 30 yrs
- 18 days/yr
Wind risk 2/10 · Minimal
- Chance of severe wind over 30 yrs
- 1.0%
Air-quality risk 2/10 · Minimal
- Unhealthy air days now
- 1 days/yr
- Unhealthy air days in 30 yrs
- 1 days/yr
Risk factors via First Street. Map © Google.
Why this score? — see what drove the D- grade
The composite is a weighted blend of 9 inputs, each scored 0–100. Each bar is that input's sub-score; the figure is the points it added to the 100-point composite (weight × sub-score).
- ARV discount +14.1/15.0
- Schools +6.4/10.0
- Cash flow +6.2/30.0
- Livability +4.0/5.0
- Rent growth +2.5/5.0
- Condition / age +2.5/5.0
- 1% rule +0.9/10.0
- DSCR +0.5/10.0
- Appreciation +0.0/10.0
$259,000
🖨 Deal sheet 📄 Offer letter ✓ Due diligence
Listing remarks MLS
Perched on a sprawling 1-acre lot in the established Bali Hai Estates, 865 Olney Rd offers a rare opportunity to own a piece of Vinton's scenic landscape. This 1968 brick ranch is a diamond in the rough, boasting breathtaking, panoramic views that you truly have to see to believe. As an REO property, this home is priced to reflect its need for a full renovation. Whether you're an investor looking for your next project or a homeowner dreaming of a custom transformation, the ''bones'' are here to work with. Updated pictures soon.
Key facts
- Panoramic views
- Full renovation
- 1 acre lot
Tags
Property features AI
Exterior
- Parking: Paved driveway; No garage
- Utilities: Public water; Public sewer
- Home design: Two-story house; Entry level is first floor; Resale property; R1 zoning
- Construction: Brick and drywall construction; Composition roof; Below-grade finished and unfinished areas present
- Exterior features: Deck; Rear porch; Paved driveway
Interior
- Kitchen: Main kitchen on first floor; Basement kitchenette
- Bedrooms: At least one bedroom on the first floor; Additional finished rooms in the basement
- Flooring: Carpet; Wood
- Bathrooms: Two full bathrooms; One half bathroom; First-floor full bath with tub and shower
- Heating & cooling: Central air conditioning; Heating by baseboard and hot water; Natural gas heating
- Interior features: Fireplace (masonry); Bedroom on main level; Walk-out basement
- Laundry & utility: Washer hookup; Dryer hookup; Water heater
Neighborhood map
What this means for you Summary
Snapshot
- This is a 3-bed/2.5-bath single-family listed at $259k.
Deal economics
- At list price, monthly cash flow is $-470 ($-6k/yr) — negative.
- To cash-flow at today's rent, offer at most $176k (32.1% below list).
- To meet the 1% rule (rent ≥ 1% of price), the offer needs to be $154k (40.5% below list).
- Recommended offer: $154k (40.5% below list) — sets the bar for 1% rule.
Location & tenants
- Location reads 80/100 on livability (#61 in VA, #1,742 nationally) — a professional / high-income tenant draw. Strengths: cost of living A+, housing A+, health & safety A+; Watch: employment C-, amenities F, commute F.
- Roanoke County Public School District (suburban): math 71% / reading 78% proficiency, ranked #9 of 131 in VA (top 7%) — strong family-tenant draw, lease renewals of 3-5y typical.
- Market conditions: 158 active listings in the ZIP; 9 comparable units currently listed for rent nearby; rentals at typical pace (median 21d on market — plan ~3-4 weeks tenant-placement turnaround); 44% of comp listings sitting > 30 days — soft ceiling on asking rent; 360 units permitted in Roanoke County in 2024 (228 in 5+ unit buildings).
Forward outlook
- Local home prices are declining (-3.0%/yr); year-one equity from $2k of loan paydown is wiped out by about $8k of value loss. Plan a longer hold.
- Roanoke County population projected at +5% by 2050 — modest demand growth; plan on rents tracking national, not racing it.
Negotiation context
- It's been on market 54 days — a 3% lower offer ($251k) is reasonable based on typical stale-listing flexibility.
- 2 sale attempts with the ask held roughly flat each time — persistent listings suggest the price (not the market) is what's stuck; bring a comps-based counter.
- Current owner paid $104k; list at $259k implies a 149% gain — meaningful room to come down on a strong offer.
Risks & watch-outs
- Climate carrying-cost: extreme-heat days projected 7→18/yr by 2055 (HVAC capex compounding) — expect insurance premiums to compound above CPI over the hold.
Questions for the listing agent
- What do current leases actually rent for vs. the listed asking? Can we see a recent rent roll and the last 12 months of T-12 income?
- It's been on market 54 days. Have you received any prior offers? Is the seller open to a 41% concession, seller financing, or rate buy-down credit?
- Built in 1968 — when were the roof, HVAC, electrical panel, plumbing, and water heater last replaced?
- Is there a deadline driving the sale (1031 exchange, divorce, estate, relocation)? That informs how much negotiation room exists.
- Schools are A-rated — typically a magnet for longer-tenancy family renters. What's the average tenant stay here, and is there a school-zone premium baked into asking?
- The area grade is low — what's the realistic commute time and amenity access for the typical tenant pool here? Any planned neighborhood developments (good or bad) we should know about?
- What's the average days-on-market for RENTAL listings here right now (not sales)? A rising rental-DOM trend means longer vacancies and softer asking-rent achievability than the comps imply.
- What's the recent tenant-quality profile in this submarket — average credit score on applications, eviction rate, late-payment / NSF rate, and stable-employment percentage? A property-management company in the area should have these aggregated.
- How much new for-sale + rental construction is in the pipeline within 1–3 miles? Heavy new supply typically softens prices + rents 12–24 months out; constrained supply supports both.
Investment metrics
- 1% rule
- 0.59% ✗
- Cap rate
- 4.12%
- Cash-on-cash
- -7.78%
- DSCR
- 0.65
- GRM
- 14.0
CMA / ARV
- ARV (median comp)
- $303,712
- List price
- $259,000
- Delta
- -14.72%
- Verdict
- UNDERPRICED
- Comps
- 20 within 1.0 mi
Show comp detail 9 sales within ~0.75 mi
| Address | Dist | Beds/Ba | Sqft | Sold | Price | $/sf | Match |
|---|---|---|---|---|---|---|---|
| 805 Gates Ln NE | 0.08mi | 3/2.0 | 1,459 (+4%) | 15mo | $339,000 | $232 | 75 |
| 1036 Jeanette Ave | 0.48mi | 3/1.0 | 1,465 (+4%) | 0mo | $245,000 | $167 | 64 |
| 1521 Bush Farm Dr | 0.33mi | 3/2.5 | 1,329 (-5%) | 17mo | $312,000 | $235 | 62 |
| 735 Gates Ln NE | 0.18mi | 2/1.0 (-1) | 1,433 (+2%) | 23mo | $180,000 | $126 | 58 |
| 314 Lynn Haven Cir | 0.61mi | 3/2.5 | 1,535 (+9%) | 4mo | $261,000 | $170 | 53 |
| 305 N Blair St | 0.67mi | 2/2.0 (-1) | 1,399 (-0%) | 14mo | $262,500 | $188 | 49 |
| 2912 Vinyard Ave NE | 0.64mi | 3/2.0 | 1,295 (-8%) | 11mo | $280,000 | $216 | 46 |
| 226 Savannah Dr NE | 0.60mi | 3/2.0 | 1,596 (+14%) | 5mo | $435,000 | $273 | 43 |
| 501 Holiday Rd | 0.48mi | 3/2.0 | 1,524 (+8%) | 24mo | $246,000 | $161 | 41 |
Match score weights: distance 35% · size 25% · config 20% · recency 20%. Top-matched comps best support the ARV.
Projected returns pro-forma
-3.0% appreciation · 3.0% rent growth · sell at horizon
- IRR
- -30.0%
- Equity multiple
- 0.01×
- Total profit
- $-71,947
- Equity at exit
- $38,618
- IRR
- -31.4%
- Equity multiple
- -0.40×
- Total profit
- $-101,361
- Equity at exit
- $22,394
Cash invested: $72,520 (down + closing). Projections, not guarantees.
Landlord ↔ Tenant lean methodology
- Overall (STATE)
- 55 Moderately Landlord-Leaning
- State Virginia
- 55 Moderately Landlord-Leaning · D+2
- County
- — inherits STATE
- City
- — inherits STATE
ZIP-level market 24179
- Active inventory
- 158
- Price-to-rent
- 14.0×
Monthly cashflow live
- Estimated rent
- $1,541 high interval (Pro) →
- Mortgage (P&I)
- −$1,358
- Tax from tax record
- −$221 /mo · $2,655/yr
- Insurance
- −$108
- HOA
- −$0
- Vacancy / Maint / Mgmt
- −$324
- Net cashflow
- $-470
Break-even live
UW: 25.0% down · 7.5% · 30yr · 1.5% tax · 5.0% vac · 8.0% maint · 8.0% mgmt
Financing live
Cash to close
- Down payment
- $64,750
- Closing costs
- $7,770
- Reserves months
- —
- Total cash needed
- —
Loan-product check · same deal, 3 products live
Conventional
25% down · 7.5% · 30yr
- Down + closing
- —
- Monthly P&I
- —
- Monthly cashflow
- —
- DSCR
- —
- Eligible?
- —
Personal DTI + credit; lowest rate.
DSCR
20% down · 8.5% · 30yr
- Down + closing
- —
- Monthly P&I
- —
- Monthly cashflow
- —
- DSCR
- —
- Eligible?
- —
No personal income docs; deal must DSCR.
Hard money
10% down · 12.0% · 12mo
- Down + closing
- —
- Monthly P&I
- —
- Monthly cashflow
- —
- DSCR
- —
- Eligible?
- —
Short-term bridge; refi at stabilization.
Rent comps 9 comps
| Address | Beds | Baths | Sqft | Rent | $/sqft | DOM | Units | Dist |
|---|---|---|---|---|---|---|---|---|
| 312 Bowman St Unit 212 Vinton, VA | 2.0 | 1.0 | 1246 | $850 | $0.68 | 21d | 1 | 0.58mi |
| 2812 Vinyard Ave NE Unit 2 Roanoke, VA | 2.0 | 1.0 | 950 | $1,295 | $1.36 | 21d | 1 | 0.68mi |
| 2802 Vinyard Ave NE Unit 2 Roanoke, VA | 2.0 | 1.0 | 950 | $1,295 | $1.36 | 13d | 1 | 0.70mi |
| 528 E Cleveland Ave Unit 5 Vinton, VA | 2.0 | 1.0 | 889 | $1,495 | $1.68 | 43d | 1 | 0.83mi |
| 528 E Cleveland Ave Unit 6 Vinton, VA | 2.0 | 1.0 | 875 | $1,525 | $1.74 | 43d | 1 | 0.83mi |
| 317 Jefferson Ave Vinton, VA | 2.0 | 1.0 | 980 | $1,525 | $1.56 | 43d | 1 | 1.00mi |
| 3343 Glade Creek Blvd NE Roanoke, VA | 1.0–3.0 | 1.0–2.0 | 1131 | $2,230 | $1.97 | 13d | 28 | 1.03mi |
| 3006 Hickory Woods Dr NE Roanoke, VA | 1.0–3.0 | 1.0–2.0 | 922 | $1,890 | $2.05 | 13d | 20 | 1.10mi |
| 233 W Cleveland Ave Vinton, VA | 2.0 | 1.0 | 1270 | $1,250 | $0.98 | 43d | 1 | 1.27mi |
Listing history 18 events
-
2026-06-18days on market $259,000 Active 54 DOM
-
2026-06-17days on market $259,000 Active 53 DOM
-
2026-06-16days on market $259,000 Active 52 DOM
-
2026-06-15days on market $259,000 Active 51 DOM
-
2026-06-14days on market $259,000 Active 49 DOM
-
2026-06-13pricedays on market $259,000 Active 48 DOM
-
2026-06-10days on market $260,000 Active 46 DOM
-
2026-06-09days on market $260,000 Active 45 DOM
-
2026-06-08days on market $260,000 Active 44 DOM
-
2026-06-05days on market $260,000 Active 40 DOM
-
2026-06-02days on market $260,000 Active 38 DOM
-
2026-06-01days on market $260,000 Active 37 DOM
-
2026-05-31days on market $260,000 Active 36 DOM
-
2026-05-30days on market $260,000 Active 35 DOM
-
2026-04-25$269,000 Active 530-char remark
Show marketing remark (533 chars)
Perched on a sprawling 1-acre lot in the established Bali Hai Estates, 865 Olney Rd offers a rare opportunity to own a piece of Vinton's scenic landscape. This 1968 brick ranch is a diamond in the rough, boasting breathtaking, panoramic views that you truly have to see to believe. As an REO property, this home is priced to reflect its need for a full renovation. Whether you're an investor looking for your next project or a homeowner dreaming of a custom transformation, the ''bones'' are here to work with. Updated pictures soon.
-
2026-04-25$269,000 Active 533-char remark
Show marketing remark (533 chars)
Perched on a sprawling 1-acre lot in the established Bali Hai Estates, 865 Olney Rd offers a rare opportunity to own a piece of Vinton's scenic landscape. This 1968 brick ranch is a diamond in the rough, boasting breathtaking, panoramic views that you truly have to see to believe. As an REO property, this home is priced to reflect its need for a full renovation. Whether you're an investor looking for your next project or a homeowner dreaming of a custom transformation, the ''bones'' are here to work with. Updated pictures soon.
-
1994-05-01soldstatus $104,000
-
1989-10-01soldstatus $88,500
ⓘ Source: listings_history table (triggers on properties + properties_extension) + one-shot
backfill from property_details.listing_events for pre-trigger history.
Tax reassessment forecast VA · Resets to sale price
- Current annual tax
- $2,655 · $221/mo
- Projected year-2 tax
- $2,655 · $221/mo
- Expected delta
- $0/yr ($0/mo · 0.0%)
ⓘ Screening estimate from a state-policy table — verify with the county assessor before closing.
Climate risk First Street
- Flood 1/10 Low FEMA zone X (unshaded) · 0% chance over 30 yrs
- Wildfire 4/10 Moderate
- Heat 5/10 Major 7 d/yr ≥100°F today · 18 d/yr by 30 yrs out
- Wind 2/10 Low 100% chance of damaging wind over 30 yrs
- Air quality 2/10 Low 1 unhealthy d/yr today · 1 by 30 yrs out
Nearby sold comps map
Loading sold comps map…
Walkable amenities ~0.75 mi
Loading nearby amenities…
Taxation est. · year 1
- Rental income
- $18,492
- − Mortgage interest
- −$14,508
- − Property taxes
- −$2,655
- − Insurance
- −$1,295
- − Repairs & maintenance
- −$1,479
- − Management
- −$1,479
- − Depreciation
- −$7,535
- Taxable loss
- −$10,460
- Est. tax savings @ 24.0%
- +$2,510
- After-tax cash flow
- $-3,130/yr
For passive investors: Depreciation is non-cash, so a rental often shows a tax loss while cash-flowing — sheltering income. Rental losses are passive: they offset passive income freely, and up to $25,000/yr can offset ordinary (W-2) income if you actively participate and your MAGI is under $100k (phasing out to $0 by $150k); unused losses carry forward. On sale, claimed depreciation is recaptured at up to 25%, and gains may owe capital-gains tax (a 1031 exchange can defer both). Figures are a year-1 estimate at your 24.0% rate — not tax advice; consult a CPA.
Schools (NCES district)
- District
- Roanoke County Public School District
- NCES district ID
- 5103330
- Math proficiency
- 71% ▼ -19.00%
- Reading proficiency
- 78% ▼ -6.00%
- Median HH income
- $60,526
- Composite
- 64.08/100
- National rank
- #578
- State rank
- #9 of 131 in VA
Livability — Vinton
- Score
- 80/100
- State rank
- #61
- US rank
- #1742
Category grades
Schools grade is shown separately in the Schools card above.
Census & demographics
- Census place
- Vinton, VA
- Population (ZIP)
- 18,834
Population outlook (Roanoke County) Hauer SSP2
- Today (2025)
- 98,162 people
- By 2030
- 99,793 · +1.7%
- By 2040
- 101,965 · +3.9%
- By 2050
- 103,328 · +5.3%
- By 2075
- 108,641 · +10.7%
- By 2100
- 104,845 · +6.8%
Race, ethnicity, and origin ACS 2023
- Neighborhood character
- Predominantly White (90%)
- Race & ethnicity
- White 90% Two or more races 4% Black 3% Hispanic / Latino 3%
- Common ancestry
- Slovak 2% Italian 2% Lithuanian 1%
- Foreign-born
- 2% · Canada
- Languages at home
- 97% English-only · Spanish 2%
Political lean MEDSL · Roanoke
- 2024 margin
- Strong R (+22.5) · D 38.2% · R 60.7% · Other 1.1%
- 2008→2024 swing
- -1.4pp toward R · 2008: -21.1pp · 2024: -22.5pp
- All cycles
- 2024: R+22.5 2020: R+21.8 2016: R+28.1 2012: R+25.6 2008: R+21.1
Not yet ingested
- Civics
- —
Market trends
- HPI YoY
- ▼ -117.89%
- Current HPI
- 186.9964
- Rent YoY
- —
- Metro
- —
- State GDP YoY
- ▲ 2.40%
- F500 in state
- 50
Industry mix (Fortune 500 HQ in VA)
| Industry | F500 HQs | Revenue |
|---|---|---|
| Aerospace / Defense | 4 | $236B |
|
||
| Technology / Defense | 3 | $32B |
|
||
| Financial Services | 2 | $176B |
|
||
| Utilities | 2 | $27B |
|
||
| Insurance | 2 | $25B |
|
||
| Technology | 2 | $15B |
|
||
Price history
+192.7% since first listed6 events — show timeline
- 2026-06-10 Price Changed $259,000 CVRMLS
- 2026-05-28 Price Changed $260,000 CVRMLS
- 2026-04-25 Listed $269,000 MLSRV
- 2026-04-25 Listed $269,000 CVRMLS
- 1994-05-01 Sold (Public Records) $104,000 Public Records
- 1989-10-01 Sold (Public Records) $88,500 Public Records
Property tax history
+4.3%/yrLatest (2025): $2,655 · +4.9% YoY. Source: county tax records.
Cash-flow waterfall
monthlySold comps — $/sqft
last 12 mo · ≤1 miLoading sold comps…