 Duplex
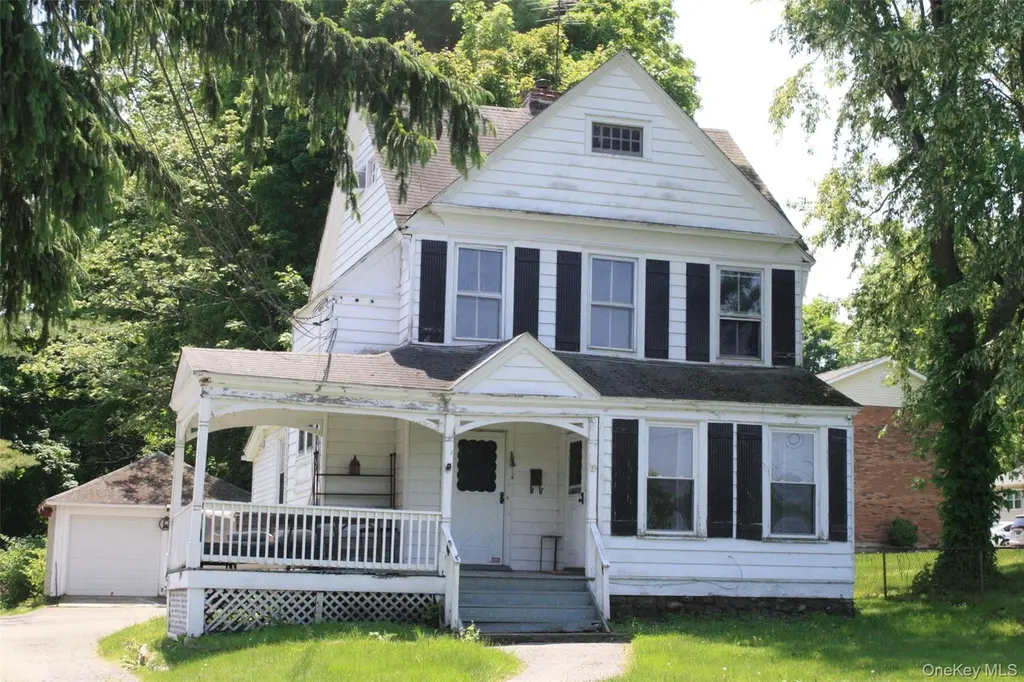
18 Church St · Carmel, NY
Flood risk 1/10 · Minimal
- FEMA flood zone
- X (unshaded)
- Chance of flooding over 30 yrs
- 0.0%
- Est. flood insurance / yr
- $473 – $860
Fire risk 4/10 · Minor
- Est. fire insurance / yr
- $691 – $1,283
Heat risk 5/10 · Moderate
- Hot days now (above 98°F)
- 7 days/yr
- Hot days in 30 yrs
- 15 days/yr
Wind risk 4/10 · Minor
- Chance of severe wind over 30 yrs
- 18.0%
Air-quality risk 4/10 · Minor
- Unhealthy air days now
- 3 days/yr
- Unhealthy air days in 30 yrs
- 5 days/yr
Risk factors via First Street. Map © Google.
Why this score? — see what drove the F grade
The composite is a weighted blend of 9 inputs, each scored 0–100. Each bar is that input's sub-score; the figure is the points it added to the 100-point composite (weight × sub-score).
- ARV discount +7.5/15.0
- Cash flow +5.5/30.0
- Schools +5.0/10.0
- Rent growth +2.5/5.0
- Livability +2.5/5.0
- Condition / age +2.5/5.0
- 1% rule +1.5/10.0
- DSCR +0.0/10.0
- Appreciation +0.0/10.0
$550,000
🖨 Deal sheet (PDF) 📄 Offer letter ✓ Due diligence
Multi-family units
County records classify this as Multi-Family (2-4 Unit). Listing-text estimate: 2 units. confirmed
Listing remarks
2 unit building, close to town, commuting, shopping, restaurants
Key facts
- 0.35 acre lot
- Garage
- Built 1900
Property features AI
Exterior
- Parking: Driveway; One-car garage
- Utilities: Public sewer; Cable available; Electricity connected; Sewer connected
- Home design: Duplex
- Construction: Frame construction
- Exterior features: Frame construction; Not waterfront
Interior
- Bedrooms: Two 1-bedroom units
- Bathrooms: One full bathroom
- Heating & cooling: Hot water heating; Oil-fired heating
- Interior features: First-floor bedroom; Full basement
Neighborhood map
What this means for you Summary
Snapshot
- This is a 2 × 2-bed/1.0-bath units multifamily listed at $550k.
Deal economics
- At list price, monthly cash flow is $-1k ($-14k/yr) — negative. Per door: $-585/mo.
- To cash-flow at today's rent, offer at most $343k (37.6% below list).
- To meet the 1% rule (rent ≥ 1% of price), the offer needs to be $360k (34.5% below list).
- Recommended offer: $343k (37.6% below list) — sets the bar for cash-flow.
- Cap rate 3.7% vs local median 1.9% in Carmel — top-decile yield for the area; either an underpriced asset or a hidden risk that comps aren't pricing in. Stress-test before assuming the spread holds.
Location & tenants
- Location reads: area grade F — affects rentability + tenant quality, not the cash-flow math above.
- Carmel Central School District (suburban): math 46% / reading 63% proficiency, ranked #258 of 590 in NY (top 44%) — acceptable for families but not a draw, mixed tenant base, ~2y average lease; only 17% free/reduced lunch — higher-income household profile.
- Zoned schools: Kent Primary School (math 32% / reading 72%, grade C-, #988 of 2,108 statewide, top 49%, 366 students, 39% FRL); George Fischer Middle School (math 21% / reading 56%, grade F, #437 of 729 statewide, top 60%, 1,130 students, 38% FRL); Carmel High School (math 97% / reading 87%, grade A+, #171 of 1,100 statewide, top 18%, 1,365 students, 36% FRL) — zoned schools average 38% FRL vs 17% district-wide (21 pts higher); higher-poverty schools than district average — tighter screening recommended.
- Market conditions: 233 active listings in the ZIP; 2 comparable units currently listed for rent nearby; 142 units permitted in Putnam County in 2024 (75 in 5+ unit buildings).
Forward outlook
- Local home prices are declining (-3.0%/yr); year-one equity from $4k of loan paydown is wiped out by about $16k of value loss. Plan a longer hold.
- Putnam County population projected to shrink 3% by 2050 — rents likely to lag national; underwrite the cash flow, not the appreciation.
Negotiation context
- It's been on market 33 days — a 3% lower offer ($534k) is reasonable based on typical stale-listing flexibility.
- Current owner paid $218k; list at $550k implies a 152% gain — meaningful room to come down on a strong offer.
Risks & watch-outs
- Watch-outs: built in 1900 — expect roof / HVAC / electrical / plumbing capex.
- Climate carrying-cost: extreme-heat days projected 7→15/yr by 2055 (HVAC capex compounding) — expect insurance premiums to compound above CPI over the hold.
Questions for the listing agent
- What do current leases actually rent for vs. the listed asking? Can we see a recent rent roll and the last 12 months of T-12 income?
- It's been on market 33 days. Have you received any prior offers? Is the seller open to a 38% concession, seller financing, or rate buy-down credit?
- Can we see the unit-by-unit rent roll, current vacancy, and any below-market leases? What's the average tenancy length?
- What capital expenditures (roof, boiler, parking lot, exteriors) have been made in the last 5 years, and what's planned in the next 2?
- Built in 1900 — when were the roof, HVAC, electrical panel, plumbing, and water heater last replaced?
- Is there a deadline driving the sale (1031 exchange, divorce, estate, relocation)? That informs how much negotiation room exists.
- The area grade is low — what's the realistic commute time and amenity access for the typical tenant pool here? Any planned neighborhood developments (good or bad) we should know about?
- What's the average days-on-market for RENTAL listings here right now (not sales)? A rising rental-DOM trend means longer vacancies and softer asking-rent achievability than the comps imply.
- What's the recent tenant-quality profile in this submarket — average credit score on applications, eviction rate, late-payment / NSF rate, and stable-employment percentage? A property-management company in the area should have these aggregated.
- How much new apartment / multifamily construction is in the pipeline within 1–3 miles? Heavy new supply (>2% of stock underway) typically softens rents 12–24 months out; light construction supports rent growth.
Investment metrics
- 1% rule
- 0.65% ✗
- Cap rate
- 3.74%
- Cash-on-cash
- -9.12%
- DSCR
- 0.59
- GRM
- 12.7
CMA / ARV
No comps found within radius.
Projected returns pro-forma
-3.0% appreciation · 3.0% rent growth · sell at horizon
- IRR
- -32.5%
- Equity multiple
- -0.06×
- Total profit
- $-163,476
- Equity at exit
- $82,007
- IRR
- -37.8%
- Equity multiple
- -0.54×
- Total profit
- $-237,577
- Equity at exit
- $47,554
Cash invested: $154,000 (down + closing). Projections, not guarantees.
Landlord ↔ Tenant lean methodology
- Overall (STATE)
- 15 Strongly Tenant-Friendly
- State New York
- 15 Strongly Tenant-Friendly · D+10
- County
- — inherits STATE
- City
- — inherits STATE
ZIP-level market 10512
- Home prices YoY
- -25.5%
- Active inventory
- 233
- Price-to-rent
- 25.5×
Monthly cashflow live
- Estimated rent
- $3,600 medium interval (Pro) →
- Mortgage (P&I)
- −$2,884
- Tax from tax record
- −$901 /mo · $10,811/yr
- Insurance
- −$229
- HOA
- −$0
- Vacancy / Maint / Mgmt
- −$756
- Net cashflow
- $-1,170
Break-even live
Sensitivity live
| Price | -10% $-859 | -5% $-1,015 | +0% $-1,170 | +5% $-1,326 | +10% $-1,482 |
|---|---|---|---|---|---|
| Rent | -10% $-1,455 | -5% $-1,313 | +0% $-1,170 | +5% $-1,028 | +10% $-886 |
| Rate | -1.0pp $-893 | -0.5pp $-1,030 | base $-1,170 | +0.5pp $-1,313 | +1.0pp $-1,458 |
2-unit breakdown (identical units grouped — click to expand)
| Units | Beds | Baths | Est. rent |
|---|---|---|---|
| 2× units | 2 | 1 | $3,600 |
| #1 | 2 | 1 | $1,800 |
| #2 | 2 | 1 | $1,800 |
| Total (2 units) | $3,600 | ||
UW: 25.0% down · 7.5% · 30yr · 1.5% tax · 5.0% vac · 8.0% maint · 8.0% mgmt
Financing live
Cash to close
- Down payment
- $137,500
- Closing costs
- $16,500
- Reserves months
- —
- Total cash needed
- —
Loan-product check · same deal, 3 products live
Conventional
25% down · 7.5% · 30yr
- Down + closing
- —
- Monthly P&I
- —
- Monthly cashflow
- —
- DSCR
- —
- Eligible?
- —
Personal DTI + credit; lowest rate.
DSCR
20% down · 8.5% · 30yr
- Down + closing
- —
- Monthly P&I
- —
- Monthly cashflow
- —
- DSCR
- —
- Eligible?
- —
No personal income docs; deal must DSCR.
Hard money
10% down · 12.0% · 12mo
- Down + closing
- —
- Monthly P&I
- —
- Monthly cashflow
- —
- DSCR
- —
- Eligible?
- —
Short-term bridge; refi at stabilization.
Rent comps 2 comps
| Address | Beds | Baths | Sqft | Rent | $/sqft | DOM | Units | Dist |
|---|---|---|---|---|---|---|---|---|
| 39 Fowler Ave Unit 2 Carmel Hamlet, NY | 2.0 | 1.0 | 1000 | $2,500 | $2.50 | 13d | 1 | 0.69mi |
| 11 Colonel Glenn Dr Carmel, NY | 3.0 | 1.0 | 960 | $4,000 | $4.17 | 15d | 1 | 1.47mi |
Listing history 19 events
-
2026-06-21days on market $550,000 Active 33 DOM
-
2026-06-18days on market $550,000 Active 30 DOM
-
2026-06-17days on market $550,000 Active 29 DOM
-
2026-06-16days on market $550,000 Active 28 DOM
-
2026-06-15days on market $550,000 Active 27 DOM
-
2026-06-14days on market $550,000 Active 25 DOM
-
2026-06-13days on market $550,000 Active 24 DOM
-
2026-06-10days on market $550,000 Active 22 DOM
-
2026-06-09days on market $550,000 Active 21 DOM
-
2026-06-08days on market $550,000 Active 20 DOM
-
2026-06-07days on market $550,000 Active 19 DOM
-
2026-06-05days on market $550,000 Active 16 DOM
-
2026-06-03days on market $550,000 Active 15 DOM
-
2026-06-02days on market $550,000 Active 14 DOM
-
2026-06-01days on market $550,000 Active 13 DOM
-
2026-05-31days on market $550,000 Active 12 DOM
-
2026-05-30days on market $550,000 Active 11 DOM
-
2026-05-19$550,000 Active
-
1989-01-09soldstatus $218,000
ⓘ Source: listings_history table (triggers on properties + properties_extension) + one-shot
backfill from property_details.listing_events for pre-trigger history.
Tax reassessment forecast NY · Partial reset (capped growth)
- Current annual tax
- $10,811 · $901/mo
- Projected year-2 tax
- $10,811 · $901/mo
- Expected delta
- $0/yr ($0/mo · 0.0%)
ⓘ Screening estimate from a state-policy table — verify with the county assessor before closing.
Climate risk First Street
- Flood 1/10 Low FEMA zone X (unshaded) · 0% chance over 30 yrs
- Wildfire 4/10 Moderate
- Heat 5/10 Major 7 d/yr ≥98°F today · 15 d/yr by 30 yrs out
- Wind 4/10 Moderate 18% chance of damaging wind over 30 yrs
- Air quality 4/10 Moderate 3 unhealthy d/yr today · 5 by 30 yrs out
Nearby sold comps map
Loading sold comps map…
Walkable amenities ~0.75 mi
Loading nearby amenities…
Taxation est. · year 1
- Rental income
- $43,200
- − Mortgage interest
- −$30,809
- − Property taxes
- −$10,811
- − Insurance
- −$2,750
- − Repairs & maintenance
- −$3,456
- − Management
- −$3,456
- − Depreciation
- −$16,000
- Taxable loss
- −$24,081
- Est. tax savings @ 24.0%
- +$5,779
- After-tax cash flow
- $-8,264/yr
For passive investors: Depreciation is non-cash, so a rental often shows a tax loss while cash-flowing — sheltering income. Rental losses are passive: they offset passive income freely, and up to $25,000/yr can offset ordinary (W-2) income if you actively participate and your MAGI is under $100k (phasing out to $0 by $150k); unused losses carry forward. On sale, claimed depreciation is recaptured at up to 25%, and gains may owe capital-gains tax (a 1031 exchange can defer both). Figures are a year-1 estimate at your 24.0% rate — not tax advice; consult a CPA.
Schools (NCES district)
- District
- Carmel Central School District
- NCES district ID
- 3606570
- Math proficiency
- 46% ▼ -15.00%
- Reading proficiency
- 63% ▲ 11.00%
- Median HH income
- $87,665
- Composite
- 50.05/100
- National rank
- #1914
- State rank
- #258 of 590 in NY
Livability — Carmel
No livability data for this city. (Only ~50 U.S. cities are tracked.)
Census & demographics
- Census place
- Carmel, NY
- Population (ZIP)
- 24,238
Population outlook (Putnam County) Hauer SSP2
- Today (2025)
- 99,705 people
- By 2030
- 99,650 · -0.1%
- By 2040
- 98,641 · -1.1%
- By 2050
- 96,348 · -3.4%
- By 2075
- 94,412 · -5.3%
- By 2100
- 88,728 · -11.0%
Race, ethnicity, and origin ACS 2023
- Neighborhood character
- Predominantly White (73%)
- Race & ethnicity
- White 73% Hispanic / Latino 18% Two or more races 9% Black 4% Asian 2%
- Hispanic origin (detail)
- Puerto Rican 6% Dominican 3%
- Common ancestry
- Romanian 4% Italian 2% Lithuanian 1%
- Foreign-born
- 14% · Canada, China, Jamaica
- Languages at home
- 80% English-only · Spanish 11% Other Indo-European 4% Russian/Polish/Slavic 2%
Political lean MEDSL · Putnam
- 2024 margin
- R (+13.7) · D 43.2% · R 56.8%
- 2008→2024 swing
- -6.2pp toward R · 2008: -7.5pp · 2024: -13.7pp
- All cycles
- 2024: R+13.7 2020: R+7.9 2016: R+17.8 2012: R+11.2 2008: R+7.5
Not yet ingested
- Civics
- —
Market trends
- HPI YoY
- ▼ -88.73%
- Current HPI
- 258.8452
- Rent YoY
- —
- Metro
- —
- State GDP YoY
- ▲ 2.60%
- F500 in state
- 92
Industry mix (Fortune 500 HQ in NY)
| Industry | F500 HQs | Revenue |
|---|---|---|
| Financial Services | 10 | $950B |
|
||
| Consumer Goods | 9 | $162B |
|
||
| Insurance | 4 | $225B |
|
||
| Telecommunications | 2 | $144B |
|
||
| Pharmaceuticals | 2 | $112B |
|
||
| Media / Entertainment | 2 | $69B |
|
||
Price history
+152.3% since first listed2 events — show timeline
- 2026-05-19 Listed $550,000 OneKey® MLS as Distributed by MLS Grid
- 1989-01-09 Sold (Public Records) $218,000 Public Records
Property tax history
+8.8%/yrLatest (2025): $10,811 · +10.3% YoY. Source: county tax records.
Cash-flow waterfall
monthlySold comps — $/sqft
last 12 mo · ≤1 miLoading sold comps…