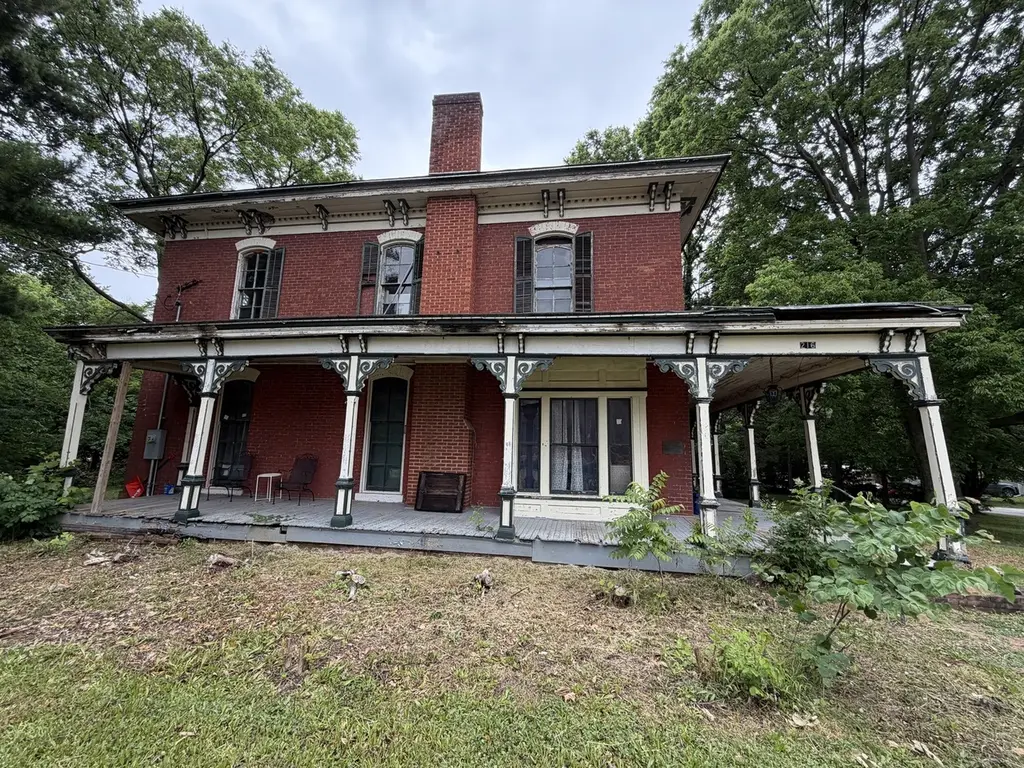
216 S Washington St · Kinmundy, IL
Flood risk 1/10 · Minimal
- FEMA flood zone
- X (unshaded)
- Chance of flooding over 30 yrs
- 0.0%
- Est. flood insurance / yr
- $473 – $860
Fire risk 1/10 · Minimal
- Est. fire insurance / yr
- $804 – $1,492
Heat risk 4/10 · Minor
- Hot days now (above 105°F)
- 7 days/yr
- Hot days in 30 yrs
- 20 days/yr
Wind risk 2/10 · Minimal
- Chance of severe wind over 30 yrs
- 2.0%
Air-quality risk 2/10 · Minimal
- Unhealthy air days now
- 1 days/yr
- Unhealthy air days in 30 yrs
- 2 days/yr
Risk factors via First Street. Map © Google.
Why this score? — see what drove the B grade
The composite is a weighted blend of 9 inputs, each scored 0–100. Each bar is that input's sub-score; the figure is the points it added to the 100-point composite (weight × sub-score).
- Cash flow +30.0/30.0
- 1% rule +10.0/10.0
- DSCR +10.0/10.0
- ARV discount +7.5/15.0
- Appreciation +5.0/10.0
- Livability +2.9/5.0
- Rent growth +2.5/5.0
- Condition / age +2.5/5.0
- Schools +1.4/10.0
$39,900
🖨 Deal sheet (PDF) 📄 Offer letter ✓ Due diligence
Listing remarks MLS
Here is a opportunity to purchase this 2 story 3bed 1.5 bath home that is on the National Registry of Historic Homes. Fireplace in living room, hardwood flooring throughout , nice woodworking on staircases , unfinished basement and attached garage. Located on a large corner lot with over 1 acre. Call today for more information.
Key facts
- 1.16 acre lot
- Garage
- Built 1877
Tags
Property features AI
Finance
- Other: Living area reported from other source; Approximately 1,866 total square feet (1,302 main level, 564 upper level)
- Financial info: Homeowner tax exemption (tax year 2025)
- HOA & community: No master association fee required
Exterior
- Parking: Detached garage (1 garage space, 1 total parking space)
- Utilities: Public water; Public sewer
- Home design: Detached single-family home; Two-story layout; Originally built more than 100 years ago; Built before 1978; Fee simple ownership
- Construction: Brick construction
- Exterior features: Lot approximately 1.0–1.99 acres; Lot dimensions approximately 275 x 186
Interior
- Kitchen: Kitchen on main level (13 x 18); Dishwasher; Refrigerator
- Bedrooms: Master bedroom on main level (12 x 12); Bedroom 2 on main level (11 x 12); Bedroom 3 on main level (13 x 14); Bedroom 4 on second level (12 x 12)
- Flooring: Wood laminate flooring in living room, kitchen, master and two other bedrooms
- Bathrooms: One half bathroom
- Heating & cooling: Natural gas heating; Electric heating; Central air conditioning
- Interior features: Unfinished full basement; Six total rooms
- Laundry & utility: Dedicated laundry room
Neighborhood map
What this means for you Summary
Snapshot
- This is a 4-bed/0.5-bath single-family listed at $40k.
Deal economics
- At list price, monthly cash flow is $786 ($9k/yr) — positive.
- The deal already cash-flows at list — no discount required.
- Meets the 1% rule at list price ($1k rent vs $40k).
Location & tenants
- Location reads 58/100 on livability (#1,135 in IL) — a working-class tenant base; expect higher turnover. Strengths: cost of living A+, housing A+; Watch: crime D-, amenities F, commute F.
- South Central CUD 401 (rural): math 12% / reading 19% proficiency, ranked #506 of 620 in IL (top 82%) — low school quality limits family demand, transient renter base, plan for 1-2y turnover.
- Zoned schools: South Central Elementary-Kinmundy (math 12% / reading 12%, grade F, #1,403 of 2,056 statewide, top 71%, 279 students, 0% FRL); South Central Middle School (math 12% / reading 22%, grade F, #460 of 665 statewide, top 72%, 144 students, 0% FRL); South Central High School (math 17% / reading 22%, grade F, #397 of 693 statewide, top 61%, 206 students, 0% FRL) — zoned schools average 0% FRL vs 51% district-wide (51 pts lower); this property's tenant base skews higher-income than the district average.
- Market conditions: 4 active listings in the ZIP; 2 units permitted in Marion County in 2024 (0 in 5+ unit buildings).
Forward outlook
- In year one you build about $1k of equity ($276 loan paydown + $1k appreciation (3.0% local appreciation)).
- Marion County population projected at -20% by 2050 — secular population decline; favor cash flow + early exit over multi-decade hold.
- At projected returns (3.0% appreciation + 3.0% rent growth), your $11k cash investment doubles in ~2 years — after that, you're playing with house money.
Negotiation context
- Only 1 days on market — expect competitive offers; lowballing is unlikely to land.
- 3 sale attempts; this cycle's ask has dropped $15k (27%) from the opening price — seller is motivated, your offer sets the floor, not the list.
Risks & watch-outs
- Watch-outs: built in 1877 — expect roof / HVAC / electrical / plumbing capex.
Questions for the listing agent
- Built in 1877 — when were the roof, HVAC, electrical panel, plumbing, and water heater last replaced?
- Is there a deadline driving the sale (1031 exchange, divorce, estate, relocation)? That informs how much negotiation room exists.
- Schools are F-rated, which usually means shorter tenancies and higher turnover. Who's the typical renter profile here, and what's been the actual vacancy rate?
- Crime grade is D in this area — have there been break-ins, vandalism, or insurance claims at this property in the last 3 years? What carrier currently insures it and at what premium?
- What's the average days-on-market for RENTAL listings here right now (not sales)? A rising rental-DOM trend means longer vacancies and softer asking-rent achievability than the comps imply.
- What's the recent tenant-quality profile in this submarket — average credit score on applications, eviction rate, late-payment / NSF rate, and stable-employment percentage? A property-management company in the area should have these aggregated.
- How much new for-sale + rental construction is in the pipeline within 1–3 miles? Heavy new supply typically softens prices + rents 12–24 months out; constrained supply supports both.
Investment metrics
- 1% rule
- 3.37% ✓
- Cap rate
- 29.94%
- Cash-on-cash
- 84.45%
- DSCR
- 4.76
- GRM
- 2.5
CMA / ARV
No comps found within radius.
Projected returns pro-forma
3.0% appreciation · 3.0% rent growth · sell at horizon
- IRR
- 88.8%
- Equity multiple
- 5.91×
- Total profit
- $54,903
- Equity at exit
- $17,941
- IRR
- 88.4%
- Equity multiple
- 12.22×
- Total profit
- $125,304
- Equity at exit
- $27,649
Cash invested: $11,172 (down + closing). Projections, not guarantees.
Landlord ↔ Tenant lean methodology
- Overall (STATE)
- 43 Moderately Tenant-Leaning
- State Illinois
- 43 Moderately Tenant-Leaning · D+7
- County
- — inherits STATE
- City
- — inherits STATE
ZIP-level market 62854
- Active inventory
- 4
- Price-to-rent
- 2.5×
Monthly cashflow live
- Estimated rent
- $1,344 medium interval (Pro) →
- Mortgage (P&I)
- −$209
- Tax est. 1.5%
- −$50 /mo · $598/yr
- Insurance
- −$17
- HOA
- −$0
- Vacancy / Maint / Mgmt
- −$282
- Net cashflow
- $786
Break-even live
Sensitivity live
| Price | -10% $814 | -5% $800 | +0% $786 | +5% $772 | +10% $759 |
|---|---|---|---|---|---|
| Rent | -10% $680 | -5% $733 | +0% $786 | +5% $839 | +10% $892 |
| Rate | -1.0pp $806 | -0.5pp $796 | base $786 | +0.5pp $776 | +1.0pp $765 |
UW: 25.0% down · 7.5% · 30yr · 1.5% tax · 5.0% vac · 8.0% maint · 8.0% mgmt
Financing live
Cash to close
- Down payment
- $9,975
- Closing costs
- $1,197
- Reserves months
- —
- Total cash needed
- —
Loan-product check · same deal, 3 products live
Conventional
25% down · 7.5% · 30yr
- Down + closing
- —
- Monthly P&I
- —
- Monthly cashflow
- —
- DSCR
- —
- Eligible?
- —
Personal DTI + credit; lowest rate.
DSCR
20% down · 8.5% · 30yr
- Down + closing
- —
- Monthly P&I
- —
- Monthly cashflow
- —
- DSCR
- —
- Eligible?
- —
No personal income docs; deal must DSCR.
Hard money
10% down · 12.0% · 12mo
- Down + closing
- —
- Monthly P&I
- —
- Monthly cashflow
- —
- DSCR
- —
- Eligible?
- —
Short-term bridge; refi at stabilization.
Listing history 3 events
-
2026-06-12pricestatus $39,900 Pending 1 DOM
-
2026-06-09remarks 225-char remark
-
2026-06-09$54,900 Active 1 DOM
ⓘ Source: listings_history table (triggers on properties + properties_extension) + one-shot
backfill from property_details.listing_events for pre-trigger history.
Climate risk First Street
- Flood 1/10 Low FEMA zone X (unshaded) · 0% chance over 30 yrs
- Wildfire 1/10 Low
- Heat 4/10 Moderate 7 d/yr ≥105°F today · 20 d/yr by 30 yrs out
- Wind 2/10 Low 2% chance of damaging wind over 30 yrs
- Air quality 2/10 Low 1 unhealthy d/yr today · 2 by 30 yrs out
Nearby sold comps map
Loading sold comps map…
Walkable amenities ~0.75 mi
Loading nearby amenities…
Taxation est. · year 1
- Rental income
- $16,131
- − Mortgage interest
- −$2,235
- − Property taxes
- −$598
- − Insurance
- −$200
- − Repairs & maintenance
- −$1,291
- − Management
- −$1,291
- − Depreciation
- −$1,161
- Taxable income
- $9,357
- Est. tax owed @ 24.0%
- −$2,246
- After-tax cash flow
- $7,189/yr
For passive investors: Depreciation is non-cash, so a rental often shows a tax loss while cash-flowing — sheltering income. Rental losses are passive: they offset passive income freely, and up to $25,000/yr can offset ordinary (W-2) income if you actively participate and your MAGI is under $100k (phasing out to $0 by $150k); unused losses carry forward. On sale, claimed depreciation is recaptured at up to 25%, and gains may owe capital-gains tax (a 1031 exchange can defer both). Figures are a year-1 estimate at your 24.0% rate — not tax advice; consult a CPA.
Schools (NCES district)
- District
- South Central CUD 401
- NCES district ID
- 1700114
- Math proficiency
- 12% ▼ -1.00%
- Reading proficiency
- 19% ▼ -13.00%
- Median HH income
- $43,276
- Composite
- 13.52/100
- National rank
- #9517
- State rank
- #506 of 620 in IL
Livability — Kinmundy
- Score
- 58/100
- State rank
- #1135
- US rank
- #21440
Category grades
Schools grade is shown separately in the Schools card above.
Census & demographics
- Census place
- Kinmundy, IL
- Population (ZIP)
- 1,561
Population outlook (Marion County) Hauer SSP2
- Today (2025)
- 36,071 people
- By 2030
- 34,598 · -4.1%
- By 2040
- 31,754 · -12.0%
- By 2050
- 28,912 · -19.8%
- By 2075
- 22,527 · -37.5%
- By 2100
- 16,455 · -54.4%
Race, ethnicity, and origin ACS 2023
- Neighborhood character
- Predominantly White (95%)
- Race & ethnicity
- White 95% Hispanic / Latino 4% Two or more races 2%
- Common ancestry
- Romanian 4% Iranian 3% Portuguese 3%
- Foreign-born
- 1% · Canada
- Languages at home
- 95% English-only · German/W. Germanic 2% Russian/Polish/Slavic 1% Spanish 1%
Political lean MEDSL · Marion
- 2024 margin
- Solid R (+49.5) · D 24.6% · R 74.1% · Other 1.4%
- 2008→2024 swing
- -47.5pp toward R · 2008: -2.0pp · 2024: -49.5pp
- All cycles
- 2024: R+49.5 2020: R+46.6 2016: R+44.9 2012: R+19.2 2008: R+2.0
Not yet ingested
- Civics
- —
Market trends
- HPI YoY
- —
- Current HPI
- —
- Rent YoY
- —
- Metro
- —
- State GDP YoY
- ▲ 1.59%
- F500 in state
- 60
Industry mix (Fortune 500 HQ in IL)
| Industry | F500 HQs | Revenue |
|---|---|---|
| Insurance | 4 | $201B |
|
||
| Consumer Goods | 4 | $87B |
|
||
| Industrial Machinery | 3 | $64B |
|
||
| Healthcare | 2 | $55B |
|
||
| Retail / Pharmacy | 1 | $148B |
|
||
| Agriculture / Food | 1 | $86B |
|
||
Price history
+57.3% since first listed6 events — show timeline
- 2026-06-09 Listed $54,900 MRED as Distributed by MLS Grid
- 2025-04-08 Sold (MLS) $35,000 MRED as Distributed by MLS Grid
- 2025-04-08 Sold (MLS) $35,000 RMLSA as Distributed by MLS Grid
- 2025-03-14 Pending — RMLSA as Distributed by MLS Grid
- 2025-01-25 Listed $34,900 MRED as Distributed by MLS Grid
- 2025-01-25 Listed $34,900 RMLSA as Distributed by MLS Grid
Property tax history
+5.6%/yrLatest (2024): $2,894 · +9.2% YoY. Source: county tax records.
Cash-flow waterfall
monthlySold comps — $/sqft
last 12 mo · ≤1 miLoading sold comps…