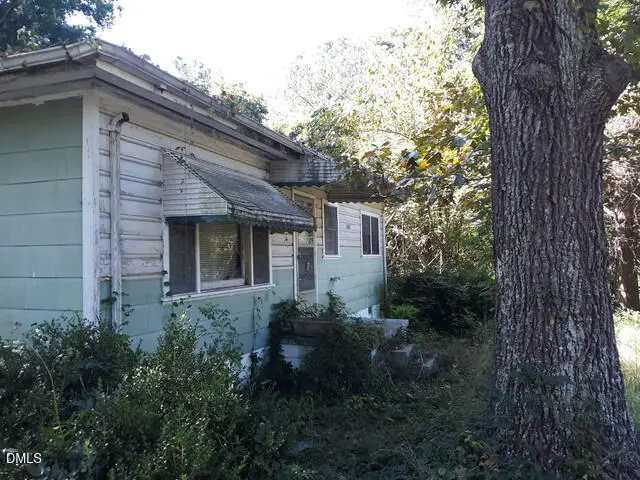
1302 Hillsboro St · Pittsboro, NC
Flood risk 8/10 · Major
- FEMA flood zone
- X (unshaded)
- Chance of flooding over 30 yrs
- 0.99%
- Est. flood insurance / yr
- $507 – $1,088
Fire risk 4/10 · Minor
- Est. fire insurance / yr
- $906 – $1,684
Heat risk 5/10 · Moderate
- Hot days now (above 104°F)
- 7 days/yr
- Hot days in 30 yrs
- 17 days/yr
Wind risk 6/10 · Moderate
- Chance of severe wind over 30 yrs
- 27.0%
Air-quality risk 2/10 · Minimal
- Unhealthy air days now
- 1 days/yr
- Unhealthy air days in 30 yrs
- 1 days/yr
Risk factors via First Street. Map © Google.
Why this score? — see what drove the C+ grade
The composite is a weighted blend of 9 inputs, each scored 0–100. Each bar is that input's sub-score; the figure is the points it added to the 100-point composite (weight × sub-score).
- Cash flow +27.3/30.0
- DSCR +9.5/10.0
- ARV discount +7.5/15.0
- 1% rule +6.5/10.0
- Schools +4.2/10.0
- Livability +3.5/5.0
- Rent growth +2.6/5.0
- Condition / age +2.5/5.0
- Appreciation +0.0/10.0
$165,000
🖨 Deal sheet (PDF) 📄 Offer letter ✓ Due diligence
Listing remarks
Fantastic opportunity! Own close to Downtown Pittsboro and Chatham Park. Nearly 3/4 acre lot in prime location. Opportunity to partner with Custom Builder
Key facts
- 0.66 acre lot
- Built 1961
- Listed 39 days
Property features AI
Finance
- Other: Living area listed as 864; Above-grade finished area 864; Below-grade finished area 0; Tax annual amount listed (financial details retained by listing)
- HOA & community: No homeowners association; Not a senior community
Exterior
- Utilities: Water source: see remarks; Sewer: other
- Home design: One-story house
- Construction: Vinyl siding; Block foundation (also lists none / see remarks); Roof details: see remarks; Built as a house (structure type)
- Exterior features: Lot approximately 0.66 acres; Publicly maintained road access; Directions available
Interior
- Bedrooms: Three bedrooms (all on the main level)
- Flooring: See remarks
- Bathrooms: One full bathroom
- Heating & cooling: Heating present (type listed as other / see remarks); No central cooling
- Interior features: Flooring: see remarks
Neighborhood map
What this means for you Summary
Snapshot
- This is a 3-bed/1.0-bath single-family listed at $165k.
Deal economics
- At list price, monthly cash flow is $411 ($5k/yr) — positive.
- The deal already cash-flows at list — no discount required.
- Meets the 1% rule at list price ($2k rent vs $165k).
- Recommended offer: $160k (3.0% below list) — sets the bar for market timing.
- Cap rate 9.8% vs local median 1.9% in Pittsboro — top-decile yield for the area; either an underpriced asset or a hidden risk that comps aren't pricing in. Stress-test before assuming the spread holds.
Location & tenants
- Location reads 69/100 on livability (#153 in NC) — a middle-class / working-renter tenant base. Strengths: health & safety A+; Watch: amenities F, commute F, employment F.
- Chatham County Schools (rural): math 45% / reading 51% proficiency, ranked #68 of 178 in NC (top 38%) — families likely to look elsewhere, expect single-tenant / working-renter base with shorter leases.
- Zoned schools: Northwood High (math 61% / reading 75%, grade B, #137 of 535 statewide, top 26%, 940 students, 29% FRL) — zoned schools average 29% FRL vs 45% district-wide (15 pts lower); this property's tenant base skews higher-income than the district average.
- Zoned-school proficiency averages 68% at this address vs 48% district-wide (+20 pts) — the actual schools serving this property are materially stronger than the Chatham County Schools average implies; a family-tenant draw the district grade alone would hide.
- Market conditions: Rents flat; 511 active listings in the ZIP; 4 comparable units currently listed for rent nearby; rentals at typical pace (median 22d on market — plan ~3-4 weeks tenant-placement turnaround); solid renter incomes; 458 units permitted in Chatham County in 2024 (0 in 5+ unit buildings).
Forward outlook
- Local home prices are declining (-3.0%/yr); year-one equity from $1k of loan paydown is wiped out by about $5k of value loss. Plan a longer hold.
- Chatham County population projected at +26% by 2050 — long-run rental-demand tailwind backs the buy-and-hold thesis.
Negotiation context
- It's been on market 39 days — a 3% lower offer ($160k) is reasonable based on typical stale-listing flexibility.
- 2 sale attempts with the ask held roughly flat each time — persistent listings suggest the price (not the market) is what's stuck; bring a comps-based counter.
- Current owner paid $65k; list at $165k implies a 154% gain — meaningful room to come down on a strong offer.
Risks & watch-outs
- Watch-outs: flood insurance adds $66/mo.
- Climate carrying-cost: severe flood risk; major wind risk, 27% chance of damaging wind over 30y; extreme-heat days projected 7→17/yr by 2055 (HVAC capex compounding) — expect insurance premiums to compound above CPI over the hold.
Questions for the listing agent
- It's been on market 39 days. Have you received any prior offers? Is the seller open to a 3% concession, seller financing, or rate buy-down credit?
- Built in 1961 — when were the roof, HVAC, electrical panel, plumbing, and water heater last replaced?
- What's the actual annual flood-insurance premium (NFIP or private), and is the property in a SFHA with mandatory coverage?
- Is there a deadline driving the sale (1031 exchange, divorce, estate, relocation)? That informs how much negotiation room exists.
- What's the average days-on-market for RENTAL listings here right now (not sales)? A rising rental-DOM trend means longer vacancies and softer asking-rent achievability than the comps imply.
- What's the recent tenant-quality profile in this submarket — average credit score on applications, eviction rate, late-payment / NSF rate, and stable-employment percentage? A property-management company in the area should have these aggregated.
- How much new for-sale + rental construction is in the pipeline within 1–3 miles? Heavy new supply typically softens prices + rents 12–24 months out; constrained supply supports both.
Investment metrics
- 1% rule
- 1.15% ✓
- Cap rate
- 9.76%
- Cash-on-cash
- 12.40%
- DSCR
- 1.55
- GRM
- 7.3
CMA / ARV
No comps found within radius.
Projected returns pro-forma
-3.0% appreciation · 0.35% rent growth · sell at horizon
- IRR
- -3.3%
- Equity multiple
- 0.88×
- Total profit
- $-5,494
- Equity at exit
- $24,602
- IRR
- 3.3%
- Equity multiple
- 1.21×
- Total profit
- $9,742
- Equity at exit
- $14,266
Cash invested: $46,200 (down + closing). Projections, not guarantees.
Landlord ↔ Tenant lean methodology
- Overall (STATE)
- 85 Strongly Landlord-Friendly
- State North Carolina
- 85 Strongly Landlord-Friendly · R+3
- County
- — inherits STATE
- City
- — inherits STATE
ZIP-level market 27312
- Home prices YoY
- -20.3%
- Rents YoY
- 0.3%
- Active inventory
- 511
- Price-to-rent
- 7.3×
Monthly cashflow live
- Estimated rent
- $1,895 medium interval (Pro) →
- Mortgage (P&I)
- −$865
- Tax from tax record
- −$86 /mo · $1,026/yr
- Insurance
- −$69
- Flood insurance flood zone
- −$66 /mo · $798/yr
- HOA
- −$0
- Vacancy / Maint / Mgmt
- −$398
- Net cashflow
- $411
Break-even live
Sensitivity live
| Price | -10% $504 | -5% $458 | +0% $411 | +5% $364 | +10% $317 |
|---|---|---|---|---|---|
| Rent | -10% $261 | -5% $336 | +0% $411 | +5% $486 | +10% $561 |
| Rate | -1.0pp $494 | -0.5pp $453 | base $411 | +0.5pp $368 | +1.0pp $325 |
UW: 25.0% down · 7.5% · 30yr · 1.5% tax · 5.0% vac · 8.0% maint · 8.0% mgmt
Financing live
Cash to close
- Down payment
- $41,250
- Closing costs
- $4,950
- Reserves months
- —
- Total cash needed
- —
Loan-product check · same deal, 3 products live
Conventional
25% down · 7.5% · 30yr
- Down + closing
- —
- Monthly P&I
- —
- Monthly cashflow
- —
- DSCR
- —
- Eligible?
- —
Personal DTI + credit; lowest rate.
DSCR
20% down · 8.5% · 30yr
- Down + closing
- —
- Monthly P&I
- —
- Monthly cashflow
- —
- DSCR
- —
- Eligible?
- —
No personal income docs; deal must DSCR.
Hard money
10% down · 12.0% · 12mo
- Down + closing
- —
- Monthly P&I
- —
- Monthly cashflow
- —
- DSCR
- —
- Eligible?
- —
Short-term bridge; refi at stabilization.
Rent comps 4 comps
| Address | Beds | Baths | Sqft | Rent | $/sqft | DOM | Units | Dist |
|---|---|---|---|---|---|---|---|---|
| 145 Retreat Dr Pittsboro, NC | 1.0–3.0 | 1.0–2.0 | 1091 | $2,020 | $1.85 | 2d | 36 | 0.81mi |
| 80 Haven Creek Rd Pittsboro, NC | 1.0–3.0 | 1.0–2.0 | 995 | $2,175 | $2.19 | 24d | 9 | 1.03mi |
| 25 Creekside Cir Pittsboro, NC | 1.0–2.0 | 1.0 | 808 | $1,295 | $1.60 | 3d | 4 | 1.18mi |
| 120 Rectory St Unit 63 Pittsboro, NC | 2.0 | 1.0 | 896 | $1,195 | $1.33 | 22d | 1 | 1.23mi |
Listing history 8 events
-
2026-06-03statusdays on market $165,000 Pending 39 DOM
-
2026-06-02days on market $165,000 Active 38 DOM
-
2026-06-01days on market $165,000 Active 37 DOM
-
2026-05-31days on market $165,000 Active 36 DOM
-
2026-05-05status Active
-
2026-04-18status Pending
-
2026-04-08$165,000 Active
-
2024-09-12soldstatus $65,000
ⓘ Source: listings_history table (triggers on properties + properties_extension) + one-shot
backfill from property_details.listing_events for pre-trigger history.
Tax reassessment forecast NC · Resets to sale price
- Current annual tax
- $1,026 · $86/mo
- Projected year-2 tax
- $1,353 · $113/mo
- Expected delta
- +$327/yr (+$27/mo · 31.8%)
ⓘ Screening estimate from a state-policy table — verify with the county assessor before closing.
Climate risk First Street
- Flood 8/10 Severe FEMA zone X (unshaded) · 99% chance over 30 yrs
- Wildfire 4/10 Moderate
- Heat 5/10 Major 7 d/yr ≥104°F today · 17 d/yr by 30 yrs out
- Wind 6/10 Major 27% chance of damaging wind over 30 yrs
- Air quality 2/10 Low 1 unhealthy d/yr today · 1 by 30 yrs out
Nearby sold comps map
Loading sold comps map…
Walkable amenities ~0.75 mi
Loading nearby amenities…
Taxation est. · year 1
- Rental income
- $22,738
- − Mortgage interest
- −$9,243
- − Property taxes
- −$1,026
- − Insurance
- −$1,622
- − Repairs & maintenance
- −$1,819
- − Management
- −$1,819
- − Depreciation
- −$4,800
- Taxable income
- $2,408
- Est. tax owed @ 24.0%
- −$578
- After-tax cash flow
- $4,353/yr
For passive investors: Depreciation is non-cash, so a rental often shows a tax loss while cash-flowing — sheltering income. Rental losses are passive: they offset passive income freely, and up to $25,000/yr can offset ordinary (W-2) income if you actively participate and your MAGI is under $100k (phasing out to $0 by $150k); unused losses carry forward. On sale, claimed depreciation is recaptured at up to 25%, and gains may owe capital-gains tax (a 1031 exchange can defer both). Figures are a year-1 estimate at your 24.0% rate — not tax advice; consult a CPA.
Schools (NCES district)
- District
- Chatham County Schools
- NCES district ID
- 3700750
- Math proficiency
- 45% ▼ -1.00%
- Reading proficiency
- 51% ▲ 1.00%
- Median HH income
- $57,371
- Composite
- 41.82/100
- National rank
- #3390
- State rank
- #68 of 178 in NC
Livability — Pittsboro
- Score
- 69/100
- State rank
- #153
- US rank
- #8450
Category grades
Schools grade is shown separately in the Schools card above.
Census & demographics
- Census place
- Pittsboro, NC
- County
- Chatham County · 23,341 people
- City population
- 23,341
- Metro
- Durham-Chapel Hill, NC
- Population (ZIP)
- 23,341
- Household income
- $103,104
- Rent vs Own
- Severe rent burden
- 484.0
Population outlook (Chatham County) Hauer SSP2
- Today (2025)
- 84,640 people
- By 2030
- 90,521 · +6.9%
- By 2040
- 99,791 · +17.9%
- By 2050
- 106,565 · +25.9%
- By 2075
- 119,165 · +40.8%
- By 2100
- 122,958 · +45.3%
Race, ethnicity, and origin ACS 2023
- Neighborhood character
- Predominantly White (78%)
- Race & ethnicity
- White 78% Black 10% Hispanic / Latino 8% Two or more races 7% Asian 1%
- Hispanic origin (detail)
- Mexican 3% Cuban 1%
- Common ancestry
- Italian 4% Slovak 4% Romanian 3%
- Foreign-born
- 8% · Canada, Jamaica, China
- Languages at home
- 93% English-only · Spanish 5% Other Indo-European 1%
Political lean MEDSL · Chatham
- 2024 margin
- D (+12.5) · D 55.7% · R 43.2% · Other 1.1%
- 2008→2024 swing
- +2.8pp toward D · 2008: 9.7pp · 2024: 12.5pp
- All cycles
- 2024: D+12.5 2020: D+11.5 2016: D+10.1 2012: D+4.8 2008: D+9.7
Not yet ingested
- Civics
- —
Market trends
- HPI YoY
- ▼ -65.26%
- Current HPI
- 255.9179
- Rent YoY
- ▲ 0.35%
- Metro
- Durham-Chapel Hill, NC
- State GDP YoY
- ▲ 3.28%
- F500 in state
- 26
Industry mix (Fortune 500 HQ in NC)
| Industry | F500 HQs | Revenue |
|---|---|---|
| Financial Services | 2 | $213B |
|
||
| Retail | 2 | $95B |
|
||
| Industrial Conglomerate | 1 | $38B |
|
||
| Metals / Steel | 1 | $35B |
|
||
| Utilities | 1 | $30B |
|
||
| Industrial Machinery | 1 | $19B |
|
||
Price history
+153.8% since first listed4 events — show timeline
- 2026-05-05 Relisted — TMLS
- 2026-04-18 Pending — TMLS
- 2026-04-08 Listed $165,000 TMLS
- 2024-09-12 Sold (Public Records) $65,000 Public Records
Property tax history
+6.1%/yrLatest (2025): $1,026 · -15.1% YoY. Source: county tax records.
Cash-flow waterfall
monthlySold comps — $/sqft
last 12 mo · ≤1 miLoading sold comps…