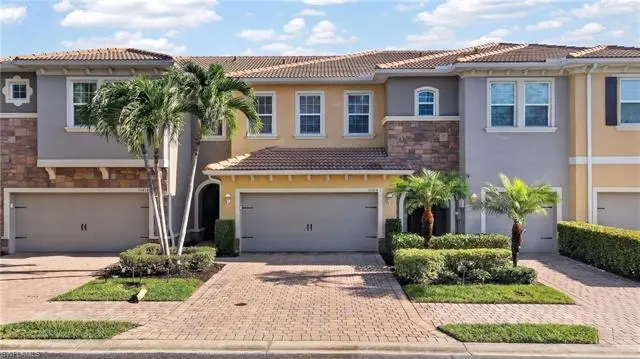
10818 Alvara Point Dr · Bonita Springs, FL
Flood risk 1/10 · Minimal
- FEMA flood zone
- X (shaded)
- Chance of flooding over 30 yrs
- 0.0%
- Est. flood insurance / yr
- $507 – $1,088
Fire risk 4/10 · Minor
- Est. fire insurance / yr
- $947 – $1,759
Heat risk 10/10 · Severe
- Hot days now (above 107°F)
- 7 days/yr
- Hot days in 30 yrs
- 31 days/yr
Wind risk 10/10 · Severe
- Chance of severe wind over 30 yrs
- 99.0%
Air-quality risk 3/10 · Minor
- Unhealthy air days now
- 2 days/yr
- Unhealthy air days in 30 yrs
- 2 days/yr
Risk factors via First Street. Map © Google.
Why this score? — see what drove the F grade
The composite is a weighted blend of 9 inputs, each scored 0–100. Each bar is that input's sub-score; the figure is the points it added to the 100-point composite (weight × sub-score).
- Cash flow +11.6/30.0
- Schools +4.1/10.0
- 1% rule +3.7/10.0
- Livability +3.5/5.0
- DSCR +3.4/10.0
- Condition / age +2.5/5.0
- Rent growth +2.3/5.0
- ARV discount +1.8/15.0
- Appreciation +0.0/10.0
$405,000
🖨 Deal sheet 📄 Offer letter ✓ Due diligence
Listing remarks
Discover contemporary townhome living in Cordera, a gated community in Bonita Springs. Built in 2016, this two-story residence offers three bedrooms, two-and-one-half baths and approximately 1,826 square feet of thoughtfully designed living space with lake and fountain views. The open-concept floor plan connects the kitchen, dining and living areas, creating a comfortable setting for everyday living and entertaining. The kitchen features granite countertops, 42-inch cabinetry and new stainless steel appliances, complemented by tile flooring throughout the main living areas and newer carpeting in the bedrooms. Sliding glass doors open to a paved lanai with northern exposure overlooking the c
Key facts
- Gated community
- Paved lanai
- Fitness center
Tags
Property features AI
Finance
- Other: Property is part of a complex with 138 units and 6 units in the building; single unit per floor and two floors total; Zoning: RPD; lot is designated as Lot Unit 107 with deeded restrictions including architectural controls and no RVs
- HOA & community: Mandatory HOA (professional management); Quarterly HOA fee; HOA covers cable, lawn/land maintenance, legal/accounting, reserves, street lights and street maintenance; Community amenities include pool, spa/hot tub, exercise room, community room, internet access, sidewalks, streetlights, and underground utilities; Gated community; Total annual recurring HOA fees listed as $4,600 and total one-time fees listed as $1,017
Exterior
- Parking: Attached 2-car garage; Paved driveway
- Security: Gated community
- Utilities: Central water; Central sewer; Cable available
- Home design: Residential townhouse; Two-story, carriage/coach style; Zero lot line; Rear exposure faces north; Located in the Cordera community (development)
- Construction: Built in 2016; Concrete block construction; Brick and stucco exterior; Tile roof
- Exterior features: Decorative shutters; Privacy wall; Automatic sprinkler system; Water feature/display; Shutters for storm protection; Single hung and sliding windows
Interior
- Kitchen: Pantry; Dishwasher; Disposal; Microwave; Range; Refrigerator/Freezer
- Bedrooms: 3 bedrooms; Master bedroom upstairs
- Flooring: Carpet; Tile
- Bathrooms: 2 full bathrooms; 1 half bathroom; Master bath with dual sinks and shower (no tub)
- Heating & cooling: Central electric heat; Central electric cooling; Ceiling fans
- Interior features: Cable prewire; Pantry; Smoke detectors; Walk-in closet; Breakfast bar and family dining area; Screened lanai/porch; Laundry in residence; Unfurnished
- Laundry & utility: Washer; Dryer; Auto garage door
Neighborhood map
What this means for you Summary
Snapshot
- This is a 3-bed/3.0-bath townhouse listed at $405k.
Deal economics
- At list price, monthly cash flow is $-123 ($-1k/yr) — negative.
- To cash-flow at today's rent, offer at most $383k (5.4% below list).
- To meet the 1% rule (rent ≥ 1% of price), the offer needs to be $352k (13.0% below list).
- Recommended offer: $352k (13.0% below list) — sets the bar for 1% rule.
- Cap rate 5.9% vs local median 1.7% in Bonita Springs — top-decile yield for the area; either an underpriced asset or a hidden risk that comps aren't pricing in. Stress-test before assuming the spread holds.
Location & tenants
- Location reads 70/100 on livability (#428 in FL) — a middle-class / working-renter tenant base. Strengths: crime A+, housing A+, employment A; Watch: schools C-, cost of living C-, health & safety D.
- Lee (suburban): math 47% / reading 50% proficiency, ranked #42 of 73 in FL (top 58%) — families likely to look elsewhere, expect single-tenant / working-renter base with shorter leases.
- Market conditions: Rents soft (-0.6%/yr); 835 active listings in the ZIP; 36 comparable units currently listed for rent nearby; rentals at typical pace (median 24d on market — plan ~3-4 weeks tenant-placement turnaround); solid renter incomes; 15,411 units permitted in Lee County in 2024 (4,686 in 5+ unit buildings).
- At $3,524/mo this rent would consume 46% of the median local household income ($91k/yr) (locally 976% of renters already pay >50% of income on rent) — very limited rent-growth headroom before tenants either downsize or default.
Forward outlook
- Local home prices are declining (-3.0%/yr); year-one equity from $3k of loan paydown is wiped out by about $12k of value loss. Plan a longer hold.
- Lee County population projected at +44% by 2050 — long-run rental-demand tailwind backs the buy-and-hold thesis.
Negotiation context
- It's been on market 22 days — a 2% lower offer ($399k) is reasonable based on typical stale-listing flexibility.
Risks & watch-outs
- Climate carrying-cost: severe wind risk, 99% chance of damaging wind over 30y; extreme-heat days projected 7→31/yr by 2055 (HVAC capex compounding) — expect insurance premiums to compound above CPI over the hold.
Questions for the listing agent
- What do current leases actually rent for vs. the listed asking? Can we see a recent rent roll and the last 12 months of T-12 income?
- What does the HOA fee cover, when was the last increase, and are there any pending special assessments or reserve-fund shortfalls?
- Is there a deadline driving the sale (1031 exchange, divorce, estate, relocation)? That informs how much negotiation room exists.
- The area grade is low — what's the realistic commute time and amenity access for the typical tenant pool here? Any planned neighborhood developments (good or bad) we should know about?
- What's the average days-on-market for RENTAL listings here right now (not sales)? A rising rental-DOM trend means longer vacancies and softer asking-rent achievability than the comps imply.
- What's the recent tenant-quality profile in this submarket — average credit score on applications, eviction rate, late-payment / NSF rate, and stable-employment percentage? A property-management company in the area should have these aggregated.
- How much new for-sale + rental construction is in the pipeline within 1–3 miles? Heavy new supply typically softens prices + rents 12–24 months out; constrained supply supports both.
Investment metrics
- 1% rule
- 0.87% ✗
- Cap rate
- 5.93%
- Cash-on-cash
- -1.30%
- DSCR
- 0.94
- GRM
- 9.6
CMA / ARV
- ARV (on-the-fly)
- $359,722
- Comps found
- 1
Show comp detail 1 sale within ~0.75 mi
| Address | Dist | Beds/Ba | Sqft | Sold | Price | $/sf | Match |
|---|---|---|---|---|---|---|---|
| 10804 Alvara Point Dr | 0.03mi | 3/2.5 | 1,826 (0%) | 2mo | $360,000 | $197 | 95 |
Match score weights: distance 35% · size 25% · config 20% · recency 20%. Top-matched comps best support the ARV.
Projected returns pro-forma
-3.0% appreciation · 0.0% rent growth · sell at horizon
- IRR
- -22.0%
- Equity multiple
- 0.26×
- Total profit
- $-83,666
- Equity at exit
- $60,387
- IRR
- -26.1%
- Equity multiple
- -0.08×
- Total profit
- $-122,362
- Equity at exit
- $35,017
Cash invested: $113,400 (down + closing). Projections, not guarantees.
Landlord ↔ Tenant lean methodology
- Overall (STATE)
- 87 Strongly Landlord-Friendly
- State Florida
- 87 Strongly Landlord-Friendly · R+3
- County
- — inherits STATE
- City
- — inherits STATE
ZIP-level market 34135
- Rents YoY
- -0.6%
- Active inventory
- 835
- Price-to-rent
- 9.6×
Monthly cashflow live
- Estimated rent
- $3,524 high interval (Pro) →
- Mortgage (P&I)
- −$2,124
- Tax from tax record
- −$231 /mo · $2,774/yr
- Insurance
- −$169
- HOA
- −$383
- Vacancy / Maint / Mgmt
- −$740
- Net cashflow
- $-123
Break-even live
UW: 25.0% down · 7.5% · 30yr · 1.5% tax · 5.0% vac · 8.0% maint · 8.0% mgmt
Financing live
Cash to close
- Down payment
- $101,250
- Closing costs
- $12,150
- Reserves months
- —
- Total cash needed
- —
Loan-product check · same deal, 3 products live
Conventional
25% down · 7.5% · 30yr
- Down + closing
- —
- Monthly P&I
- —
- Monthly cashflow
- —
- DSCR
- —
- Eligible?
- —
Personal DTI + credit; lowest rate.
DSCR
20% down · 8.5% · 30yr
- Down + closing
- —
- Monthly P&I
- —
- Monthly cashflow
- —
- DSCR
- —
- Eligible?
- —
No personal income docs; deal must DSCR.
Hard money
10% down · 12.0% · 12mo
- Down + closing
- —
- Monthly P&I
- —
- Monthly cashflow
- —
- DSCR
- —
- Eligible?
- —
Short-term bridge; refi at stabilization.
Rent comps 36 comps
| Address | Beds | Baths | Sqft | Rent | $/sqft | DOM | Units | Dist |
|---|---|---|---|---|---|---|---|---|
| 25224 Cordera Point Dr Bonita Springs, FL | 3.0 | 3.0 | 2033 | $3,900 | $1.92 | 23d | 1 | 0.07mi |
| 10850 Alvara Point Dr Bonita Springs, FL | 2.0 | 2.5 | 1628 | $4,000 | $2.46 | 23d | 1 | 0.08mi |
| 10818 Alvara Way Bonita Springs, FL | 2.0 | 2.5 | 1628 | $2,500 | $1.54 | 23d | 1 | 0.08mi |
| 25161 Killdeer Dr Bonita Springs, FL | 3.0 | 2.0 | 1777 | $3,200 | $1.80 | 14d | 1 | 0.17mi |
| 24920 Divot Dr Bonita Springs, FL | 4.0 | 2.5 | 2554 | $6,000 | $2.35 | 23d | 1 | 0.32mi |
| 10030 Maddox Ln #206 Bonita Springs, FL | 3.0 | 2.0 | 1327 | $2,150 | $1.62 | 21d | 1 | 0.73mi |
| 10522 Yorkstone Dr Bonita Springs, FL | 3.0 | 3.0 | 2032 | $6,000 | $2.95 | 23d | 1 | 0.75mi |
| 26414 Doverstone St Bonita Springs, FL | 3.0 | 2.0 | 2162 | $3,000 | $1.39 | 23d | 1 | 0.85mi |
| 10328 Windley Key Ter Bonita Springs, FL | 3.0 | 2.0 | 1400 | $2,600 | $1.86 | 14d | 1 | 0.87mi |
| 10304 Wishing Stone Ct Bonita Springs, FL | 4.0 | 3.0 | 2434 | $9,000 | $3.70 | 23d | 1 | 0.93mi |
| 26141 Palace Ln #201 Bonita Springs, FL | 3.0 | 2.0 | 1661 | $2,500 | $1.51 | 23d | 1 | 0.94mi |
| 11305 Monte Carlo Blvd #202 Bonita Springs, FL | 3.0 | 2.0 | 1532 | $2,980 | $1.95 | 11d | 1 | 0.96mi |
| 11305 Monte Carlo Blvd #202 Bonita Springs, FL | 3.0 | 2.0 | 1532 | $5,500 | $3.59 | 23d | 1 | 0.96mi |
| 25727 Lake Amelia Way #105 Bonita Springs, FL | 2.0 | 2.0 | 1230 | $2,200 | $1.79 | 23d | 1 | 0.99mi |
| 11181 Monte Carlo Blvd Bonita Springs, FL | 3.0 | 2.5 | 2611 | $3,550 | $1.36 | 16d | 1 | 1.02mi |
| 25735 Lake Amelia Way #105 Bonita Springs, FL | 2.0 | 2.0 | 1230 | $1,500 | $1.22 | 23d | 1 | 1.02mi |
| 26197 Palace Ln #102 Bonita Springs, FL | 2.0 | 2.0 | 1279 | $4,200 | $3.28 | 23d | 1 | 1.09mi |
| 11195 St Roman Way Bonita Springs, FL | 4.0 | 3.5 | 2432 | $4,250 | $1.75 | 23d | 1 | 1.11mi |
| 26407 Lucky Stone Rd #201 Bonita Springs, FL | 3.0 | 2.0 | 2178 | $3,200 | $1.47 | 23d | 1 | 1.15mi |
| 9510 Village View Blvd Bonita Springs, FL | 3.0 | 2.0 | 1587 | $3,700 | $2.33 | 23d | 1 | 1.18mi |
| 9371 Lake Abby Ln Bonita Springs, FL | 3.0 | 2.0 | 1796 | $2,850 | $1.59 | 23d | 1 | 1.20mi |
| 9304 Lake Abby Ln Bonita Springs, FL | 3.0 | 2.0 | 1631 | $3,700 | $2.27 | 3d | 1 | 1.28mi |
| 9251 Isla Bella Cir Bonita Springs, FL | 2.0 | 3.0 | 2070 | $6,000 | $2.90 | 23d | 1 | 1.28mi |
| 25356 Pinson Dr Bonita Springs, FL | 3.0 | 2.0 | 1454 | $3,800 | $2.61 | 23d | 1 | 1.28mi |
| 25356 Pinson Dr Bonita Springs, FL | 3.0 | 2.0 | 1454 | $3,800 | $2.61 | 3d | 1 | 1.28mi |
| 26240 Bonita Fairways Blvd Bonita Springs, FL | 3.0 | 2.5 | 1704 | $2,999 | $1.76 | 21d | 1 | 1.33mi |
| 26208 Bonita Fairways Blvd Bonita Springs, FL | 3.0 | 2.0 | 1940 | $3,400 | $1.75 | 16d | 1 | 1.34mi |
| 23810 Costa del Sol Rd #203 Estero, FL | 2.0 | 2.0 | 1276 | $2,400 | $1.88 | 16d | 1 | 1.35mi |
| 10911 Santa Margherita Rd #102 Estero, FL | 2.0 | 2.0 | 1279 | $2,800 | $2.19 | 23d | 1 | 1.35mi |
| 26391 Bonita Fairways Blvd Bonita Springs, FL | 3.0 | 2.5 | 2002 | $3,200 | $1.60 | 21d | 1 | 1.38mi |
| 26175 Bonita Fairways Blvd Bonita Springs, FL | 3.0 | 2.0 | 1308 | $3,000 | $2.29 | 16d | 1 | 1.38mi |
| 10910 Santa Margherita Rd #102 Estero, FL | 3.0 | 2.0 | 1279 | $2,200 | $1.72 | 23d | 1 | 1.39mi |
| 23821 Marbella Bay Rd Ofc Season Bonita Springs, FL | 2.0 | 2.0 | 1279 | $2,500 | $1.95 | 23d | 1 | 1.41mi |
| 23821 Marbella Bay Rd #102 Estero, FL | 2.0 | 2.0 | 1279 | $5,750 | $4.50 | 23d | 1 | 1.41mi |
| 26475 Bonita Fairways Blvd Bonita Springs, FL | 3.0 | 2.5 | 2171 | $3,800 | $1.75 | 23d | 1 | 1.42mi |
| 25925 Pebblecreek Dr Bonita Springs, FL | 2.0 | 2.0 | 1498 | $3,400 | $2.27 | 21d | 1 | 1.47mi |
HOA detail
- Monthly dues
- $383 · $4,596/yr
- Likely covers
- security
Listing history 14 events
-
2026-06-17days on market $405,000 Active 22 DOM
-
2026-06-16days on market $405,000 Active 21 DOM
-
2026-06-15days on market $405,000 Active 20 DOM
-
2026-06-13days on market $405,000 Active 18 DOM
-
2026-06-10days on market $405,000 Active 15 DOM
-
2026-06-09days on market $405,000 Active 14 DOM
-
2026-06-08days on market $405,000 Active 13 DOM
-
2026-06-07days on market $405,000 Active 12 DOM
-
2026-06-03days on market $405,000 Active 8 DOM
-
2026-06-02days on market $405,000 Active 7 DOM
-
2026-06-01days on market $405,000 Active 6 DOM
-
2026-05-31days on market $405,000 Active 5 DOM
-
2026-05-26price $405,000
-
2026-05-26$365,000 Active
ⓘ Source: listings_history table (triggers on properties + properties_extension) + one-shot
backfill from property_details.listing_events for pre-trigger history.
Tax reassessment forecast FL · Resets to sale price
- Current annual tax
- $2,774 · $231/mo
- Projected year-2 tax
- $3,362 · $280/mo
- Expected delta
- +$587/yr (+$49/mo · 21.2%)
ⓘ Screening estimate from a state-policy table — verify with the county assessor before closing.
Climate risk First Street
- Flood 1/10 Low FEMA zone X (shaded) · 0% chance over 30 yrs
- Wildfire 4/10 Moderate
- Heat 10/10 Extreme 7 d/yr ≥107°F today · 31 d/yr by 30 yrs out
- Wind 10/10 Extreme 99% chance of damaging wind over 30 yrs
- Air quality 3/10 Moderate 2 unhealthy d/yr today · 2 by 30 yrs out
Nearby sold comps map
Loading sold comps map…
Walkable amenities ~0.75 mi
Loading nearby amenities…
Taxation est. · year 1
- Rental income
- $42,286
- − Mortgage interest
- −$22,686
- − Property taxes
- −$2,774
- − Insurance
- −$2,025
- − Repairs & maintenance
- −$3,383
- − Management
- −$3,383
- − HOA
- −$4,596
- − Depreciation
- −$11,782
- Taxable loss
- −$8,343
- Est. tax savings @ 24.0%
- +$2,002
- After-tax cash flow
- $527/yr
For passive investors: Depreciation is non-cash, so a rental often shows a tax loss while cash-flowing — sheltering income. Rental losses are passive: they offset passive income freely, and up to $25,000/yr can offset ordinary (W-2) income if you actively participate and your MAGI is under $100k (phasing out to $0 by $150k); unused losses carry forward. On sale, claimed depreciation is recaptured at up to 25%, and gains may owe capital-gains tax (a 1031 exchange can defer both). Figures are a year-1 estimate at your 24.0% rate — not tax advice; consult a CPA.
Schools (NCES district)
- District
- Lee
- NCES district ID
- 1201080
- Math proficiency
- 47% ▼ -11.00%
- Reading proficiency
- 50% ▼ -4.00%
- Median HH income
- $49,518
- Composite
- 41.49/100
- National rank
- #3458
- State rank
- #42 of 73 in FL
Livability — Bonita Springs
- Score
- 70/100
- State rank
- #428
- US rank
- #7576
Category grades
Schools grade is shown separately in the Schools card above.
Census & demographics
- Census place
- Bonita Springs, FL
- County
- Lee County · 788,662 people
- City population
- 64,727
- Metro
- Cape Coral-Fort Myers, FL
- Population (ZIP)
- 48,252
- Household income
- $91,380
- Rent vs Own
- Severe rent burden
- 976.0
Population outlook (Lee County) Hauer SSP2
- Today (2025)
- 871,946 people
- By 2030
- 955,468 · +9.6%
- By 2040
- 1,113,587 · +27.7%
- By 2050
- 1,256,891 · +44.1%
- By 2075
- 1,560,270 · +78.9%
- By 2100
- 1,726,848 · +98.0%
Race, ethnicity, and origin ACS 2023
- Neighborhood character
- Predominantly White (69%)
- Race & ethnicity
- White 69% Hispanic / Latino 26% Two or more races 13% Native American 3% Black 2%
- Hispanic origin (detail)
- Mexican 8% Puerto Rican 4% Cuban 3%
- Common ancestry
- Romanian 5% Lithuanian 2% Slovak 2%
- Foreign-born
- 22% · Canada, Jamaica
- Languages at home
- 74% English-only · Spanish 21% French/Haitian/Cajun 1% Russian/Polish/Slavic 1%
Political lean MEDSL · Lee
- 2024 margin
- Strong R (+28.4) · D 35.5% · R 63.9%
- 2008→2024 swing
- -18.0pp toward R · 2008: -10.4pp · 2024: -28.4pp
- All cycles
- 2024: R+28.4 2020: R+19.2 2016: R+20.4 2012: R+16.6 2008: R+10.4
Not yet ingested
- Civics
- —
Market trends
- HPI YoY
- ▼ -188.86%
- Current HPI
- 243.4153
- Rent YoY
- ▼ -0.61%
- Metro
- Cape Coral-Fort Myers, FL
- State GDP YoY
- ▲ 3.28%
- F500 in state
- 36
Industry mix (Fortune 500 HQ in FL)
| Industry | F500 HQs | Revenue |
|---|---|---|
| Industrial Technology | 2 | $29B |
|
||
| Insurance | 2 | $17B |
|
||
| Retail | 1 | $60B |
|
||
| Technology Distribution | 1 | $58B |
|
||
| Homebuilding | 1 | $35B |
|
||
| Technology Manufacturing | 1 | $35B |
|
||
Price history
+11.0% since first listed2 events — show timeline
- 2026-05-26 Price Changed $405,000 NAPLESMLS
- 2026-05-26 Listed $365,000 NAPLESMLS
Property tax history
+32.9%/yrLatest (2025): $2,774 · +4.4% YoY. Source: county tax records.
Cash-flow waterfall
monthlySold comps — $/sqft
last 12 mo · ≤1 miLoading sold comps…