191 Co Rd 309 · New Houlka, MS
Flood risk 1/10 · Minimal
- FEMA flood zone
- X (unshaded)
- Chance of flooding over 30 yrs
- 0.0%
- Est. flood insurance / yr
- $507 – $1,088
Fire risk 5/10 · Moderate
- Est. fire insurance / yr
- $1,241 – $2,305
Heat risk 6/10 · Moderate
- Hot days now (above 108°F)
- 7 days/yr
- Hot days in 30 yrs
- 19 days/yr
Wind risk 6/10 · Moderate
- Chance of severe wind over 30 yrs
- 27.0%
Air-quality risk 1/10 · Minimal
- Unhealthy air days now
- 0 days/yr
- Unhealthy air days in 30 yrs
- 0 days/yr
Risk factors via First Street. Map © Google.
Why this score? — see what drove the C grade
The composite is a weighted blend of 9 inputs, each scored 0–100. Each bar is that input's sub-score; the figure is the points it added to the 100-point composite (weight × sub-score).
- Cash flow +19.0/30.0
- ARV discount +7.5/15.0
- Appreciation +6.5/10.0
- DSCR +6.0/10.0
- Schools +5.0/10.0
- 1% rule +4.3/10.0
- Livability +2.9/5.0
- Rent growth +2.5/5.0
- Condition / age +2.5/5.0
$97,500
🖨 Deal sheet 📄 Offer letter ✓ Due diligence
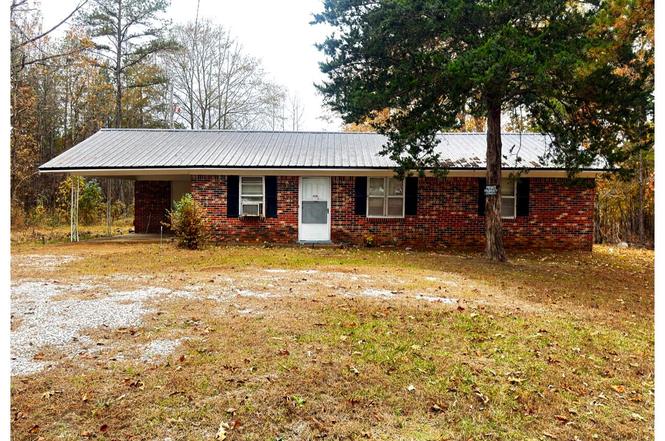
Listing remarks
This well-kept 3-bedroom, 1 bath, one owner home sits in a peaceful, secluded location where you can enjoy real privacy without the big price tag. The layout is move in ready, perfect for anyone wanting affordable ownership under 100k. Add your personal touch as you go and build equity while enjoying your own quiet space.
Key facts
- 1 acre lot
- Built 1975
- Listed 165 days
Neighborhood map
What this means for you Summary
Snapshot
- This is a 3-bed/1.0-bath single-family listed at $98k.
Deal economics
- At list price, monthly cash flow is $102 ($1k/yr) — positive.
- The deal already cash-flows at list — no discount required.
- To meet the 1% rule (rent ≥ 1% of price), the offer needs to be $91k (6.8% below list).
- Recommended offer: $86k (12.0% below list) — sets the bar for market timing.
Location & tenants
- Location reads 58/100 on livability (#272 in MS) — a working-class tenant base; expect higher turnover. Strengths: cost of living A+, housing A+; Watch: schools F, amenities F, commute F.
- Market conditions: 11 active listings in the ZIP; 7 units permitted in Chickasaw County in 2024 (0 in 5+ unit buildings).
Forward outlook
- In year one you build about $4k of equity ($674 loan paydown + $3k appreciation (2.9% local appreciation)).
- Chickasaw County population projected to shrink 7% by 2050 — rents likely to lag national; underwrite the cash flow, not the appreciation.
- At projected returns (2.9% appreciation + 3.0% rent growth), your $27k cash investment doubles in ~5 years — after that, you're playing with house money.
- By year 10, paydown + projected appreciation supports a ~$34k cash-out refi (75% LTV) — recoverable capital for the next deal without selling this one.
Negotiation context
- It's been on market 165 days — a 12% lower offer ($86k) is reasonable based on typical stale-listing flexibility.
- 2 sale attempts with the ask held roughly flat each time — persistent listings suggest the price (not the market) is what's stuck; bring a comps-based counter.
Risks & watch-outs
- Climate carrying-cost: major wind risk, 27% chance of damaging wind over 30y; moderate wildfire risk; extreme-heat days projected 7→19/yr by 2055 (HVAC capex compounding) — expect insurance premiums to compound above CPI over the hold.
Questions for the listing agent
- It's been on market 165 days. Have you received any prior offers? Is the seller open to a 12% concession, seller financing, or rate buy-down credit?
- Built in 1975 — when were the roof, HVAC, electrical panel, plumbing, and water heater last replaced?
- Why hasn't it sold? Are there any deal-killer items the seller is aware of (foundation, flood, title, zoning, code violations)?
- Is there a deadline driving the sale (1031 exchange, divorce, estate, relocation)? That informs how much negotiation room exists.
- Schools are F-rated, which usually means shorter tenancies and higher turnover. Who's the typical renter profile here, and what's been the actual vacancy rate?
- What's the average days-on-market for RENTAL listings here right now (not sales)? A rising rental-DOM trend means longer vacancies and softer asking-rent achievability than the comps imply.
- What's the recent tenant-quality profile in this submarket — average credit score on applications, eviction rate, late-payment / NSF rate, and stable-employment percentage? A property-management company in the area should have these aggregated.
- How much new for-sale + rental construction is in the pipeline within 1–3 miles? Heavy new supply typically softens prices + rents 12–24 months out; constrained supply supports both.
Investment metrics
- 1% rule
- 0.93% ✗
- Cap rate
- 7.54%
- Cash-on-cash
- 4.47%
- DSCR
- 1.20
- GRM
- 8.9
CMA / ARV
No comps found within radius.
Projected returns pro-forma
2.91% appreciation · 3.0% rent growth · sell at horizon
- IRR
- 11.4%
- Equity multiple
- 1.65×
- Total profit
- $17,740
- Equity at exit
- $43,353
- IRR
- 13.6%
- Equity multiple
- 3.00×
- Total profit
- $54,634
- Equity at exit
- $66,435
Cash invested: $27,300 (down + closing). Projections, not guarantees.
Landlord ↔ Tenant lean methodology
- Overall (STATE)
- 90 Strongly Landlord-Friendly
- State Mississippi
- 90 Strongly Landlord-Friendly · R+11
- County
- — inherits STATE
- City
- — inherits STATE
ZIP-level market 38850
- Home prices YoY
- 2.1%
- Active inventory
- 11
- Price-to-rent
- 8.9×
Monthly cashflow live
- Estimated rent
- $909 medium interval (Pro) →
- Mortgage (P&I)
- −$511
- Tax from tax record
- −$64 /mo · $770/yr
- Insurance
- −$41
- HOA
- −$0
- Vacancy / Maint / Mgmt
- −$191
- Net cashflow
- $102
Break-even live
UW: 25.0% down · 7.5% · 30yr · 1.5% tax · 5.0% vac · 8.0% maint · 8.0% mgmt
Financing live
Cash to close
- Down payment
- $24,375
- Closing costs
- $2,925
- Reserves months
- —
- Total cash needed
- —
Loan-product check · same deal, 3 products live
Conventional
25% down · 7.5% · 30yr
- Down + closing
- —
- Monthly P&I
- —
- Monthly cashflow
- —
- DSCR
- —
- Eligible?
- —
Personal DTI + credit; lowest rate.
DSCR
20% down · 8.5% · 30yr
- Down + closing
- —
- Monthly P&I
- —
- Monthly cashflow
- —
- DSCR
- —
- Eligible?
- —
No personal income docs; deal must DSCR.
Hard money
10% down · 12.0% · 12mo
- Down + closing
- —
- Monthly P&I
- —
- Monthly cashflow
- —
- DSCR
- —
- Eligible?
- —
Short-term bridge; refi at stabilization.
Listing history 5 events
-
2026-06-04status $97,500 Pending 165 DOM
-
2026-06-01days on market $97,500 Active 165 DOM
-
2026-05-31days on market $97,500 Active 164 DOM
-
2026-04-13status Active
-
2025-11-19$97,500 Active
ⓘ Source: listings_history table (triggers on properties + properties_extension) + one-shot
backfill from property_details.listing_events for pre-trigger history.
Tax reassessment forecast MS · Resets to sale price
- Current annual tax
- $770 · $64/mo
- Projected year-2 tax
- $770 · $64/mo
- Expected delta
- $0/yr ($0/mo · 0.0%)
ⓘ Screening estimate from a state-policy table — verify with the county assessor before closing.
Climate risk First Street
- Flood 1/10 Low FEMA zone X (unshaded) · 0% chance over 30 yrs
- Wildfire 5/10 Major
- Heat 6/10 Major 7 d/yr ≥108°F today · 19 d/yr by 30 yrs out
- Wind 6/10 Major 27% chance of damaging wind over 30 yrs
- Air quality 1/10 Low 0 unhealthy d/yr today · 0 by 30 yrs out
Nearby sold comps map
Loading sold comps map…
Walkable amenities ~0.75 mi
Loading nearby amenities…
Taxation est. · year 1
- Rental income
- $10,902
- − Mortgage interest
- −$5,462
- − Property taxes
- −$770
- − Insurance
- −$488
- − Repairs & maintenance
- −$872
- − Management
- −$872
- − Depreciation
- −$2,836
- Taxable loss
- −$397
- Est. tax savings @ 24.0%
- +$95
- After-tax cash flow
- $1,315/yr
For passive investors: Depreciation is non-cash, so a rental often shows a tax loss while cash-flowing — sheltering income. Rental losses are passive: they offset passive income freely, and up to $25,000/yr can offset ordinary (W-2) income if you actively participate and your MAGI is under $100k (phasing out to $0 by $150k); unused losses carry forward. On sale, claimed depreciation is recaptured at up to 25%, and gains may owe capital-gains tax (a 1031 exchange can defer both). Figures are a year-1 estimate at your 24.0% rate — not tax advice; consult a CPA.
Schools (NCES district)
No district data.
Livability — New Houlka
- Score
- 58/100
- State rank
- #272
- US rank
- #21346
Category grades
Schools grade is shown separately in the Schools card above.
Census & demographics
- Population (ZIP)
- 3,113
Population outlook (Chickasaw County) Hauer SSP2
- Today (2025)
- 17,070 people
- By 2030
- 16,849 · -1.3%
- By 2040
- 16,419 · -3.8%
- By 2050
- 15,899 · -6.9%
- By 2075
- 14,445 · -15.4%
- By 2100
- 12,062 · -29.3%
Race, ethnicity, and origin ACS 2023
- Neighborhood character
- Majority White (63%)
- Race & ethnicity
- White 63% Black 29% Hispanic / Latino 6% Two or more races 2%
- Hispanic origin (detail)
- Puerto Rican 4%
- Common ancestry
- Iranian 1%
- Foreign-born
- 1% · Canada
- Languages at home
- 97% English-only · Spanish 2%
Political lean MEDSL · Chickasaw
- 2024 margin
- R (+13.7) · D 42.7% · R 56.4%
- 2008→2024 swing
- -15.8pp toward R · 2008: 2.1pp · 2024: -13.7pp
- All cycles
- 2024: R+13.7 2020: R+4.5 2016: R+6.1 2012: D+4.1 2008: D+2.1
Not yet ingested
- Civics
- —
Market trends
- HPI YoY
- ▲ 2.91%
- Current HPI
- 141.0144
- Rent YoY
- —
- Metro
- —
- State GDP YoY
- —
- F500 in state
- 0
Price history
2 events — show timeline
- 2026-04-13 Relisted — NEMSBD
- 2025-11-19 Listed $97,500 NEMSBD
Property tax history
+0.5%/yrLatest (2024): $770 · +200.4% YoY. Source: county tax records.
Cash-flow waterfall
monthlySold comps — $/sqft
last 12 mo · ≤1 miLoading sold comps…