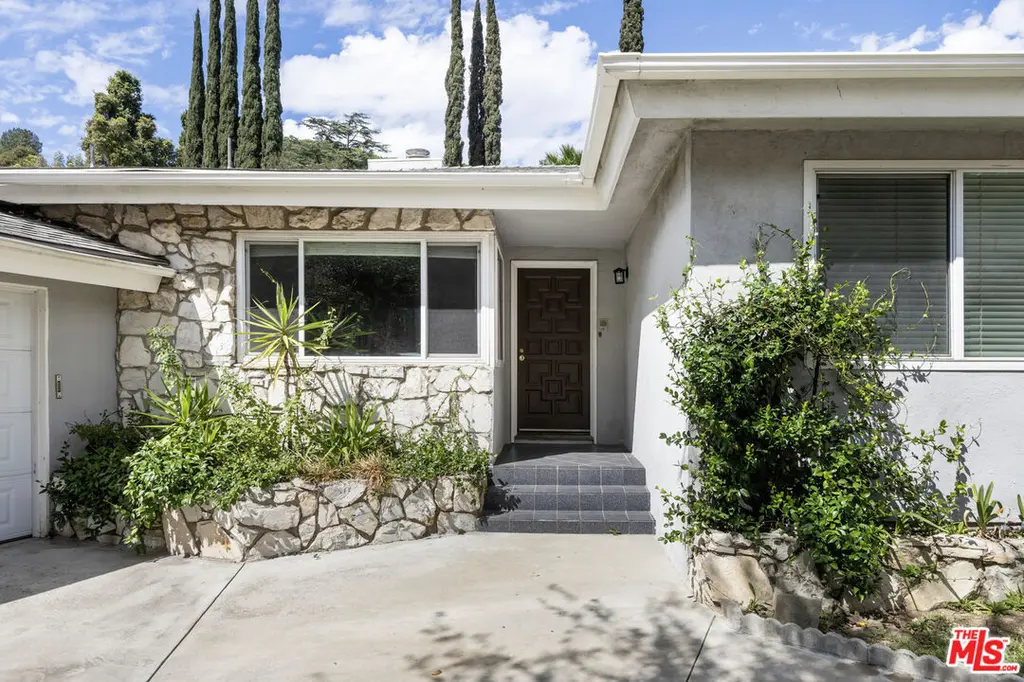
15508 Royal Ridge Rd · Los Angeles, CA
Flood risk 7/10 · Major
- FEMA flood zone
- X (unshaded)
- Chance of flooding over 30 yrs
- 0.77%
- Est. flood insurance / yr
- $507 – $1,088
Fire risk 5/10 · Moderate
- Est. fire insurance / yr
- $659 – $1,223
Heat risk 5/10 · Moderate
- Hot days now (above 91°F)
- 7 days/yr
- Hot days in 30 yrs
- 22 days/yr
Wind risk 1/10 · Minimal
- Chance of severe wind over 30 yrs
- —
Air-quality risk 4/10 · Minor
- Unhealthy air days now
- 5 days/yr
- Unhealthy air days in 30 yrs
- 5 days/yr
Risk factors via First Street. Map © Google.
Why this score? — see what drove the D grade
The composite is a weighted blend of 9 inputs, each scored 0–100. Each bar is that input's sub-score; the figure is the points it added to the 100-point composite (weight × sub-score).
- ARV discount +15.0/15.0
- Cash flow +7.4/30.0
- Appreciation +5.7/10.0
- Schools +3.6/10.0
- Livability +3.4/5.0
- Condition / age +2.5/5.0
- Rent growth +2.4/5.0
- DSCR +1.6/10.0
- 1% rule +1.0/10.0
$1,590,000
🖨 Deal sheet (PDF) 📄 Offer letter ✓ Due diligence
Listing remarks MLS
Set near the end of a cul-de-sac on desirable Royal Ridge Road in Sherman Oaks, this spacious 4-bedroom, 3.5-bathroom home offers 2,692 square feet of well-designed living space including a versatile 7.5' x 10' bonus room off of the living room, ideal for an office, gym, or playroom. This is a great family home that balances comfort and function with thoughtful details throughout. The entry feeds into light-filled living areas featuring two fireplaces and newer floors which create a fresh, inviting atmosphere. The kitchen flows easily to the dining area, making it perfect for everyday living or entertaining. A wet bar in the living room adds convenience when hosting gatherings. The primary suite provides a private retreat, while three additional bedrooms allow space for family, guests, or a home office. Bathrooms are well-appointed, offering both style and practicality. Step outside to a large pool and patio area, perfect for summer fun and relaxation. The yard takes advantage of the 8,893 sq ft lot. With its two-car, attached garage, ample storage, and flexible floor plan, this home is designed for modern living. Located in a sought-after Sherman Oaks, 15508 Royal Ridge Rd combines suburban comfort with easy access to local shops, dining, and freeways. Trust Sale.
Key facts
- Wet bar
- Large pool
- Patio area
Tags
Neighborhood map
What this means for you Summary
Snapshot
- This is a 4-bed/3.0-bath single-family listed at $1.59M.
Deal economics
- At list price, monthly cash flow is $-2k ($-25k/yr) — negative.
- To cash-flow at today's rent, offer at most $1.22M (23.1% below list).
- To meet the 1% rule (rent ≥ 1% of price), the offer needs to be $956k (39.9% below list).
- Recommended offer: $956k (39.9% below list) — sets the bar for 1% rule.
- Cap rate 4.8% vs local median 2.1% in Los Angeles — top-decile yield for the area; either an underpriced asset or a hidden risk that comps aren't pricing in. Stress-test before assuming the spread holds.
Location & tenants
- Location reads 68/100 on livability (#273 in CA) — a middle-class / working-renter tenant base. Strengths: amenities A+, commute A+, employment B; Watch: health & safety C-, crime F, cost of living F.
- Los Angeles Unified (urban): math 29% / reading 54% proficiency, ranked #223 of 517 in CA (top 43%) — families likely to look elsewhere, expect single-tenant / working-renter base with shorter leases; 67% free/reduced lunch — lower-income household profile, screen leases tightly.
- Zoned schools: Hesby Oaks Leadership Charter (501 students, 15% FRL, charter); Van Nuys Middle (869 students, 92% FRL); Van Nuys Senior High (math 40% / reading 56%, grade D, #380 of 1,170 statewide, top 33%, 2,323 students, 84% FRL) — zoned schools at 64% FRL track the district average.
- Market conditions: Rents soft (-0.6%/yr); 139 active listings in the ZIP; 39 comparable units currently listed for rent nearby; rentals lingering (median 46d on market — plan ~5-8 weeks vacancy on turnover, expect pricing pressure); 51% of comp listings sitting > 30 days — soft ceiling on asking rent; high-income renter base; 19,697 units permitted in Los Angeles County in 2024 (9,426 in 5+ unit buildings).
Forward outlook
- In year one you build about $32k of equity ($11k loan paydown + $21k appreciation (1.3% local appreciation)).
- Los Angeles County population projected at +9% by 2050 — modest demand growth; plan on rents tracking national, not racing it.
- By year 4, paydown + projected appreciation supports a ~$114k cash-out refi (75% LTV) — recoverable capital for the next deal without selling this one.
Negotiation context
- It's been on market 69 days — a 6% lower offer ($1.49M) is reasonable based on typical stale-listing flexibility.
- 2 sale attempts with the ask held roughly flat each time — persistent listings suggest the price (not the market) is what's stuck; bring a comps-based counter.
- Current owner paid $488k; list at $1.59M implies a 226% gain — meaningful room to come down on a strong offer.
Risks & watch-outs
- Watch-outs: flood insurance adds $66/mo; built in 1958 — expect roof / HVAC / electrical / plumbing capex.
- Climate carrying-cost: major flood risk; moderate wildfire risk; extreme-heat days projected 7→22/yr by 2055 (HVAC capex compounding) — expect insurance premiums to compound above CPI over the hold.
Questions for the listing agent
- What do current leases actually rent for vs. the listed asking? Can we see a recent rent roll and the last 12 months of T-12 income?
- It's been on market 69 days. Have you received any prior offers? Is the seller open to a 40% concession, seller financing, or rate buy-down credit?
- Built in 1958 — when were the roof, HVAC, electrical panel, plumbing, and water heater last replaced?
- What's the actual annual flood-insurance premium (NFIP or private), and is the property in a SFHA with mandatory coverage?
- Why hasn't it sold? Are there any deal-killer items the seller is aware of (foundation, flood, title, zoning, code violations)?
- Is there a deadline driving the sale (1031 exchange, divorce, estate, relocation)? That informs how much negotiation room exists.
- Schools are D-rated, which usually means shorter tenancies and higher turnover. Who's the typical renter profile here, and what's been the actual vacancy rate?
- Crime grade is F in this area — have there been break-ins, vandalism, or insurance claims at this property in the last 3 years? What carrier currently insures it and at what premium?
- The area grade is low — what's the realistic commute time and amenity access for the typical tenant pool here? Any planned neighborhood developments (good or bad) we should know about?
- What's the average days-on-market for RENTAL listings here right now (not sales)? A rising rental-DOM trend means longer vacancies and softer asking-rent achievability than the comps imply.
- What's the recent tenant-quality profile in this submarket — average credit score on applications, eviction rate, late-payment / NSF rate, and stable-employment percentage? A property-management company in the area should have these aggregated.
- How much new for-sale + rental construction is in the pipeline within 1–3 miles? Heavy new supply typically softens prices + rents 12–24 months out; constrained supply supports both.
Investment metrics
- 1% rule
- 0.60% ✗
- Cap rate
- 4.77%
- Cash-on-cash
- -5.43%
- DSCR
- 0.76
- GRM
- 13.9
CMA / ARV
- ARV (median comp)
- $2,429,085
- List price
- $1,590,000
- Delta
- -34.54%
- Verdict
- UNDERPRICED
- Comps
- 20 within 1.0 mi
Show comp detail 12 sales within ~0.75 mi
| Address | Dist | Beds/Ba | Sqft | Sold | Price | $/sf | Match |
|---|---|---|---|---|---|---|---|
| 15936 Valley Wood Rd | 0.42mi | 4/3.5 | 2,700 (+0%) | 2mo | $1,850,000 | $685 | 76 |
| 3421 Castlewoods Pl | 0.42mi | 4/3.0 | 2,807 (+4%) | 5mo | $1,885,000 | $672 | 69 |
| 3342 Alana Dr | 0.49mi | 4/3.5 | 2,730 (+1%) | 9mo | $2,200,000 | $806 | 66 |
| 3921 Cody Rd | 0.54mi | 3/3.0 (-1) | 2,661 (-1%) | 5mo | $2,695,000 | $1,013 | 64 |
| 4031 Deerhorn Dr | 0.48mi | 4/3.0 | 2,850 (+6%) | 7mo | $2,420,000 | $849 | 62 |
| 3586 Alana Dr | 0.67mi | 4/3.0 | 2,601 (-3%) | 1mo | $1,852,500 | $712 | 62 |
| 3517 Scadlock Ln | 0.20mi | 3/3.0 (-1) | 2,311 (-14%) | 3mo | $1,737,500 | $752 | 60 |
| 3535 Vista Haven Rd | 0.26mi | 4/4.0 | 3,064 (+14%) | 4mo | $3,300,000 | $1,077 | 58 |
| 16141 Bayberry Pl | 0.73mi | 4/5.0 | 2,662 (-1%) | 3mo | $2,205,000 | $828 | 54 |
| 16138 Meadowcrest Rd | 0.72mi | 4/3.0 | 2,560 (-5%) | 6mo | $1,848,000 | $722 | 53 |
| 3563 Alana Dr | 0.63mi | 4/3.0 | 2,993 (+11%) | 5mo | $1,775,000 | $593 | 48 |
| 3328 Red Rose Dr | 0.72mi | 5/5.0 (+1) | 3,024 (+12%) | 2mo | $2,950,000 | $976 | 31 |
Match score weights: distance 35% · size 25% · config 20% · recency 20%. Top-matched comps best support the ARV.
Projected returns pro-forma
1.33% appreciation · 0.0% rent growth · sell at horizon
- IRR
- -4.6%
- Equity multiple
- 0.76×
- Total profit
- $-105,379
- Equity at exit
- $570,641
- IRR
- -0.8%
- Equity multiple
- 0.90×
- Total profit
- $-42,307
- Equity at exit
- $780,344
Cash invested: $445,200 (down + closing). Projections, not guarantees.
Landlord ↔ Tenant lean methodology
- Overall (CITY)
- 0 Strongly Tenant-Friendly
- State California
- 18 Strongly Tenant-Friendly · D+13
- County
- — inherits STATE
- City Los Angeles
- 0 Strongly Tenant-Friendly · D+22
ZIP-level market 91403
- Home prices YoY
- 0.3%
- Rents YoY
- -0.6%
- Active inventory
- 139
- Price-to-rent
- 13.9×
Monthly cashflow live
- Estimated rent
- $9,564 high interval (Pro) →
- Mortgage (P&I)
- −$8,338
- Tax from tax record
- −$570 /mo · $6,835/yr
- Insurance
- −$662
- Flood insurance flood zone
- −$66 /mo · $798/yr
- HOA
- −$0
- Vacancy / Maint / Mgmt
- −$2,008
- Net cashflow
- $-2,081
Break-even live
Sensitivity live
| Price | -10% $-1,181 | -5% $-1,631 | +0% $-2,081 | +5% $-2,532 | +10% $-2,982 |
|---|---|---|---|---|---|
| Rent | -10% $-2,837 | -5% $-2,459 | +0% $-2,081 | +5% $-1,704 | +10% $-1,326 |
| Rate | -1.0pp $-1,281 | -0.5pp $-1,677 | base $-2,081 | +0.5pp $-2,493 | +1.0pp $-2,913 |
UW: 25.0% down · 7.5% · 30yr · 1.5% tax · 5.0% vac · 8.0% maint · 8.0% mgmt
Financing live
Cash to close
- Down payment
- $397,500
- Closing costs
- $47,700
- Reserves months
- —
- Total cash needed
- —
Loan-product check · same deal, 3 products live
Conventional
25% down · 7.5% · 30yr
- Down + closing
- —
- Monthly P&I
- —
- Monthly cashflow
- —
- DSCR
- —
- Eligible?
- —
Personal DTI + credit; lowest rate.
DSCR
20% down · 8.5% · 30yr
- Down + closing
- —
- Monthly P&I
- —
- Monthly cashflow
- —
- DSCR
- —
- Eligible?
- —
No personal income docs; deal must DSCR.
Hard money
10% down · 12.0% · 12mo
- Down + closing
- —
- Monthly P&I
- —
- Monthly cashflow
- —
- DSCR
- —
- Eligible?
- —
Short-term bridge; refi at stabilization.
Rent comps 39 comps
| Address | Beds | Baths | Sqft | Rent | $/sqft | DOM | Units | Dist |
|---|---|---|---|---|---|---|---|---|
| 15626 Royal Ridge Rd Sherman Oaks, CA | 3.0 | 2.5 | 2816 | $14,000 | $4.97 | 5d | 1 | 0.11mi |
| 3423 Scadlock Ln Sherman Oaks, CA | 5.0 | 4.5 | 3200 | $10,000 | $3.12 | 45d | 1 | 0.28mi |
| 15672 Castlewoods Dr Sherman Oaks, CA | 5.0 | 5.0 | 3718 | $12,500 | $3.36 | 45d | 1 | 0.36mi |
| 3852 Sherview Dr Sherman Oaks, CA | 4.0 | 3.0 | 2080 | $10,000 | $4.81 | 26d | 1 | 0.62mi |
| 15434 Mulholland Dr Los Angeles, CA | 4.0 | 4.0 | 2704 | $12,900 | $4.77 | 9d | 1 | 0.64mi |
| 15434 Mulholland Dr Los Angeles, CA | 4.0 | 4.0 | 2704 | $12,900 | $4.77 | 45d | 1 | 0.64mi |
| 3474 Loadstone Dr Sherman Oaks, CA | 3.0 | 2.5 | 2593 | $7,500 | $2.89 | 19d | 1 | 0.70mi |
| 3637 Loadstone Dr Sherman Oaks, CA | 4.0 | 3.5 | 3052 | $13,995 | $4.59 | 45d | 1 | 0.73mi |
| 15146 Mulholland Dr Los Angeles, CA | 3.0 | 2.0 | 2414 | $16,900 | $7.00 | 45d | 1 | 0.74mi |
| 3734 Loadstone Dr Sherman Oaks, CA | 3.0 | 2.5 | 2332 | $9,000 | $3.86 | 45d | 1 | 0.78mi |
| 3751 Stone Canyon Ave Sherman Oaks, CA | 3.0 | 2.0 | 1944 | $6,200 | $3.19 | 45d | 1 | 0.78mi |
| 4340 Sepulveda Blvd Sherman Oaks, CA | 3.0 | 2.5 | 2100 | $4,750 | $2.26 | 26d | 1 | 0.83mi |
| 15434 Sutton St Sherman Oaks, CA | 4.0 | 4.0 | 3477 | $11,999 | $3.45 | 45d | 1 | 0.93mi |
| 3770 Ballina Canyon Rd Encino, CA | 4.0 | 3.5 | 2576 | $7,995 | $3.10 | 45d | 1 | 1.03mi |
| 3635 Fawndale Pl Sherman Oaks, CA | 5.0 | 3.0 | 3645 | $14,995 | $4.11 | 9d | 1 | 1.03mi |
| 3067 Corda Dr Los Angeles, CA | 4.0 | 4.0 | 3265 | $6,995 | $2.14 | 46d | 1 | 1.06mi |
| 15344 Greenleaf St Sherman Oaks, CA | 3.0 | 2.0 | 2104 | $5,000 | $2.38 | 6d | 1 | 1.07mi |
| 14676 Deervale Pl Sherman Oaks, CA | 4.0 | 3.0 | 3441 | $7,999 | $2.32 | 26d | 1 | 1.10mi |
| 2536 Roscomare Rd Los Angeles, CA | 3.0 | 3.0 | 1930 | $8,250 | $4.27 | 45d | 1 | 1.10mi |
| 4166 Crisp Canyon Rd Sherman Oaks, CA | 5.0 | 4.0 | 3044 | $8,000 | $2.63 | 24d | 1 | 1.12mi |
| 16379 Meadowridge Rd Encino, CA | 4.0 | 3.0 | 3014 | $9,250 | $3.07 | 46d | 1 | 1.18mi |
| 16379 Meadowridge Rd Encino, CA | 4.0 | 3.0 | 3014 | $9,250 | $3.07 | 7d | 1 | 1.18mi |
| 3812 Westfall Dr Encino, CA | 4.0 | 4.5 | 3639 | $12,000 | $3.30 | 26d | 1 | 1.23mi |
| 2390 Nalin Dr Los Angeles, CA | 4.0 | 2.5 | 2483 | $8,750 | $3.52 | 45d | 1 | 1.30mi |
| 14937 Dickens St #109 Sherman Oaks, CA | 3.0 | 3.5 | 1865 | $4,500 | $2.41 | 45d | 1 | 1.30mi |
| 2391 Roscomare Rd #201 Los Angeles, CA | 3.0 | 3.0 | 2670 | $10,500 | $3.93 | 45d | 1 | 1.36mi |
| 2391 Roscomare Rd #401 Los Angeles, CA | 3.0 | 3.5 | 2610 | $13,000 | $4.98 | 45d | 1 | 1.36mi |
| 3771 Longview Valley Rd Sherman Oaks, CA | 3.0 | 3.0 | 2044 | $16,000 | $7.83 | 45d | 1 | 1.38mi |
| 3539 Beverly Ridge Dr Sherman Oaks, CA | 5.0 | 3.5 | 2986 | $21,450 | $7.18 | 26d | 1 | 1.39mi |
| 3539 Beverly Ridge Dr Sherman Oaks, CA | 5.0 | 3.5 | 2986 | $18,500 | $6.20 | 5d | 1 | 1.39mi |
| 16666 Oldham St Encino, CA | 4.0 | 4.0 | 3050 | $12,000 | $3.93 | 19d | 1 | 1.39mi |
| 3446 Alginet Dr Encino, CA | 4.0 | 3.0 | 3462 | $7,950 | $2.30 | 26d | 1 | 1.41mi |
| 15424 Camarillo St Sherman Oaks, CA | 3.0 | 3.0 | 2077 | $4,795 | $2.31 | 21d | 1 | 1.41mi |
| 15424 Camarillo St Sherman Oaks, CA | 3.0 | 2.5 | 2077 | $4,795 | $2.31 | 26d | 1 | 1.41mi |
| 4743 Halbrent Ave Sherman Oaks, CA | 3.0 | 2.0 | 1895 | $5,500 | $2.90 | 20d | 1 | 1.44mi |
| 3642 Beverly Ridge Dr Sherman Oaks, CA | 4.0 | 4.0 | 2994 | $19,800 | $6.61 | 16d | 1 | 1.45mi |
| 4014 Rogen Dr Encino, CA | 3.0 | 2.0 | 2157 | $5,999 | $2.78 | 45d | 1 | 1.45mi |
| 4825 Gloria Ave Encino, CA | 3.0 | 3.0 | 2477 | $8,250 | $3.33 | 45d | 1 | 1.47mi |
| 4450 Hayvenhurst Ave Encino, CA | 4.0 | 4.0 | 3058 | $12,000 | $3.92 | 45d | 1 | 1.49mi |
Listing history 20 events
-
2026-06-21days on market $1,590,000 Active 69 DOM
-
2026-06-18days on market $1,590,000 Active 66 DOM
-
2026-06-17days on market $1,590,000 Active 65 DOM
-
2026-06-16days on market $1,590,000 Active 64 DOM
-
2026-06-15days on market $1,590,000 Active 63 DOM
-
2026-06-13days on market $1,590,000 Active 61 DOM
-
2026-06-09days on market $1,590,000 Active 57 DOM
-
2026-06-08days on market $1,590,000 Active 56 DOM
-
2026-06-07days on market $1,590,000 Active 55 DOM
-
2026-06-04days on market $1,590,000 Active 52 DOM
-
2026-06-03days on market $1,590,000 Active 51 DOM
-
2026-06-02days on market $1,590,000 Active 50 DOM
-
2026-06-01days on market $1,590,000 Active 49 DOM
-
2026-05-31days on market $1,590,000 Active 48 DOM
-
2026-05-11price $1,590,000 1285-char remark
Show marketing remark (1285 chars)
Set near the end of a cul-de-sac on desirable Royal Ridge Road in Sherman Oaks, this spacious 4-bedroom, 3.5-bathroom home offers 2,692 square feet of well-designed living space including a versatile 7.5' x 10' bonus room off of the living room, ideal for an office, gym, or playroom. This is a great family home that balances comfort and function with thoughtful details throughout. The entry feeds into light-filled living areas featuring two fireplaces and newer floors which create a fresh, inviting atmosphere. The kitchen flows easily to the dining area, making it perfect for everyday living or entertaining. A wet bar in the living room adds convenience when hosting gatherings. The primary suite provides a private retreat, while three additional bedrooms allow space for family, guests, or a home office. Bathrooms are well-appointed, offering both style and practicality. Step outside to a large pool and patio area, perfect for summer fun and relaxation. The yard takes advantage of the 8,893 sq ft lot. With its two-car, attached garage, ample storage, and flexible floor plan, this home is designed for modern living. Located in a sought-after Sherman Oaks, 15508 Royal Ridge Rd combines suburban comfort with easy access to local shops, dining, and freeways. Trust Sale.
-
2026-04-13$1,649,000 Active 1285-char remark
Show marketing remark (1285 chars)
Set near the end of a cul-de-sac on desirable Royal Ridge Road in Sherman Oaks, this spacious 4-bedroom, 3.5-bathroom home offers 2,692 square feet of well-designed living space including a versatile 7.5' x 10' bonus room off of the living room, ideal for an office, gym, or playroom. This is a great family home that balances comfort and function with thoughtful details throughout. The entry feeds into light-filled living areas featuring two fireplaces and newer floors which create a fresh, inviting atmosphere. The kitchen flows easily to the dining area, making it perfect for everyday living or entertaining. A wet bar in the living room adds convenience when hosting gatherings. The primary suite provides a private retreat, while three additional bedrooms allow space for family, guests, or a home office. Bathrooms are well-appointed, offering both style and practicality. Step outside to a large pool and patio area, perfect for summer fun and relaxation. The yard takes advantage of the 8,893 sq ft lot. With its two-car, attached garage, ample storage, and flexible floor plan, this home is designed for modern living. Located in a sought-after Sherman Oaks, 15508 Royal Ridge Rd combines suburban comfort with easy access to local shops, dining, and freeways. Trust Sale.
-
2025-11-11price
-
2025-09-27Active
-
1990-01-17soldstatus $488,000
-
1985-09-30soldstatus $265,000
ⓘ Source: listings_history table (triggers on properties + properties_extension) + one-shot
backfill from property_details.listing_events for pre-trigger history.
Tax reassessment forecast CA · Resets to sale price
- Current annual tax
- $6,835 · $570/mo
- Projected year-2 tax
- $12,084 · $1,007/mo
- Expected delta
- +$5,249/yr (+$437/mo · 76.8%)
ⓘ Screening estimate from a state-policy table — verify with the county assessor before closing.
Climate risk First Street
- Flood 7/10 Severe FEMA zone X (unshaded) · 77% chance over 30 yrs
- Wildfire 5/10 Major
- Heat 5/10 Major 7 d/yr ≥91°F today · 22 d/yr by 30 yrs out
- Wind 1/10 Low
- Air quality 4/10 Moderate 5 unhealthy d/yr today · 5 by 30 yrs out
Nearby sold comps map
Loading sold comps map…
Walkable amenities ~0.75 mi
Loading nearby amenities…
Taxation est. · year 1
- Rental income
- $114,763
- − Mortgage interest
- −$89,065
- − Property taxes
- −$6,835
- − Insurance
- −$8,748
- − Repairs & maintenance
- −$9,181
- − Management
- −$9,181
- − Depreciation
- −$46,255
- Taxable loss
- −$54,501
- Est. tax savings @ 24.0%
- +$13,080
- After-tax cash flow
- $-11,897/yr
For passive investors: Depreciation is non-cash, so a rental often shows a tax loss while cash-flowing — sheltering income. Rental losses are passive: they offset passive income freely, and up to $25,000/yr can offset ordinary (W-2) income if you actively participate and your MAGI is under $100k (phasing out to $0 by $150k); unused losses carry forward. On sale, claimed depreciation is recaptured at up to 25%, and gains may owe capital-gains tax (a 1031 exchange can defer both). Figures are a year-1 estimate at your 24.0% rate — not tax advice; consult a CPA.
Schools (NCES district)
- District
- Los Angeles Unified
- NCES district ID
- 0622710
- Math proficiency
- 29% ▼ -4.00%
- Reading proficiency
- 54% ▲ 10.00%
- Median HH income
- $50,403
- Composite
- 35.67/100
- National rank
- #4875
- State rank
- #223 of 517 in CA
Livability — Los Angeles
- Score
- 68/100
- State rank
- #273
- US rank
- #9237
Category grades
Schools grade is shown separately in the Schools card above.
Census & demographics
- Census place
- Los Angeles, CA
- County
- Los Angeles County · 9,444,647 people
- City population
- 3,838,149
- Metro
- Los Angeles-Long Beach-Anaheim, CA
- Population (ZIP)
- 25,793
- Household income
- $116,170
- Rent vs Own
- Severe rent burden
- 1750.0
Population outlook (Los Angeles County) Hauer SSP2
- Today (2025)
- 10,940,515 people
- By 2030
- 11,256,481 · +2.9%
- By 2040
- 11,729,929 · +7.2%
- By 2050
- 11,948,407 · +9.2%
- By 2075
- 11,818,114 · +8.0%
- By 2100
- 10,842,928 · -0.9%
Race, ethnicity, and origin ACS 2023
- Neighborhood character
- Diverse neighborhood (Simpson 0.55)
- Race & ethnicity
- White 64% Hispanic / Latino 16% Two or more races 13% Asian 7% Black 6%
- Hispanic origin (detail)
- Mexican 8%
- Common ancestry
- Scotch-Irish 8% Romanian 4% Subsaharan African 3%
- Foreign-born
- 24% · Canada, South Korea, Dominican Republic
- Languages at home
- 67% English-only · Other Indo-European 10% Spanish 9% Russian/Polish/Slavic 5%
Political lean MEDSL · Los Angeles
- 2024 margin
- Solid D (+32.9) · D 64.8% · R 31.9% · Other 3.3%
- 2008→2024 swing
- -7.4pp toward R · 2008: 40.4pp · 2024: 32.9pp
- All cycles
- 2024: D+32.9 2020: D+44.2 2016: D+48.0 2012: D+40.0 2008: D+40.4
Not yet ingested
- Civics
- —
Market trends
- HPI YoY
- ▲ 1.33%
- Current HPI
- 441.2872
- Rent YoY
- ▼ -0.56%
- Metro
- Los Angeles-Long Beach-Anaheim, CA
- State GDP YoY
- ▲ 3.21%
- F500 in state
- 116
Industry mix (Fortune 500 HQ in CA)
| Industry | F500 HQs | Revenue |
|---|---|---|
| Technology | 27 | $1,492B |
|
||
| Financial Services | 3 | $174B |
|
||
| Retail | 3 | $44B |
|
||
| Insurance | 3 | $26B |
|
||
| Media / Entertainment | 2 | $115B |
|
||
| Pharmaceuticals / Biotech | 2 | $62B |
|
||
Price history
+500.0% since first listed6 events — show timeline
- 2026-05-11 Price Changed $1,590,000 TheMLS
- 2026-04-13 Listed $1,649,000 TheMLS
- 2025-11-11 Price Changed — TheMLS
- 2025-09-27 Listed — TheMLS
- 1990-01-17 Sold (Public Records) $488,000 Public Records
- 1985-09-30 Sold (Public Records) $265,000 Public Records
Property tax history
+1.8%/yrLatest (2025): $6,835 · +2.5% YoY. Source: county tax records.
Cash-flow waterfall
monthlySold comps — $/sqft
last 12 mo · ≤1 miLoading sold comps…