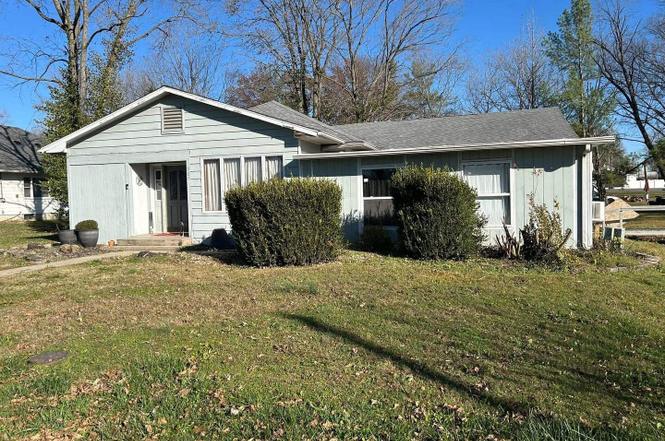
307 N Pine St · De Soto, IL
Flood risk 1/10 · Minimal
- FEMA flood zone
- X (unshaded)
- Chance of flooding over 30 yrs
- 0.0%
- Est. flood insurance / yr
- $507 – $1,088
Fire risk 1/10 · Minimal
- Est. fire insurance / yr
- $804 – $1,492
Heat risk 5/10 · Moderate
- Hot days now (above 107°F)
- 7 days/yr
- Hot days in 30 yrs
- 21 days/yr
Wind risk 2/10 · Minimal
- Chance of severe wind over 30 yrs
- 3.0%
Air-quality risk 2/10 · Minimal
- Unhealthy air days now
- 0 days/yr
- Unhealthy air days in 30 yrs
- 1 days/yr
Risk factors via First Street. Map © Google.
Why this score? — see what drove the D- grade
The composite is a weighted blend of 9 inputs, each scored 0–100. Each bar is that input's sub-score; the figure is the points it added to the 100-point composite (weight × sub-score).
- Cash flow +10.1/30.0
- ARV discount +7.5/15.0
- 1% rule +4.8/10.0
- Livability +3.6/5.0
- DSCR +2.9/10.0
- Rent growth +2.5/5.0
- Condition / age +2.5/5.0
- Schools +2.4/10.0
- Appreciation +0.0/10.0
$99,900
🖨 Deal sheet (PDF) 📄 Offer letter ✓ Due diligence
Listing remarks
This 3 bedroom, 2 bath home has a lot of updates, including a new laundry room. New electric panel installed in 2024. With a main living room, family room, and extra room that could be used as a fourth bedroom, office, playroom, or whatever your needs might be, space is not an issue with this home. Home has a deck that overlooks the large backyard.
Key facts
- Garage
- Built 1962
- Listed 24 days
Property features AI
Finance
- Other: Property not indicated as rebuilt; Built before 1978
Exterior
- Parking: Attached garage (1 car)
- Utilities: Public water; Public sewer; 200+ amp electrical service
- Home design: Detached single-family home; One-story; Fee simple ownership
- Construction: Built 61–70 years ago; Wood siding and frame construction; Block foundation
- Exterior features: Lot dimensions approximately 150 x 28 x 134; Lot size between 0.25 and 0.49 acre; Lot includes other / unspecified features
Interior
- Kitchen: Kitchen with eating area (12 x 24)
- Bedrooms: 3 bedrooms total; Master bedroom on main level (12 x 12) with full master bath; Second bedroom on main level (12 x 10); Third bedroom on main level (12 x 10)
- Flooring: Carpet in bedrooms and master; Vinyl flooring in kitchen
- Bathrooms: 2 full bathrooms
- Heating & cooling: Electric heating; Central air conditioning
- Interior features: Living room (15 x 21); Eating area / table space in kitchen
Neighborhood map
What this means for you Summary
Snapshot
- This is a 1-bed/2.0-bath single-family listed at $100k.
Deal economics
- At list price, monthly cash flow is $-59 ($-705/yr) — negative.
- To cash-flow at today's rent, offer at most $90k (10.4% below list).
- To meet the 1% rule (rent ≥ 1% of price), the offer needs to be $98k (1.6% below list).
- Recommended offer: $90k (10.4% below list) — sets the bar for cash-flow.
Location & tenants
- Location reads 71/100 on livability (#344 in IL) — a middle-class / working-renter tenant base. Strengths: crime A+, cost of living A+, health & safety A+; Watch: amenities F, commute F, employment D-.
- Carbondale Chsd 165 (urban): math 26% / reading 35% proficiency, ranked #279 of 620 in IL (top 45%) — families likely to look elsewhere, expect single-tenant / working-renter base with shorter leases.
- Zoned schools: Desoto Elementary School (math 17% / reading 17%, grade F, #1,141 of 2,056 statewide, top 59%, 180 students, 0% FRL); Carbondale Comm H S (math 26% / reading 35%, grade F, #175 of 693 statewide, top 26%, 997 students, 0% FRL).
- Market conditions: 18 active listings in the ZIP; 5 units permitted in Jackson County in 2024 (0 in 5+ unit buildings).
Forward outlook
- Local home prices are declining (-3.0%/yr); year-one equity from $691 of loan paydown is wiped out by about $3k of value loss. Plan a longer hold.
Negotiation context
- It's been on market 25 days — a 2% lower offer ($98k) is reasonable based on typical stale-listing flexibility.
- 4 sale attempts since 19y ago with the ask held roughly flat each time — persistent listings suggest the price (not the market) is what's stuck; bring a comps-based counter.
Risks & watch-outs
- Watch-outs: property tax is 3.2% of price.
- Climate carrying-cost: extreme-heat days projected 7→21/yr by 2055 (HVAC capex compounding) — expect insurance premiums to compound above CPI over the hold.
Questions for the listing agent
- What do current leases actually rent for vs. the listed asking? Can we see a recent rent roll and the last 12 months of T-12 income?
- Built in 1962 — when were the roof, HVAC, electrical panel, plumbing, and water heater last replaced?
- Property tax is high relative to price — has the assessment been appealed recently, and will the sale trigger a re-assessment?
- Is there a deadline driving the sale (1031 exchange, divorce, estate, relocation)? That informs how much negotiation room exists.
- Schools are F-rated, which usually means shorter tenancies and higher turnover. Who's the typical renter profile here, and what's been the actual vacancy rate?
- The area grade is low — what's the realistic commute time and amenity access for the typical tenant pool here? Any planned neighborhood developments (good or bad) we should know about?
- What's the average days-on-market for RENTAL listings here right now (not sales)? A rising rental-DOM trend means longer vacancies and softer asking-rent achievability than the comps imply.
- What's the recent tenant-quality profile in this submarket — average credit score on applications, eviction rate, late-payment / NSF rate, and stable-employment percentage? A property-management company in the area should have these aggregated.
- How much new for-sale + rental construction is in the pipeline within 1–3 miles? Heavy new supply typically softens prices + rents 12–24 months out; constrained supply supports both.
Investment metrics
- 1% rule
- 0.98% ✗
- Cap rate
- 5.59%
- Cash-on-cash
- -2.52%
- DSCR
- 0.89
- GRM
- 8.5
CMA / ARV
No comps found within radius.
Projected returns pro-forma
-3.0% appreciation · 3.0% rent growth · sell at horizon
- IRR
- -20.3%
- Equity multiple
- 0.29×
- Total profit
- $-19,827
- Equity at exit
- $14,895
- IRR
- -13.2%
- Equity multiple
- 0.23×
- Total profit
- $-21,661
- Equity at exit
- $8,638
Cash invested: $27,972 (down + closing). Projections, not guarantees.
Landlord ↔ Tenant lean methodology
- Overall (STATE)
- 43 Moderately Tenant-Leaning
- State Illinois
- 43 Moderately Tenant-Leaning · D+7
- County
- — inherits STATE
- City
- — inherits STATE
ZIP-level market 62924
- Home prices YoY
- -18.9%
- Active inventory
- 18
- Price-to-rent
- 8.5×
Monthly cashflow live
- Estimated rent
- $983 medium interval (Pro) →
- Mortgage (P&I)
- −$524
- Tax from tax record
- −$270 /mo · $3,242/yr
- Insurance
- −$42
- HOA
- −$0
- Vacancy / Maint / Mgmt
- −$207
- Net cashflow
- $-59
Break-even live
Sensitivity live
| Price | -10% $-2 | -5% $-30 | +0% $-59 | +5% $-87 | +10% $-115 |
|---|---|---|---|---|---|
| Rent | -10% $-136 | -5% $-98 | +0% $-59 | +5% $-20 | +10% $19 |
| Rate | -1.0pp $-8 | -0.5pp $-33 | base $-59 | +0.5pp $-85 | +1.0pp $-111 |
UW: 25.0% down · 7.5% · 30yr · 1.5% tax · 5.0% vac · 8.0% maint · 8.0% mgmt
Financing live
Cash to close
- Down payment
- $24,975
- Closing costs
- $2,997
- Reserves months
- —
- Total cash needed
- —
Loan-product check · same deal, 3 products live
Conventional
25% down · 7.5% · 30yr
- Down + closing
- —
- Monthly P&I
- —
- Monthly cashflow
- —
- DSCR
- —
- Eligible?
- —
Personal DTI + credit; lowest rate.
DSCR
20% down · 8.5% · 30yr
- Down + closing
- —
- Monthly P&I
- —
- Monthly cashflow
- —
- DSCR
- —
- Eligible?
- —
No personal income docs; deal must DSCR.
Hard money
10% down · 12.0% · 12mo
- Down + closing
- —
- Monthly P&I
- —
- Monthly cashflow
- —
- DSCR
- —
- Eligible?
- —
Short-term bridge; refi at stabilization.
Listing history 33 events
-
2026-06-22days on market $99,900 Active 25 DOM
-
2026-06-19days on market $99,900 Active 22 DOM
-
2026-06-18days on market $99,900 Active 21 DOM
-
2026-06-17days on market $99,900 Active 20 DOM
-
2026-06-16days on market $99,900 Active 19 DOM
-
2026-06-15days on market $99,900 Active 18 DOM
-
2026-06-14days on market $99,900 Active 16 DOM
-
2026-06-13days on market $99,900 Active 15 DOM
-
2026-06-10days on market $99,900 Active 13 DOM
-
2026-06-09days on market $99,900 Active 12 DOM
-
2026-06-08days on market $99,900 Active 11 DOM
-
2026-06-07days on market $99,900 Active 10 DOM
-
2026-06-02days on market $99,900 Active 5 DOM
-
2026-06-01days on market $99,900 Active 4 DOM
-
2026-05-31days on market $99,900 Active 3 DOM
-
2026-05-30days on market $99,900 Active 2 DOM
-
2026-05-24status Active
-
2026-03-20price $99,900
-
2026-02-02status Active
-
2025-12-26historical
-
2025-12-05historical
-
2025-12-04historical
-
2025-09-10price
-
2025-07-20price
-
2025-03-31price
-
2024-12-04Active
-
2021-08-06historical
-
2012-07-03historical
-
2010-12-27historical
-
2007-08-31soldstatus $102,500
-
2007-08-21$103,000
-
2005-06-30historical
-
2004-11-25historical
ⓘ Source: listings_history table (triggers on properties + properties_extension) + one-shot
backfill from property_details.listing_events for pre-trigger history.
Tax reassessment forecast IL · Partial reset (capped growth)
- Current annual tax
- $3,242 · $270/mo
- Projected year-2 tax
- $3,242 · $270/mo
- Expected delta
- $0/yr ($0/mo · 0.0%)
ⓘ Screening estimate from a state-policy table — verify with the county assessor before closing.
Climate risk First Street
- Flood 1/10 Low FEMA zone X (unshaded) · 0% chance over 30 yrs
- Wildfire 1/10 Low
- Heat 5/10 Major 7 d/yr ≥107°F today · 21 d/yr by 30 yrs out
- Wind 2/10 Low 3% chance of damaging wind over 30 yrs
- Air quality 2/10 Low 0 unhealthy d/yr today · 1 by 30 yrs out
Nearby sold comps map
Loading sold comps map…
Walkable amenities ~0.75 mi
Loading nearby amenities…
Taxation est. · year 1
- Rental income
- $11,801
- − Mortgage interest
- −$5,596
- − Property taxes
- −$3,242
- − Insurance
- −$500
- − Repairs & maintenance
- −$944
- − Management
- −$944
- − Depreciation
- −$2,906
- Taxable loss
- −$2,331
- Est. tax savings @ 24.0%
- +$559
- After-tax cash flow
- $-146/yr
For passive investors: Depreciation is non-cash, so a rental often shows a tax loss while cash-flowing — sheltering income. Rental losses are passive: they offset passive income freely, and up to $25,000/yr can offset ordinary (W-2) income if you actively participate and your MAGI is under $100k (phasing out to $0 by $150k); unused losses carry forward. On sale, claimed depreciation is recaptured at up to 25%, and gains may owe capital-gains tax (a 1031 exchange can defer both). Figures are a year-1 estimate at your 24.0% rate — not tax advice; consult a CPA.
Schools (NCES district)
- District
- Carbondale Chsd 165
- NCES district ID
- 1708370
- Math proficiency
- 26% ▼ -10.00%
- Reading proficiency
- 35% ▼ -2.00%
- Median HH income
- $22,075
- Composite
- 23.92/100
- National rank
- #7787
- State rank
- #279 of 620 in IL
Livability — De Soto
- Score
- 71/100
- State rank
- #344
- US rank
- #6956
Category grades
Schools grade is shown separately in the Schools card above.
Census & demographics
- Census place
- De Soto, IL
- Population (ZIP)
- 3,064
Population outlook (Jackson County) Hauer SSP2
- Today (2025)
- 59,093 people
- By 2030
- 59,628 · +0.9%
- By 2040
- 59,495 · +0.7%
- By 2050
- 58,811 · -0.5%
- By 2075
- 57,683 · -2.4%
- By 2100
- 55,337 · -6.4%
Race, ethnicity, and origin ACS 2023
- Neighborhood character
- Predominantly White (93%)
- Race & ethnicity
- White 93% Two or more races 4% Black 2%
- Common ancestry
- Romanian 2% Slovak 2% Lithuanian 1%
- Foreign-born
- 1%
- Languages at home
- 99% English-only · Spanish 1%
Political lean MEDSL · Jackson
- 2024 margin
- Toss-up / Even · D 51.0% · R 47.5% · Other 1.4%
- 2008→2024 swing
- -18.3pp toward R · 2008: 21.8pp · 2024: 3.5pp
- All cycles
- 2024: D+3.5 2020: D+1.3 2016: D+3.0 2012: D+10.3 2008: D+21.8
Not yet ingested
- Civics
- —
Market trends
- HPI YoY
- ▼ -25.98%
- Current HPI
- 111.185
- Rent YoY
- —
- Metro
- —
- State GDP YoY
- ▲ 1.59%
- F500 in state
- 60
Industry mix (Fortune 500 HQ in IL)
| Industry | F500 HQs | Revenue |
|---|---|---|
| Insurance | 4 | $201B |
|
||
| Consumer Goods | 4 | $87B |
|
||
| Industrial Machinery | 3 | $64B |
|
||
| Healthcare | 2 | $55B |
|
||
| Retail / Pharmacy | 1 | $148B |
|
||
| Agriculture / Food | 1 | $86B |
|
||
Price history
-3.0% since first listed17 events — show timeline
- 2026-05-24 Relisted — MRED as Distributed by MLS Grid
- 2026-03-20 Price Changed $99,900 MRED as Distributed by MLS Grid
- 2026-02-02 Relisted — MRED as Distributed by MLS Grid
- 2025-12-26 Listing Removed — MRED as Distributed by MLS Grid
- 2025-12-05 Listing Removed — RMLSA as Distributed by MLS Grid
- 2025-12-04 Listing Removed — MRED as Distributed by MLS Grid
- 2025-09-10 Price Changed — RMLSA as Distributed by MLS Grid
- 2025-07-20 Price Changed — RMLSA as Distributed by MLS Grid
- 2025-03-31 Price Changed — RMLSA as Distributed by MLS Grid
- 2024-12-04 Listed — RMLSA as Distributed by MLS Grid
- 2021-08-06 Listing Removed — RMLSA as Distributed by MLS Grid
- 2012-07-03 Listing Removed — MRED as Distributed by MLS Grid
- 2010-12-27 Listing Removed — MRED as Distributed by MLS Grid
- 2007-08-31 Sold (MLS) $102,500 MRED as Distributed by MLS Grid
- 2007-08-21 Listed $103,000 MRED as Distributed by MLS Grid
- 2005-06-30 Listing Removed — MRED as Distributed by MLS Grid
- 2004-11-25 Listing Removed — MRED as Distributed by MLS Grid
Property tax history
+7.1%/yrLatest (2024): $3,242 · +8.2% YoY. Source: county tax records.
Cash-flow waterfall
monthlySold comps — $/sqft
last 12 mo · ≤1 miLoading sold comps…