110 W Cleveland St · Malden, MO
Flood risk 1/10 · Minimal
- FEMA flood zone
- X
- Chance of flooding over 30 yrs
- 0.0%
- Est. flood insurance / yr
- $473 – $860
Fire risk 1/10 · Minimal
- Est. fire insurance / yr
- $1,054 – $1,958
Heat risk 6/10 · Moderate
- Hot days now (above 110°F)
- 7 days/yr
- Hot days in 30 yrs
- 20 days/yr
Wind risk 3/10 · Minor
- Chance of severe wind over 30 yrs
- 6.0%
Air-quality risk 2/10 · Minimal
- Unhealthy air days now
- 1 days/yr
- Unhealthy air days in 30 yrs
- 1 days/yr
Risk factors via First Street. Map © Google.
Why this score? — see what drove the B grade
The composite is a weighted blend of 9 inputs, each scored 0–100. Each bar is that input's sub-score; the figure is the points it added to the 100-point composite (weight × sub-score).
- Cash flow +30.0/30.0
- 1% rule +10.0/10.0
- DSCR +10.0/10.0
- ARV discount +7.5/15.0
- Appreciation +6.6/10.0
- Livability +3.0/5.0
- Rent growth +2.5/5.0
- Condition / age +2.5/5.0
- Schools +2.0/10.0
$38,242
🖨 Deal sheet 📄 Offer letter ✓ Due diligence
Listing remarks
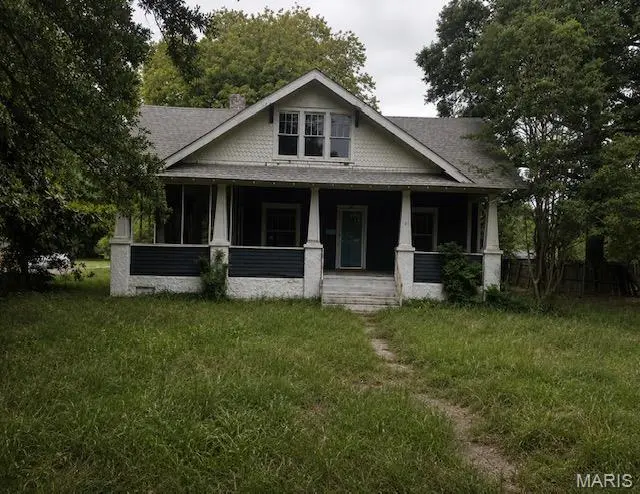
Charming older home built in 1910 featuring a large open front porch full of character and curb appeal. This home offers approximately 1,742 SF of living space with 2 bedrooms and 2 bathrooms, along with a spacious living room, kitchen, and dining room. Additional features include an approximately 800 SF partial unfinished basement, wood siding, shingle roof, and an attached one-car carport. Situated on a corner lot, this property combines vintage charm with plenty of potential. Available at www. mynextbid.com
Key facts
- Open front porch
- Wood siding
- Shingle roof
Tags
Property features AI
Exterior
- Parking: Carport (1 space)
- Utilities: Public water; Public sewer; Electricity available (220 volts); Natural gas available
- Home design: Single-family residence; One and one-half stories
- Construction: Wood siding
- Exterior features: City lot; Corner lot
Interior
- Bedrooms: 2 bedrooms on the main level
- Bathrooms: 1 full bathroom; 1 half bathroom
- Heating & cooling: Forced air heating; Central air conditioning
- Interior features: Partial basement; Living room fireplace
Neighborhood map
What this means for you Summary
Snapshot
- This is a 2-bed/1.5-bath other listed at $38k.
Deal economics
- At list price, monthly cash flow is $579 ($7k/yr) — positive.
- The deal already cash-flows at list — no discount required.
- Meets the 1% rule at list price ($1k rent vs $38k).
- Recommended offer: $37k (3.0% below list) — sets the bar for market timing.
- Cap rate 24.5% vs local median 7.3% in Malden — top-decile yield for the area; either an underpriced asset or a hidden risk that comps aren't pricing in. Stress-test before assuming the spread holds.
Location & tenants
- Location reads 59/100 on livability (#572 in MO) — a working-class tenant base; expect higher turnover. Strengths: cost of living A+, housing A+; Watch: health & safety C-, crime F, amenities F.
- Malden R-I (town): math 19% / reading 31% proficiency, ranked #294 of 324 in MO (top 91%) — low school quality limits family demand, transient renter base, plan for 1-2y turnover; 63% free/reduced lunch — lower-income household profile, screen leases tightly.
- Zoned schools: Malden Lower Elem. (math 23% / reading 35%, grade F, #842 of 1,115 statewide, top 76%, 454 students, 100% FRL); Malden High (math 12% / reading 27%, grade F, #478 of 521 statewide, top 92%, 425 students, 100% FRL) — zoned schools average 100% FRL vs 63% district-wide (37 pts higher); higher-poverty schools than district average — tighter screening recommended.
- Market conditions: 35 active listings in the ZIP; 30 units permitted in Dunklin County in 2024 (0 in 5+ unit buildings).
Forward outlook
- In year one you build about $2k of equity ($264 loan paydown + $1k appreciation (3.3% local appreciation)).
- Dunklin County population projected at -22% by 2050 — secular population decline; favor cash flow + early exit over multi-decade hold.
- At projected returns (3.3% appreciation + 3.0% rent growth), your $11k cash investment doubles in ~2 years — after that, you're playing with house money.
Negotiation context
- It's been on market 42 days — a 3% lower offer ($37k) is reasonable based on typical stale-listing flexibility.
Risks & watch-outs
- Watch-outs: built in 1910 — expect roof / HVAC / electrical / plumbing capex.
- Climate carrying-cost: extreme-heat days projected 7→20/yr by 2055 (HVAC capex compounding) — expect insurance premiums to compound above CPI over the hold.
Questions for the listing agent
- It's been on market 42 days. Have you received any prior offers? Is the seller open to a 3% concession, seller financing, or rate buy-down credit?
- Built in 1910 — when were the roof, HVAC, electrical panel, plumbing, and water heater last replaced?
- Is there a deadline driving the sale (1031 exchange, divorce, estate, relocation)? That informs how much negotiation room exists.
- Schools are F-rated, which usually means shorter tenancies and higher turnover. Who's the typical renter profile here, and what's been the actual vacancy rate?
- Crime grade is F in this area — have there been break-ins, vandalism, or insurance claims at this property in the last 3 years? What carrier currently insures it and at what premium?
- What's the average days-on-market for RENTAL listings here right now (not sales)? A rising rental-DOM trend means longer vacancies and softer asking-rent achievability than the comps imply.
- What's the recent tenant-quality profile in this submarket — average credit score on applications, eviction rate, late-payment / NSF rate, and stable-employment percentage? A property-management company in the area should have these aggregated.
- How much new for-sale + rental construction is in the pipeline within 1–3 miles? Heavy new supply typically softens prices + rents 12–24 months out; constrained supply supports both.
Investment metrics
- 1% rule
- 2.74% ✓
- Cap rate
- 24.46%
- Cash-on-cash
- 64.87%
- DSCR
- 3.89
- GRM
- 3.0
CMA / ARV
- ARV (median comp)
- $112,082
- List price
- $38,242
- Delta
- -65.88%
- Verdict
- UNDERPRICED
- Comps
- 20 within 1.0 mi
Projected returns pro-forma
3.26% appreciation · 3.0% rent growth · sell at horizon
- IRR
- 69.9%
- Equity multiple
- 4.92×
- Total profit
- $42,009
- Equity at exit
- $17,754
- IRR
- 69.2%
- Equity multiple
- 10.08×
- Total profit
- $97,247
- Equity at exit
- $27,804
Cash invested: $10,708 (down + closing). Projections, not guarantees.
Landlord ↔ Tenant lean methodology
- Overall (STATE)
- 81 Strongly Landlord-Friendly
- State Missouri
- 81 Strongly Landlord-Friendly · R+10
- County
- — inherits STATE
- City
- — inherits STATE
ZIP-level market 63863
- Home prices YoY
- 2.9%
- Active inventory
- 35
- Price-to-rent
- 3.0×
Monthly cashflow live
- Estimated rent
- $1,049 medium interval (Pro) →
- Mortgage (P&I)
- −$201
- Tax from tax record
- −$33 /mo · $402/yr
- Insurance
- −$16
- HOA
- −$0
- Vacancy / Maint / Mgmt
- −$220
- Net cashflow
- $579
Break-even live
UW: 25.0% down · 7.5% · 30yr · 1.5% tax · 5.0% vac · 8.0% maint · 8.0% mgmt
Financing live
Cash to close
- Down payment
- $9,560
- Closing costs
- $1,147
- Reserves months
- —
- Total cash needed
- —
Loan-product check · same deal, 3 products live
Conventional
25% down · 7.5% · 30yr
- Down + closing
- —
- Monthly P&I
- —
- Monthly cashflow
- —
- DSCR
- —
- Eligible?
- —
Personal DTI + credit; lowest rate.
DSCR
20% down · 8.5% · 30yr
- Down + closing
- —
- Monthly P&I
- —
- Monthly cashflow
- —
- DSCR
- —
- Eligible?
- —
No personal income docs; deal must DSCR.
Hard money
10% down · 12.0% · 12mo
- Down + closing
- —
- Monthly P&I
- —
- Monthly cashflow
- —
- DSCR
- —
- Eligible?
- —
Short-term bridge; refi at stabilization.
Listing history 18 events
-
2026-06-18days on market $38,242 Active 42 DOM
-
2026-06-17days on market $38,242 Active 41 DOM
-
2026-06-16days on market $38,242 Active 40 DOM
-
2026-06-15days on market $38,242 Active 39 DOM
-
2026-06-13days on market $38,242 Active 37 DOM
-
2026-06-12days on market $38,242 Active 36 DOM
-
2026-06-09days on market $38,242 Active 33 DOM
-
2026-06-09remarks 516-char remark
-
2026-06-09price $38,242 Active 32 DOM
-
2026-06-08days on market $40,225 Active 32 DOM
-
2026-06-07days on market $40,225 Active 31 DOM
-
2026-06-07days on market $40,225 Active 30 DOM
-
2026-06-04days on market $40,225 Active 27 DOM
-
2026-06-02days on market $40,225 Active 26 DOM
-
2026-06-01days on market $40,225 Active 25 DOM
-
2026-05-31days on market $40,225 Active 24 DOM
-
2026-05-07$40,225 Active 483-char remark
-
2000-07-14soldstatus
ⓘ Source: listings_history table (triggers on properties + properties_extension) + one-shot
backfill from property_details.listing_events for pre-trigger history.
Tax reassessment forecast MO · Resets to sale price
- Current annual tax
- $402 · $33/mo
- Projected year-2 tax
- $402 · $33/mo
- Expected delta
- $0/yr ($0/mo · 0.0%)
ⓘ Screening estimate from a state-policy table — verify with the county assessor before closing.
Climate risk First Street
- Flood 1/10 Low FEMA zone X · 0% chance over 30 yrs
- Wildfire 1/10 Low
- Heat 6/10 Major 7 d/yr ≥110°F today · 20 d/yr by 30 yrs out
- Wind 3/10 Moderate 6% chance of damaging wind over 30 yrs
- Air quality 2/10 Low 1 unhealthy d/yr today · 1 by 30 yrs out
Nearby sold comps map
Loading sold comps map…
Walkable amenities ~0.75 mi
Loading nearby amenities…
Taxation est. · year 1
- Rental income
- $12,590
- − Mortgage interest
- −$2,142
- − Property taxes
- −$402
- − Insurance
- −$191
- − Repairs & maintenance
- −$1,007
- − Management
- −$1,007
- − Depreciation
- −$1,112
- Taxable income
- $6,728
- Est. tax owed @ 24.0%
- −$1,615
- After-tax cash flow
- $5,332/yr
For passive investors: Depreciation is non-cash, so a rental often shows a tax loss while cash-flowing — sheltering income. Rental losses are passive: they offset passive income freely, and up to $25,000/yr can offset ordinary (W-2) income if you actively participate and your MAGI is under $100k (phasing out to $0 by $150k); unused losses carry forward. On sale, claimed depreciation is recaptured at up to 25%, and gains may owe capital-gains tax (a 1031 exchange can defer both). Figures are a year-1 estimate at your 24.0% rate — not tax advice; consult a CPA.
Schools (NCES district)
- District
- Malden R-I
- NCES district ID
- 2919890
- Math proficiency
- 19% ▼ -13.00%
- Reading proficiency
- 31% ▼ -3.00%
- Median HH income
- $29,537
- Composite
- 20.06/100
- National rank
- #8656
- State rank
- #294 of 324 in MO
Livability — Malden
- Score
- 59/100
- State rank
- #572
- US rank
- #20610
Category grades
Schools grade is shown separately in the Schools card above.
Census & demographics
- Census place
- Malden, MO
- City population
- 5,348
- Population (ZIP)
- 5,348
Population outlook (Dunklin County) Hauer SSP2
- Today (2025)
- 28,599 people
- By 2030
- 27,230 · -4.8%
- By 2040
- 24,696 · -13.6%
- By 2050
- 22,402 · -21.7%
- By 2075
- 17,776 · -37.8%
- By 2100
- 13,890 · -51.4%
Race, ethnicity, and origin ACS 2023
- Neighborhood character
- Predominantly White (79%)
- Race & ethnicity
- White 79% Black 11% Two or more races 6% Hispanic / Latino 3%
- Common ancestry
- Italian 3% Slovak 2% Serbian 2%
- Foreign-born
- 2% · Canada
- Languages at home
- 97% English-only · Spanish 3% Other Indo-European 1%
Political lean MEDSL · Dunklin
- 2024 margin
- Solid R (+61.8) · D 18.8% · R 80.5%
- 2008→2024 swing
- -40.5pp toward R · 2008: -21.3pp · 2024: -61.8pp
- All cycles
- 2024: R+61.8 2020: R+57.0 2016: R+53.6 2012: R+30.2 2008: R+21.3
Not yet ingested
- Civics
- —
Market trends
- HPI YoY
- ▲ 3.26%
- Current HPI
- 116.067
- Rent YoY
- —
- Metro
- —
- State GDP YoY
- ▲ 1.84%
- F500 in state
- 20
Industry mix (Fortune 500 HQ in MO)
| Industry | F500 HQs | Revenue |
|---|---|---|
| Healthcare | 1 | $163B |
|
||
| Insurance | 1 | $21B |
|
||
| Industrial Technology | 1 | $17B |
|
||
| Retail | 1 | $16B |
|
||
| Industrial Distribution | 1 | $10B |
|
||
| Utilities | 1 | $9B |
|
||
Price history
-4.9% since first listed3 events — show timeline
- 2026-06-08 Price Changed $38,242 MARIS as Distributed by MLS Grid
- 2026-05-07 Listed $40,225 MARIS as Distributed by MLS Grid
- 2000-07-14 Sold (Public Records) — Public Records
Property tax history
+3.1%/yrLatest (2025): $402 · +2.5% YoY. Source: county tax records.
Cash-flow waterfall
monthlySold comps — $/sqft
last 12 mo · ≤1 miLoading sold comps…