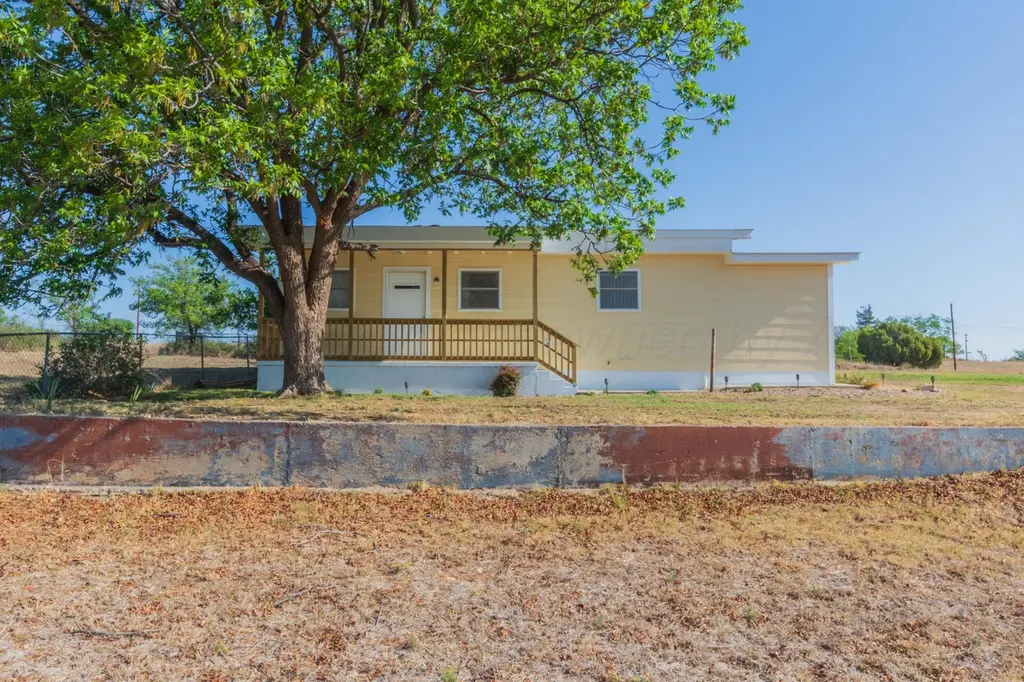
110 Dawn Dr · Howardwick, TX
Flood risk 1/10 · Minimal
- FEMA flood zone
- —
- Chance of flooding over 30 yrs
- 0.0%
- Est. flood insurance / yr
- —
Fire risk 10/10 · Severe
- Est. fire insurance / yr
- $1,222 – $2,270
Heat risk 5/10 · Moderate
- Hot days now (above 103°F)
- 7 days/yr
- Hot days in 30 yrs
- 19 days/yr
Wind risk 2/10 · Minimal
- Chance of severe wind over 30 yrs
- 1.0%
Air-quality risk 1/10 · Minimal
- Unhealthy air days now
- 0 days/yr
- Unhealthy air days in 30 yrs
- 0 days/yr
Risk factors via First Street. Map © Google.
Why this score? — see what drove the F grade
The composite is a weighted blend of 9 inputs, each scored 0–100. Each bar is that input's sub-score; the figure is the points it added to the 100-point composite (weight × sub-score).
- ARV discount +7.5/15.0
- Appreciation +6.8/10.0
- Cash flow +6.5/30.0
- Schools +4.3/10.0
- Livability +3.0/5.0
- Rent growth +2.5/5.0
- Condition / age +2.5/5.0
- DSCR +0.8/10.0
- 1% rule +0.7/10.0
$185,000
🖨 Deal sheet (PDF) 📄 Offer letter ✓ Due diligence
Listing remarks
Charming property just minutes from the lake sitting on nearly 1/2 an acre! This updated home offers a spacious layout with a large living room featuring beautiful exposed beams, a completely remodeled kitchen with tile flooring, and a remodeled oversized bathroom. Recent improvements include all new PEX plumbing, blow in insulation, new septic system, fresh exterior paint, mostly new windows, and a mini split system with 4 heads for efficient heating and cooling. The large utility room offers flexibility and could easily serve as a mud room or small third bedroom. Outside you'll find a covered back patio, screened-in porch, storm shelter, mature pecan tree, 30x30 shop, and an RV pad with r
Key facts
- New pex plumbing
- Remodeled kitchen
- New septic system
Tags
Property features AI
Exterior
- Parking: Detached 2-car garage; RV access/parking
- Utilities: Public water; Septic tank sewer
- Home design: Single-family residence; One story
- Exterior features: Corner lot; 0.4-acre lot
Interior
- Kitchen: Oven; Dishwasher; Refrigerator
- Bathrooms: One full bathroom
- Heating & cooling: Ceiling fans for cooling
- Interior features: Ceiling fan(s); Electric water heater; Workshop on the property
Neighborhood map
What this means for you Summary
Snapshot
- This is a 2-bed/1.0-bath single-family listed at $185k.
Deal economics
- At list price, monthly cash flow is $-310 ($-4k/yr) — negative.
- To cash-flow at today's rent, offer at most $130k (29.6% below list).
- To meet the 1% rule (rent ≥ 1% of price), the offer needs to be $105k (43.4% below list).
- Recommended offer: $105k (43.4% below list) — sets the bar for 1% rule.
Location & tenants
- Location reads 59/100 on livability (#1,173 in TX) — a working-class tenant base; expect higher turnover. Strengths: cost of living A+, housing A+; Watch: crime F, amenities F, commute F.
- Clarendon ISD (rural): math 49% / reading 54% proficiency, ranked #175 of 826 in TX (top 21%) — acceptable for families but not a draw, mixed tenant base, ~2y average lease.
- Zoned schools: Clarendon El (math 47% / reading 57%, grade C-, #742 of 4,322 statewide, top 19%, 215 students, 61% FRL); Clarendon J H (math 52% / reading 47%, grade C, #356 of 1,662 statewide, top 23%, 88 students, 56% FRL); Clarendon H S (math 54% / reading 64%, grade C+, #275 of 1,632 statewide, top 19%, 131 students, 33% FRL) — zoned schools at 50% FRL track the district average.
- Market conditions: 49 active listings in the ZIP; 1 units permitted in Donley County in 2024 (0 in 5+ unit buildings).
Forward outlook
- In year one you build about $8k of equity ($1k loan paydown + $7k appreciation (3.7% local appreciation)).
- Donley County population projected at -26% by 2050 — secular population decline; favor cash flow + early exit over multi-decade hold.
- By year 5, paydown + projected appreciation supports a ~$35k cash-out refi (75% LTV) — recoverable capital for the next deal without selling this one.
Negotiation context
- It's been on market 39 days — a 3% lower offer ($179k) is reasonable based on typical stale-listing flexibility.
Risks & watch-outs
- Climate carrying-cost: severe wildfire risk; extreme-heat days projected 7→19/yr by 2055 (HVAC capex compounding) — expect insurance premiums to compound above CPI over the hold.
Questions for the listing agent
- What do current leases actually rent for vs. the listed asking? Can we see a recent rent roll and the last 12 months of T-12 income?
- It's been on market 39 days. Have you received any prior offers? Is the seller open to a 43% concession, seller financing, or rate buy-down credit?
- Built in 1973 — when were the roof, HVAC, electrical panel, plumbing, and water heater last replaced?
- Is there a deadline driving the sale (1031 exchange, divorce, estate, relocation)? That informs how much negotiation room exists.
- Schools are F-rated, which usually means shorter tenancies and higher turnover. Who's the typical renter profile here, and what's been the actual vacancy rate?
- Crime grade is F in this area — have there been break-ins, vandalism, or insurance claims at this property in the last 3 years? What carrier currently insures it and at what premium?
- The area grade is low — what's the realistic commute time and amenity access for the typical tenant pool here? Any planned neighborhood developments (good or bad) we should know about?
- What's the average days-on-market for RENTAL listings here right now (not sales)? A rising rental-DOM trend means longer vacancies and softer asking-rent achievability than the comps imply.
- What's the recent tenant-quality profile in this submarket — average credit score on applications, eviction rate, late-payment / NSF rate, and stable-employment percentage? A property-management company in the area should have these aggregated.
- How much new for-sale + rental construction is in the pipeline within 1–3 miles? Heavy new supply typically softens prices + rents 12–24 months out; constrained supply supports both.
Investment metrics
- 1% rule
- 0.57% ✗
- Cap rate
- 4.28%
- Cash-on-cash
- -7.19%
- DSCR
- 0.68
- GRM
- 14.7
CMA / ARV
- ARV (median comp)
- $515,546
- List price
- $185,000
- Delta
- -64.12%
- Verdict
- UNDERPRICED
- Comps
- 1 within 2.0 mi
Projected returns pro-forma
3.66% appreciation · 3.0% rent growth · sell at horizon
- IRR
- 2.9%
- Equity multiple
- 1.17×
- Total profit
- $8,962
- Equity at exit
- $90,117
- IRR
- 6.1%
- Equity multiple
- 2.00×
- Total profit
- $51,696
- Equity at exit
- $144,531
Cash invested: $51,800 (down + closing). Projections, not guarantees.
Landlord ↔ Tenant lean methodology
- Overall (STATE)
- 87 Strongly Landlord-Friendly
- State Texas
- 87 Strongly Landlord-Friendly · R+5
- County
- — inherits STATE
- City
- — inherits STATE
ZIP-level market 79226
- Home prices YoY
- 4.5%
- Active inventory
- 49
- Price-to-rent
- 14.7×
Monthly cashflow live
- Estimated rent
- $1,047 medium interval (Pro) →
- Mortgage (P&I)
- −$970
- Tax from tax record
- −$90 /mo · $1,080/yr
- Insurance
- −$77
- HOA
- −$0
- Vacancy / Maint / Mgmt
- −$220
- Net cashflow
- $-310
Break-even live
Sensitivity live
| Price | -10% $-206 | -5% $-258 | +0% $-310 | +5% $-363 | +10% $-415 |
|---|---|---|---|---|---|
| Rent | -10% $-393 | -5% $-352 | +0% $-310 | +5% $-269 | +10% $-228 |
| Rate | -1.0pp $-217 | -0.5pp $-263 | base $-310 | +0.5pp $-358 | +1.0pp $-407 |
UW: 25.0% down · 7.5% · 30yr · 1.5% tax · 5.0% vac · 8.0% maint · 8.0% mgmt
Financing live
Cash to close
- Down payment
- $46,250
- Closing costs
- $5,550
- Reserves months
- —
- Total cash needed
- —
Loan-product check · same deal, 3 products live
Conventional
25% down · 7.5% · 30yr
- Down + closing
- —
- Monthly P&I
- —
- Monthly cashflow
- —
- DSCR
- —
- Eligible?
- —
Personal DTI + credit; lowest rate.
DSCR
20% down · 8.5% · 30yr
- Down + closing
- —
- Monthly P&I
- —
- Monthly cashflow
- —
- DSCR
- —
- Eligible?
- —
No personal income docs; deal must DSCR.
Hard money
10% down · 12.0% · 12mo
- Down + closing
- —
- Monthly P&I
- —
- Monthly cashflow
- —
- DSCR
- —
- Eligible?
- —
Short-term bridge; refi at stabilization.
Listing history 19 events
-
2026-06-22days on market $185,000 Active 39 DOM
-
2026-06-21days on market $185,000 Active 38 DOM
-
2026-06-21days on market $185,000 Active 37 DOM
-
2026-06-18price $185,000 Active 35 DOM
-
2026-06-18days on market $199,500 Active 35 DOM
-
2026-06-17days on market $199,500 Active 34 DOM
-
2026-06-16days on market $199,500 Active 33 DOM
-
2026-06-15days on market $199,500 Active 32 DOM
-
2026-06-13days on market $199,500 Active 30 DOM
-
2026-06-12days on market $199,500 Active 29 DOM
-
2026-06-09days on market $199,500 Active 26 DOM
-
2026-06-08days on market $199,500 Active 25 DOM
-
2026-06-08days on market $199,500 Active 24 DOM
-
2026-06-07days on market $199,500 Active 23 DOM
-
2026-06-03days on market $199,500 Active 20 DOM
-
2026-06-02days on market $199,500 Active 19 DOM
-
2026-06-01days on market $199,500 Active 18 DOM
-
2026-05-31days on market $199,500 Active 17 DOM
-
2026-05-14$199,500 Active 795-char remark
ⓘ Source: listings_history table (triggers on properties + properties_extension) + one-shot
backfill from property_details.listing_events for pre-trigger history.
Tax reassessment forecast TX · Resets to sale price
- Current annual tax
- $1,080 · $90/mo
- Projected year-2 tax
- $3,386 · $282/mo
- Expected delta
- +$2,305/yr (+$192/mo · 213.3%)
ⓘ Screening estimate from a state-policy table — verify with the county assessor before closing.
Climate risk First Street
- Flood 1/10 Low 0% chance over 30 yrs
- Wildfire 10/10 Extreme
- Heat 5/10 Major 7 d/yr ≥103°F today · 19 d/yr by 30 yrs out
- Wind 2/10 Low 100% chance of damaging wind over 30 yrs
- Air quality 1/10 Low 0 unhealthy d/yr today · 0 by 30 yrs out
Nearby sold comps map
Loading sold comps map…
Walkable amenities ~0.75 mi
Loading nearby amenities…
Taxation est. · year 1
- Rental income
- $12,560
- − Mortgage interest
- −$10,363
- − Property taxes
- −$1,080
- − Insurance
- −$925
- − Repairs & maintenance
- −$1,005
- − Management
- −$1,005
- − Depreciation
- −$5,382
- Taxable loss
- −$7,200
- Est. tax savings @ 24.0%
- +$1,728
- After-tax cash flow
- $-1,997/yr
For passive investors: Depreciation is non-cash, so a rental often shows a tax loss while cash-flowing — sheltering income. Rental losses are passive: they offset passive income freely, and up to $25,000/yr can offset ordinary (W-2) income if you actively participate and your MAGI is under $100k (phasing out to $0 by $150k); unused losses carry forward. On sale, claimed depreciation is recaptured at up to 25%, and gains may owe capital-gains tax (a 1031 exchange can defer both). Figures are a year-1 estimate at your 24.0% rate — not tax advice; consult a CPA.
Schools (NCES district)
- District
- Clarendon ISD
- NCES district ID
- 4814160
- Math proficiency
- 49% ▼ -6.00%
- Reading proficiency
- 54% ▼ -1.00%
- Median HH income
- $40,724
- Composite
- 43.12/100
- National rank
- #3082
- State rank
- #175 of 826 in TX
Livability — Howardwick
- Score
- 59/100
- State rank
- #1173
- US rank
- #20518
Category grades
Schools grade is shown separately in the Schools card above.
Census & demographics
- Census place
- Howardwick, TX
- Population (ZIP)
- 2,873
Population outlook (Donley County) Hauer SSP2
- Today (2025)
- 3,008 people
- By 2030
- 2,777 · -7.7%
- By 2040
- 2,419 · -19.6%
- By 2050
- 2,224 · -26.1%
- By 2075
- 2,018 · -32.9%
- By 2100
- 1,949 · -35.2%
Race, ethnicity, and origin ACS 2023
- Neighborhood character
- Predominantly White (78%)
- Race & ethnicity
- White 78% Hispanic / Latino 11% Black 6% Asian 3% Two or more races 3%
- Hispanic origin (detail)
- Mexican 10%
- Common ancestry
- Iranian 6% Scotch-Irish 3% Slovak 2%
- Foreign-born
- 6% · Canada, China
- Languages at home
- 91% English-only · Spanish 4% German/W. Germanic 2% Other Asian/Pacific 1%
Political lean MEDSL · Donley
- 2024 margin
- Solid R (+78.2) · D 10.2% · R 88.3% · Other 1.5%
- 2008→2024 swing
- -14.1pp toward R · 2008: -64.1pp · 2024: -78.2pp
- All cycles
- 2024: R+78.2 2020: R+75.2 2016: R+70.9 2012: R+69.2 2008: R+64.1
Not yet ingested
- Civics
- —
Market trends
- HPI YoY
- ▲ 3.66%
- Current HPI
- 85.0932
- Rent YoY
- —
- Metro
- —
- State GDP YoY
- ▲ 3.95%
- F500 in state
- 110
Industry mix (Fortune 500 HQ in TX)
| Industry | F500 HQs | Revenue |
|---|---|---|
| Energy | 16 | $1,198B |
|
||
| Technology | 5 | $198B |
|
||
| Engineering / Construction | 4 | $72B |
|
||
| Energy Services | 3 | $60B |
|
||
| Utilities | 3 | $41B |
|
||
| Healthcare | 2 | $330B |
|
||
Price history
1 event — show timeline
- 2026-05-14 Listed $199,500 AARMLS
Property tax history
+2.9%/yrLatest (2025): $1,080 · +5.4% YoY. Source: county tax records.
Cash-flow waterfall
monthlySold comps — $/sqft
last 12 mo · ≤1 miLoading sold comps…