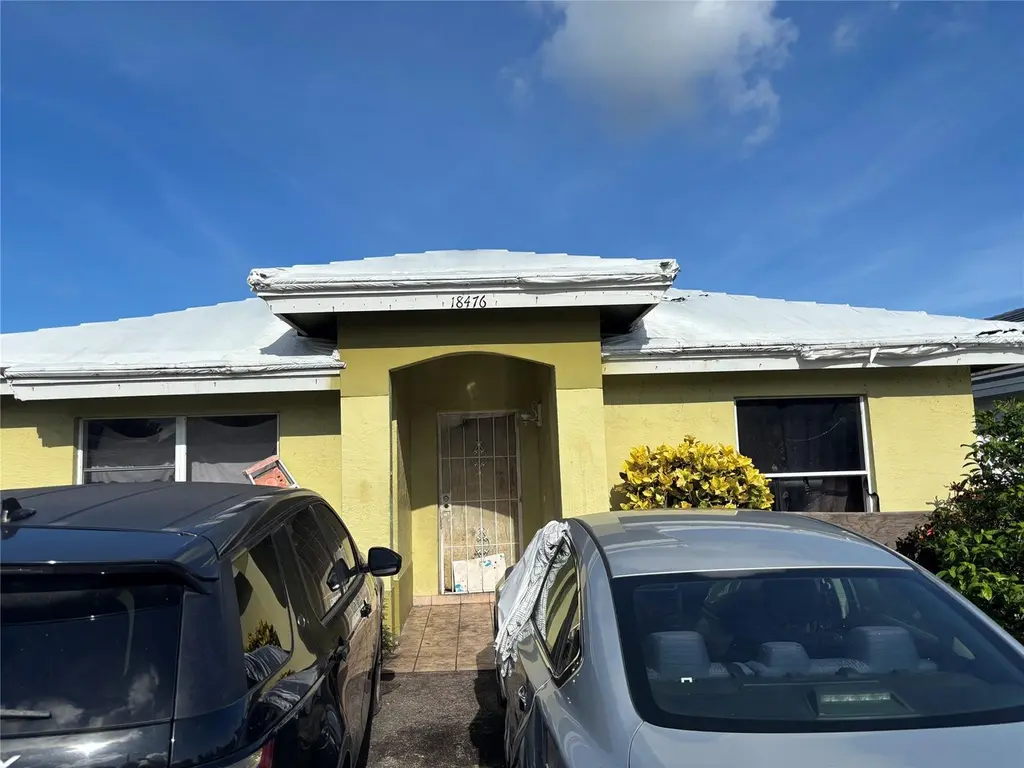
18476 NW 52nd Path · Country Club, FL
Flood risk 5/10 · Moderate
- FEMA flood zone
- AE
- Chance of flooding over 30 yrs
- 0.67%
- Est. flood insurance / yr
- $1,737 – $8,500
Fire risk 1/10 · Minimal
- Est. fire insurance / yr
- $947 – $1,759
Heat risk 10/10 · Severe
- Hot days now (above 106°F)
- 6 days/yr
- Hot days in 30 yrs
- 23 days/yr
Wind risk 10/10 · Severe
- Chance of severe wind over 30 yrs
- 99.0%
Air-quality risk 2/10 · Minimal
- Unhealthy air days now
- 1 days/yr
- Unhealthy air days in 30 yrs
- 2 days/yr
Risk factors via First Street. Map © Google.
Why this score? — see what drove the C grade
The composite is a weighted blend of 9 inputs, each scored 0–100. Each bar is that input's sub-score; the figure is the points it added to the 100-point composite (weight × sub-score).
- Cash flow +20.0/30.0
- ARV discount +15.0/15.0
- DSCR +6.3/10.0
- 1% rule +4.9/10.0
- Schools +4.2/10.0
- Livability +3.8/5.0
- Condition / age +2.5/5.0
- Rent growth +1.2/5.0
- Appreciation +0.0/10.0
$311,600
🖨 Deal sheet 📄 Offer letter ✓ Due diligence
Listing remarks
Investor special APPROVED short sale at asking price plus about $13k owed (about $10k to city and about $3k association) Cash only no assignment no wholesale as is. . Must close with consumers first. Price and terms are firm. Buyers please use due diligence
Key facts
- 3,142 sq ft lot
- Built 1994
- Listed 49 days
Property features AI
Finance
- HOA & community: Association with monthly HOA fee of $110; Association amenities: Other
Exterior
- Parking: Driveway
- Utilities: Public water; Public sewer
- Home design: Single family residence; One story; Northwest facing
- Construction: CBS construction; Built as a single-story; Building area approximately 1,326
- Exterior features: Not waterfront; Roof: Other
Interior
- Bedrooms: 3 bedrooms on the main level
- Flooring: Tile
- Bathrooms: 2 full bathrooms (both on the main level)
- Heating & cooling: Central heating; Central air conditioning; Ceiling fan(s)
- Interior features: Tile flooring
Neighborhood map
What this means for you Summary
Snapshot
- This is a 3-bed/2.0-bath single-family listed at $312k.
Deal economics
- At list price, monthly cash flow is $-43 ($-518/yr) — negative.
- To cash-flow at today's rent, offer at most $304k (2.4% below list).
- To meet the 1% rule (rent ≥ 1% of price), the offer needs to be $308k (1.0% below list).
- Recommended offer: $302k (3.0% below list) — sets the bar for market timing.
- Cap rate 7.8% vs local median 3.1% in Country Club — top-decile yield for the area; either an underpriced asset or a hidden risk that comps aren't pricing in. Stress-test before assuming the spread holds.
Location & tenants
- Location reads 76/100 on livability (#226 in FL, #3,578 nationally) — a middle-class / working-renter tenant base. Strengths: housing A+, commute B+, health & safety B+; Watch: employment C-, amenities F.
- Miami-Dade (suburban): math 45% / reading 54% proficiency, ranked #40 of 73 in FL (top 55%) — families likely to look elsewhere, expect single-tenant / working-renter base with shorter leases; 64% free/reduced lunch — lower-income household profile, screen leases tightly.
- Zoned schools: Lake Stevens Elementary School (math 37% / reading 32%, grade F, #1,709 of 2,144 statewide, top 81%, 251 students, 73% FRL); Lake Stevens Middle School (math 26% / reading 27%, grade F, #503 of 571 statewide, top 88%, 427 students, 75% FRL); Miami Carol City Senior High (math 8% / reading 16%, grade F, #622 of 667 statewide, top 93%, 804 students, 80% FRL).
- Zoned-school proficiency averages 24% at this address vs 50% district-wide (-25 pts) — the specific schools serving this property underperform the Miami-Dade average; the district grade overstates school quality for this exact location.
- Market conditions: Rents falling (-5.0%/yr); 103 active listings in the ZIP; 10,051 units permitted in Miami-Dade County in 2024 (7,758 in 5+ unit buildings).
- At $3,084/mo this rent would consume 59% of the median local household income ($62k/yr) (locally 1006% of renters already pay >50% of income on rent) — very limited rent-growth headroom before tenants either downsize or default.
Forward outlook
- Local home prices are declining (-3.0%/yr); year-one equity from $2k of loan paydown is wiped out by about $9k of value loss. Plan a longer hold.
- Miami-Dade County population projected at +28% by 2050 — long-run rental-demand tailwind backs the buy-and-hold thesis.
Negotiation context
- It's been on market 49 days — a 3% lower offer ($302k) is reasonable based on typical stale-listing flexibility.
- Current owner paid $86k; list at $312k implies a 260% gain — meaningful room to come down on a strong offer.
Risks & watch-outs
- Watch-outs: flood insurance adds $427/mo.
- Climate carrying-cost: in FEMA flood zone AE (mandatory federal flood insurance); severe wind risk, 99% chance of damaging wind over 30y; extreme-heat days projected 6→23/yr by 2055 (HVAC capex compounding) — expect insurance premiums to compound above CPI over the hold.
Questions for the listing agent
- What do current leases actually rent for vs. the listed asking? Can we see a recent rent roll and the last 12 months of T-12 income?
- It's been on market 49 days. Have you received any prior offers? Is the seller open to a 3% concession, seller financing, or rate buy-down credit?
- What's the actual annual flood-insurance premium (NFIP or private), and is the property in a SFHA with mandatory coverage?
- What does the HOA fee cover, when was the last increase, and are there any pending special assessments or reserve-fund shortfalls?
- Is there a deadline driving the sale (1031 exchange, divorce, estate, relocation)? That informs how much negotiation room exists.
- Schools are A-rated — typically a magnet for longer-tenancy family renters. What's the average tenant stay here, and is there a school-zone premium baked into asking?
- What's the average days-on-market for RENTAL listings here right now (not sales)? A rising rental-DOM trend means longer vacancies and softer asking-rent achievability than the comps imply.
- What's the recent tenant-quality profile in this submarket — average credit score on applications, eviction rate, late-payment / NSF rate, and stable-employment percentage? A property-management company in the area should have these aggregated.
- How much new for-sale + rental construction is in the pipeline within 1–3 miles? Heavy new supply typically softens prices + rents 12–24 months out; constrained supply supports both.
Investment metrics
- 1% rule
- 0.99% ✗
- Cap rate
- 7.77%
- Cash-on-cash
- 5.27%
- DSCR
- 1.23
- GRM
- 8.4
CMA / ARV
- ARV (on-the-fly)
- $503,937
- Comps found
- 5
Show comp detail 5 sales within ~0.75 mi
| Address | Dist | Beds/Ba | Sqft | Sold | Price | $/sf | Match |
|---|---|---|---|---|---|---|---|
| 5020 NW 182nd St | 0.31mi | 3/2.0 | 1,092 (-14%) | 2mo | $412,000 | $377 | 61 |
| 5114 NW 194th Ln | 0.58mi | 3/2.0 | 1,335 (+6%) | 9mo | $415,000 | $311 | 56 |
| 5001 NW 178th Ter | 0.51mi | 3/2.0 | 1,378 (+9%) | 12mo | $637,500 | $463 | 51 |
| 17915 NW 48th Ct | 0.64mi | 3/1.0 | 1,242 (-2%) | 16mo | $570,000 | $459 | 50 |
| 17535 NW 49th Ct | 0.70mi | 4/2.0 (+1) | 1,452 (+15%) | 2mo | $579,000 | $399 | 36 |
Match score weights: distance 35% · size 25% · config 20% · recency 20%. Top-matched comps best support the ARV.
Projected returns pro-forma
-3.0% appreciation · 0.0% rent growth · sell at horizon
- IRR
- -21.2%
- Equity multiple
- 0.29×
- Total profit
- $-62,033
- Equity at exit
- $46,461
- IRR
- -25.7%
- Equity multiple
- -0.05×
- Total profit
- $-91,482
- Equity at exit
- $26,941
Cash invested: $87,248 (down + closing). Projections, not guarantees.
Landlord ↔ Tenant lean methodology
- Overall (STATE)
- 87 Strongly Landlord-Friendly
- State Florida
- 87 Strongly Landlord-Friendly · R+3
- County
- — inherits STATE
- City
- — inherits STATE
ZIP-level market 33055
- Rents YoY
- -5.0%
- Active inventory
- 103
- Price-to-rent
- 8.4×
Monthly cashflow live
- Estimated rent
- $3,084 medium interval (Pro) →
- Mortgage (P&I)
- −$1,634
- Tax from tax record
- −$179 /mo · $2,149/yr
- Insurance
- −$130
- Flood insurance flood zone
- −$427 /mo · $5,118/yr
- HOA
- −$110
- Vacancy / Maint / Mgmt
- −$648
- Net cashflow
- $-43
Break-even live
UW: 25.0% down · 7.5% · 30yr · 1.5% tax · 5.0% vac · 8.0% maint · 8.0% mgmt
Financing live
Cash to close
- Down payment
- $77,900
- Closing costs
- $9,348
- Reserves months
- —
- Total cash needed
- —
Loan-product check · same deal, 3 products live
Conventional
25% down · 7.5% · 30yr
- Down + closing
- —
- Monthly P&I
- —
- Monthly cashflow
- —
- DSCR
- —
- Eligible?
- —
Personal DTI + credit; lowest rate.
DSCR
20% down · 8.5% · 30yr
- Down + closing
- —
- Monthly P&I
- —
- Monthly cashflow
- —
- DSCR
- —
- Eligible?
- —
No personal income docs; deal must DSCR.
Hard money
10% down · 12.0% · 12mo
- Down + closing
- —
- Monthly P&I
- —
- Monthly cashflow
- —
- DSCR
- —
- Eligible?
- —
Short-term bridge; refi at stabilization.
HOA detail
- Monthly dues
- $110 · $1,320/yr
Listing history 3 events
-
2026-04-29status Pending
-
2025-07-15$311,600 Active
-
1994-12-22soldstatus $86,500
ⓘ Source: listings_history table (triggers on properties + properties_extension) + one-shot
backfill from property_details.listing_events for pre-trigger history.
Tax reassessment forecast FL · Resets to sale price
- Current annual tax
- $2,149 · $179/mo
- Projected year-2 tax
- $2,586 · $216/mo
- Expected delta
- +$438/yr (+$36/mo · 20.4%)
ⓘ Screening estimate from a state-policy table — verify with the county assessor before closing.
Climate risk First Street
- Flood 5/10 Major FEMA zone AE · 67% chance over 30 yrs
- Wildfire 1/10 Low
- Heat 10/10 Extreme 6 d/yr ≥106°F today · 23 d/yr by 30 yrs out
- Wind 10/10 Extreme 99% chance of damaging wind over 30 yrs
- Air quality 2/10 Low 1 unhealthy d/yr today · 2 by 30 yrs out
Nearby sold comps map
Loading sold comps map…
Walkable amenities ~0.75 mi
Loading nearby amenities…
Taxation est. · year 1
- Rental income
- $37,007
- − Mortgage interest
- −$17,454
- − Property taxes
- −$2,149
- − Insurance
- −$6,676
- − Repairs & maintenance
- −$2,961
- − Management
- −$2,961
- − HOA
- −$1,320
- − Depreciation
- −$9,065
- Taxable loss
- −$5,578
- Est. tax savings @ 24.0%
- +$1,339
- After-tax cash flow
- $821/yr
For passive investors: Depreciation is non-cash, so a rental often shows a tax loss while cash-flowing — sheltering income. Rental losses are passive: they offset passive income freely, and up to $25,000/yr can offset ordinary (W-2) income if you actively participate and your MAGI is under $100k (phasing out to $0 by $150k); unused losses carry forward. On sale, claimed depreciation is recaptured at up to 25%, and gains may owe capital-gains tax (a 1031 exchange can defer both). Figures are a year-1 estimate at your 24.0% rate — not tax advice; consult a CPA.
Schools (NCES district)
- District
- Miami-Dade
- NCES district ID
- 1200390
- Math proficiency
- 45% ▼ -16.00%
- Reading proficiency
- 54% ▼ -5.00%
- Median HH income
- $43,928
- Composite
- 41.76/100
- National rank
- #3397
- State rank
- #40 of 73 in FL
Livability — Country Club
- Score
- 76/100
- State rank
- #226
- US rank
- #3578
Category grades
Schools grade is shown separately in the Schools card above.
Census & demographics
- County
- Miami-Dade County · 2,697,751 people
- City population
- 68,430
- Metro
- Miami-Fort Lauderdale-Pompano Beach, FL
- Population (ZIP)
- 37,659
- Household income
- $62,286
- Rent vs Own
- Severe rent burden
- 1006.0
Population outlook (Miami-Dade County) Hauer SSP2
- Today (2025)
- 3,126,439 people
- By 2030
- 3,325,765 · +6.4%
- By 2040
- 3,697,561 · +18.3%
- By 2050
- 4,012,134 · +28.3%
- By 2075
- 4,605,612 · +47.3%
- By 2100
- 4,866,598 · +55.7%
Race, ethnicity, and origin ACS 2023
- Neighborhood character
- Predominantly Hispanic (72%)
- Race & ethnicity
- Hispanic / Latino 72% Two or more races 38% Black 23% White 2% Asian 1%
- Hispanic origin (detail)
- Mexican 1% Puerto Rican 2% Cuban 44% Dominican 4%
- Common ancestry
- Hispanic 0%
- Foreign-born
- 56% · Canada, Jamaica, China
- Languages at home
- 30% English-only · Spanish 68% Chinese 1% French/Haitian/Cajun 1%
Political lean MEDSL · Miami-Dade
- 2024 margin
- R (+11.4) · D 43.9% · R 55.4%
- 2008→2024 swing
- -27.6pp toward R · 2008: 16.1pp · 2024: -11.4pp
- All cycles
- 2024: R+11.4 2020: D+7.3 2016: D+29.6 2012: D+23.7 2008: D+16.1
Not yet ingested
- Civics
- —
Market trends
- HPI YoY
- ▼ -327.03%
- Current HPI
- 527.6639
- Rent YoY
- ▼ -5.00%
- Metro
- Miami-Fort Lauderdale-Pompano Beach, FL
- State GDP YoY
- ▲ 3.28%
- F500 in state
- 36
Industry mix (Fortune 500 HQ in FL)
| Industry | F500 HQs | Revenue |
|---|---|---|
| Industrial Technology | 2 | $29B |
|
||
| Insurance | 2 | $17B |
|
||
| Retail | 1 | $60B |
|
||
| Technology Distribution | 1 | $58B |
|
||
| Homebuilding | 1 | $35B |
|
||
| Technology Manufacturing | 1 | $35B |
|
||
Price history
+260.2% since first listed3 events — show timeline
- 2026-04-29 Pending — Beaches MLS
- 2025-07-15 Listed $311,600 Beaches MLS
- 1994-12-22 Sold (Public Records) $86,500 Public Records
Property tax history
+5.0%/yrLatest (2025): $2,149 · +2.7% YoY. Source: county tax records.
Cash-flow waterfall
monthlySold comps — $/sqft
last 12 mo · ≤1 miLoading sold comps…