21 Arvin Ln · Smithfield, KY
Flood risk 1/10 · Minimal
- FEMA flood zone
- X (unshaded)
- Chance of flooding over 30 yrs
- 0.0%
- Est. flood insurance / yr
- $473 – $860
Fire risk 3/10 · Minor
- Est. fire insurance / yr
- $839 – $1,559
Heat risk 4/10 · Minor
- Hot days now (above 104°F)
- 7 days/yr
- Hot days in 30 yrs
- 20 days/yr
Wind risk 2/10 · Minimal
- Chance of severe wind over 30 yrs
- 3.0%
Air-quality risk 2/10 · Minimal
- Unhealthy air days now
- 1 days/yr
- Unhealthy air days in 30 yrs
- 2 days/yr
Risk factors via First Street. Map © Google.
Why this score? — see what drove the D grade
The composite is a weighted blend of 9 inputs, each scored 0–100. Each bar is that input's sub-score; the figure is the points it added to the 100-point composite (weight × sub-score).
- ARV discount +15.0/15.0
- Appreciation +9.8/10.0
- Cash flow +5.0/30.0
- Schools +2.8/10.0
- Livability +2.8/5.0
- Rent growth +2.5/5.0
- Condition / age +2.5/5.0
- 1% rule +0.0/10.0
- DSCR +0.0/10.0
$285,000
🖨 Deal sheet (PDF) 📄 Offer letter ✓ Due diligence
Listing remarks MLS
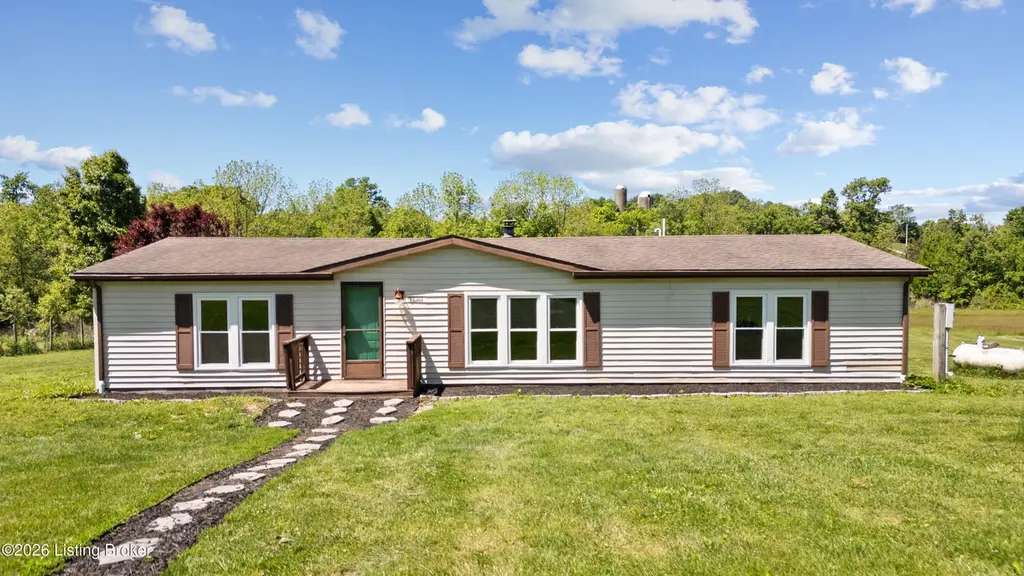
Situated on 5 stunning acres outside of Smithfield, your private retreat is here! You'll love this adorable and updated home for the space it offers - large living area and fantastic spacious kitchen! We know what you'll love the most here is the land and the 3 out buildings here. Tranquil and peaceful this property is unbelievable! Hurry and come see us!
Key facts
- Large living area
- Peaceful scenery
- Updated home
Tags
Property features AI
Finance
- Other: Directions: Take I-71 N to Ernie Harris Pkwy in La Grange. Follow Ernie Harris Pkwy, KY-53 S and KY-22 E to your destination in Shelby County
- HOA & community: Subdivision: 1400 Willow; No association fee
Exterior
- Parking: Driveway
- Utilities: Electricity connected; Propane
- Home design: Residential property; Other architectural style; One-story home; Built in 1991
- Construction: Vinyl siding exterior; Shingle roof; Concrete block foundation
- Exterior features: Lot is cleared and level; Approximately 5.2 acres
Interior
- Kitchen: Kitchen on the first floor
- Bedrooms: Three bedrooms total, all on the first floor; Primary bedroom on the first floor
- Bathrooms: Two full bathrooms, including a primary full bathroom on the first floor
- Heating & cooling: Forced air heating; Central air conditioning
- Interior features: Nine total rooms; No basement; Four closets; Living room on the first floor; Dining area on the first floor
- Laundry & utility: First-floor laundry
Neighborhood map
What this means for you Summary
Snapshot
- This is a 3-bed/2.0-bath single-family listed at $285k.
Deal economics
- At list price, monthly cash flow is $-675 ($-8k/yr) — negative.
- To cash-flow at today's rent, offer at most $166k (41.8% below list).
- To meet the 1% rule (rent ≥ 1% of price), the offer needs to be $132k (53.6% below list).
- Recommended offer: $132k (53.6% below list) — sets the bar for 1% rule.
Location & tenants
- Location reads 55/100 on livability (#462 in KY) — a working-class tenant base; expect higher turnover. Strengths: cost of living A+, housing B+; Watch: employment D+, schools F, amenities F.
- Shelby County (town): math 26% / reading 37% proficiency, ranked #77 of 165 in KY (top 47%) — families likely to look elsewhere, expect single-tenant / working-renter base with shorter leases.
- Market conditions: 31 active listings in the ZIP; 237 units permitted in Shelby County in 2024 (0 in 5+ unit buildings).
Forward outlook
- In year one you build about $29k of equity ($2k loan paydown + $27k appreciation (9.6% local appreciation)).
- Shelby County population projected at +34% by 2050 — long-run rental-demand tailwind backs the buy-and-hold thesis.
- By year 2, paydown + projected appreciation supports a ~$47k cash-out refi (75% LTV) — recoverable capital for the next deal without selling this one.
Negotiation context
- It's been on market 34 days — a 3% lower offer ($276k) is reasonable based on typical stale-listing flexibility.
- 3 sale attempts since 18y ago with the ask held roughly flat each time — persistent listings suggest the price (not the market) is what's stuck; bring a comps-based counter.
- Current owner paid $110k; list at $285k implies a 159% gain — meaningful room to come down on a strong offer.
Questions for the listing agent
- What do current leases actually rent for vs. the listed asking? Can we see a recent rent roll and the last 12 months of T-12 income?
- It's been on market 34 days. Have you received any prior offers? Is the seller open to a 54% concession, seller financing, or rate buy-down credit?
- Is there a deadline driving the sale (1031 exchange, divorce, estate, relocation)? That informs how much negotiation room exists.
- Schools are F-rated, which usually means shorter tenancies and higher turnover. Who's the typical renter profile here, and what's been the actual vacancy rate?
- The area grade is low — what's the realistic commute time and amenity access for the typical tenant pool here? Any planned neighborhood developments (good or bad) we should know about?
- What's the average days-on-market for RENTAL listings here right now (not sales)? A rising rental-DOM trend means longer vacancies and softer asking-rent achievability than the comps imply.
- What's the recent tenant-quality profile in this submarket — average credit score on applications, eviction rate, late-payment / NSF rate, and stable-employment percentage? A property-management company in the area should have these aggregated.
- How much new for-sale + rental construction is in the pipeline within 1–3 miles? Heavy new supply typically softens prices + rents 12–24 months out; constrained supply supports both.
Investment metrics
- 1% rule
- 0.46% ✗
- Cap rate
- 3.45%
- Cash-on-cash
- -10.15%
- DSCR
- 0.55
- GRM
- 17.9
CMA / ARV
- ARV (median comp)
- $341,572
- List price
- $285,000
- Delta
- -16.56%
- Verdict
- UNDERPRICED
- Comps
- 4 within 2.0 mi
Projected returns pro-forma
9.62% appreciation · 3.0% rent growth · sell at horizon
- IRR
- 16.3%
- Equity multiple
- 2.31×
- Total profit
- $104,755
- Equity at exit
- $248,931
- IRR
- 15.6%
- Equity multiple
- 5.26×
- Total profit
- $340,192
- Equity at exit
- $528,718
Cash invested: $79,800 (down + closing). Projections, not guarantees.
Landlord ↔ Tenant lean methodology
- Overall (STATE)
- 83 Strongly Landlord-Friendly
- State Kentucky
- 83 Strongly Landlord-Friendly · R+16
- County
- — inherits STATE
- City
- — inherits STATE
ZIP-level market 40068
- Home prices YoY
- 3.4%
- Active inventory
- 31
- Price-to-rent
- 17.9×
Monthly cashflow live
- Estimated rent
- $1,323 medium interval (Pro) →
- Mortgage (P&I)
- −$1,495
- Tax from tax record
- −$107 /mo · $1,284/yr
- Insurance
- −$119
- HOA
- −$0
- Vacancy / Maint / Mgmt
- −$278
- Net cashflow
- $-675
Break-even live
Sensitivity live
| Price | -10% $-513 | -5% $-594 | +0% $-675 | +5% $-755 | +10% $-836 |
|---|---|---|---|---|---|
| Rent | -10% $-779 | -5% $-727 | +0% $-675 | +5% $-623 | +10% $-570 |
| Rate | -1.0pp $-531 | -0.5pp $-602 | base $-675 | +0.5pp $-749 | +1.0pp $-824 |
UW: 25.0% down · 7.5% · 30yr · 1.5% tax · 5.0% vac · 8.0% maint · 8.0% mgmt
Financing live
Cash to close
- Down payment
- $71,250
- Closing costs
- $8,550
- Reserves months
- —
- Total cash needed
- —
Loan-product check · same deal, 3 products live
Conventional
25% down · 7.5% · 30yr
- Down + closing
- —
- Monthly P&I
- —
- Monthly cashflow
- —
- DSCR
- —
- Eligible?
- —
Personal DTI + credit; lowest rate.
DSCR
20% down · 8.5% · 30yr
- Down + closing
- —
- Monthly P&I
- —
- Monthly cashflow
- —
- DSCR
- —
- Eligible?
- —
No personal income docs; deal must DSCR.
Hard money
10% down · 12.0% · 12mo
- Down + closing
- —
- Monthly P&I
- —
- Monthly cashflow
- —
- DSCR
- —
- Eligible?
- —
Short-term bridge; refi at stabilization.
Listing history 22 events
-
2026-06-18days on market $285,000 Active 34 DOM
-
2026-06-17days on market $285,000 Active 33 DOM
-
2026-06-16days on market $285,000 Active 32 DOM
-
2026-06-15days on market $285,000 Active 31 DOM
-
2026-06-13days on market $285,000 Active 29 DOM
-
2026-06-13days on market $285,000 Active 28 DOM
-
2026-06-10days on market $285,000 Active 26 DOM
-
2026-06-09days on market $285,000 Active 25 DOM
-
2026-06-08days on market $285,000 Active 24 DOM
-
2026-06-07days on market $285,000 Active 23 DOM
-
2026-06-05days on market $285,000 Active 20 DOM
-
2026-06-03days on market $285,000 Active 19 DOM
-
2026-06-02days on market $285,000 Active 18 DOM
-
2026-06-01days on market $285,000 Active 17 DOM
-
2026-05-31days on market $285,000 Active 16 DOM
-
2026-05-15$285,000 Active 535-char remark
-
2016-12-27soldstatus $110,000
-
2016-12-13soldstatus $110,000 Closed 357-char remark
Show marketing remark (357 chars)
Situated on 5 stunning acres outside of Smithfield, your private retreat is here! You'll love this adorable and updated home for the space it offers - large living area and fantastic spacious kitchen! We know what you'll love the most here is the land and the 3 out buildings here. Tranquil and peaceful this property is unbelievable! Hurry and come see us!
-
2016-09-19status Pending 357-char remark
Show marketing remark (357 chars)
Situated on 5 stunning acres outside of Smithfield, your private retreat is here! You'll love this adorable and updated home for the space it offers - large living area and fantastic spacious kitchen! We know what you'll love the most here is the land and the 3 out buildings here. Tranquil and peaceful this property is unbelievable! Hurry and come see us!
-
2016-09-15$107,000 Active 357-char remark
Show marketing remark (357 chars)
Situated on 5 stunning acres outside of Smithfield, your private retreat is here! You'll love this adorable and updated home for the space it offers - large living area and fantastic spacious kitchen! We know what you'll love the most here is the land and the 3 out buildings here. Tranquil and peaceful this property is unbelievable! Hurry and come see us!
-
2008-09-17soldstatus $92,000
Show marketing remark (454 chars)
Manufactured home situated on 5.16 acres with 2 out buildings. 3BR/2BA with 1539 square feet of living space. Home needs updating and TLC. Information deemed reliable but not guaranteed! Buyer to verify all information to their satisfaction including but not limited to all mechanicals and utilities. Good faith deposit, proof of funds or pre-approval letter required with all offers. Please allow 3 business days for response to all offers. Sold ?As Is?
-
2008-06-25$97,900
Show marketing remark (454 chars)
Manufactured home situated on 5.16 acres with 2 out buildings. 3BR/2BA with 1539 square feet of living space. Home needs updating and TLC. Information deemed reliable but not guaranteed! Buyer to verify all information to their satisfaction including but not limited to all mechanicals and utilities. Good faith deposit, proof of funds or pre-approval letter required with all offers. Please allow 3 business days for response to all offers. Sold ?As Is?
ⓘ Source: listings_history table (triggers on properties + properties_extension) + one-shot
backfill from property_details.listing_events for pre-trigger history.
Tax reassessment forecast KY · Resets to sale price
- Current annual tax
- $1,284 · $107/mo
- Projected year-2 tax
- $2,451 · $204/mo
- Expected delta
- +$1,167/yr (+$97/mo · 90.9%)
ⓘ Screening estimate from a state-policy table — verify with the county assessor before closing.
Climate risk First Street
- Flood 1/10 Low FEMA zone X (unshaded) · 0% chance over 30 yrs
- Wildfire 3/10 Moderate
- Heat 4/10 Moderate 7 d/yr ≥104°F today · 20 d/yr by 30 yrs out
- Wind 2/10 Low 3% chance of damaging wind over 30 yrs
- Air quality 2/10 Low 1 unhealthy d/yr today · 2 by 30 yrs out
Nearby sold comps map
Loading sold comps map…
Walkable amenities ~0.75 mi
Loading nearby amenities…
Taxation est. · year 1
- Rental income
- $15,881
- − Mortgage interest
- −$15,964
- − Property taxes
- −$1,284
- − Insurance
- −$1,425
- − Repairs & maintenance
- −$1,270
- − Management
- −$1,270
- − Depreciation
- −$8,291
- Taxable loss
- −$13,624
- Est. tax savings @ 24.0%
- +$3,270
- After-tax cash flow
- $-4,828/yr
For passive investors: Depreciation is non-cash, so a rental often shows a tax loss while cash-flowing — sheltering income. Rental losses are passive: they offset passive income freely, and up to $25,000/yr can offset ordinary (W-2) income if you actively participate and your MAGI is under $100k (phasing out to $0 by $150k); unused losses carry forward. On sale, claimed depreciation is recaptured at up to 25%, and gains may owe capital-gains tax (a 1031 exchange can defer both). Figures are a year-1 estimate at your 24.0% rate — not tax advice; consult a CPA.
Schools (NCES district)
- District
- Shelby County
- NCES district ID
- 2105320
- Math proficiency
- 26% ▼ -10.00%
- Reading proficiency
- 37% ▼ -11.00%
- Median HH income
- $58,163
- Composite
- 28.19/100
- National rank
- #6809
- State rank
- #77 of 165 in KY
Livability — Smithfield
- Score
- 55/100
- State rank
- #462
- US rank
- #23123
Category grades
Schools grade is shown separately in the Schools card above.
Census & demographics
- Population (ZIP)
- 2,663
Population outlook (Shelby County) Hauer SSP2
- Today (2025)
- 52,947 people
- By 2030
- 56,624 · +6.9%
- By 2040
- 63,983 · +20.8%
- By 2050
- 70,917 · +33.9%
- By 2075
- 87,345 · +65.0%
- By 2100
- 97,345 · +83.9%
Race, ethnicity, and origin ACS 2023
- Neighborhood character
- Predominantly White (88%)
- Race & ethnicity
- White 88% Hispanic / Latino 6% Two or more races 4% Black 2%
- Hispanic origin (detail)
- Mexican 6%
- Common ancestry
- Portuguese 5% Slovak 2% Italian 2%
- Foreign-born
- 2% · Canada
- Languages at home
- 96% English-only · Spanish 4%
Political lean MEDSL · Shelby
- 2024 margin
- Solid R (+34.7) · D 31.8% · R 66.5% · Other 1.7%
- 2008→2024 swing
- -10.0pp toward R · 2008: -24.7pp · 2024: -34.7pp
- All cycles
- 2024: R+34.7 2020: R+29.6 2016: R+33.6 2012: R+27.6 2008: R+24.7
Not yet ingested
- Civics
- —
Market trends
- HPI YoY
- ▲ 9.62%
- Current HPI
- 290.227
- Rent YoY
- —
- Metro
- —
- State GDP YoY
- ▲ 1.81%
- F500 in state
- 4
Industry mix (Fortune 500 HQ in KY)
| Industry | F500 HQs | Revenue |
|---|---|---|
| Healthcare | 1 | $118B |
|
||
| Food / Beverage | 1 | $7B |
|
||
Price history
+191.1% since first listed7 events — show timeline
- 2026-05-15 Listed $285,000 Metro Search MLS
- 2016-12-27 Sold (Public Records) $110,000 Public Records
- 2016-12-13 Sold (MLS) $110,000 Metro Search MLS
- 2016-09-19 Pending — Metro Search MLS
- 2016-09-15 Listed $107,000 Metro Search MLS
- 2008-09-17 Sold (MLS) $92,000 Metro Search MLS
- 2008-06-25 Listed $97,900 Metro Search MLS
Property tax history
+1.4%/yrLatest (2025): $1,284 · -0.9% YoY. Source: county tax records.
Cash-flow waterfall
monthlySold comps — $/sqft
last 12 mo · ≤1 miLoading sold comps…