15972 Highway 21 E · Grapeland, TX
Flood risk 1/10 · Minimal
- FEMA flood zone
- X (unshaded)
- Chance of flooding over 30 yrs
- 0.0%
- Est. flood insurance / yr
- $507 – $1,088
Fire risk 3/10 · Minor
- Est. fire insurance / yr
- $1,222 – $2,270
Heat risk 7/10 · Major
- Hot days now (above 110°F)
- 7 days/yr
- Hot days in 30 yrs
- 26 days/yr
Wind risk 8/10 · Major
- Chance of severe wind over 30 yrs
- 80.0%
Air-quality risk 1/10 · Minimal
- Unhealthy air days now
- 0 days/yr
- Unhealthy air days in 30 yrs
- 0 days/yr
Risk factors via First Street. Map © Google.
Why this score? — see what drove the C- grade
The composite is a weighted blend of 9 inputs, each scored 0–100. Each bar is that input's sub-score; the figure is the points it added to the 100-point composite (weight × sub-score).
- Cash flow +17.1/30.0
- ARV discount +7.5/15.0
- Appreciation +6.9/10.0
- DSCR +5.3/10.0
- 1% rule +4.8/10.0
- Schools +3.8/10.0
- Livability +3.5/5.0
- Rent growth +2.5/5.0
- Condition / age +2.5/5.0
$120,000
🖨 Deal sheet (PDF) 📄 Offer letter ✓ Due diligence
Listing remarks MLS
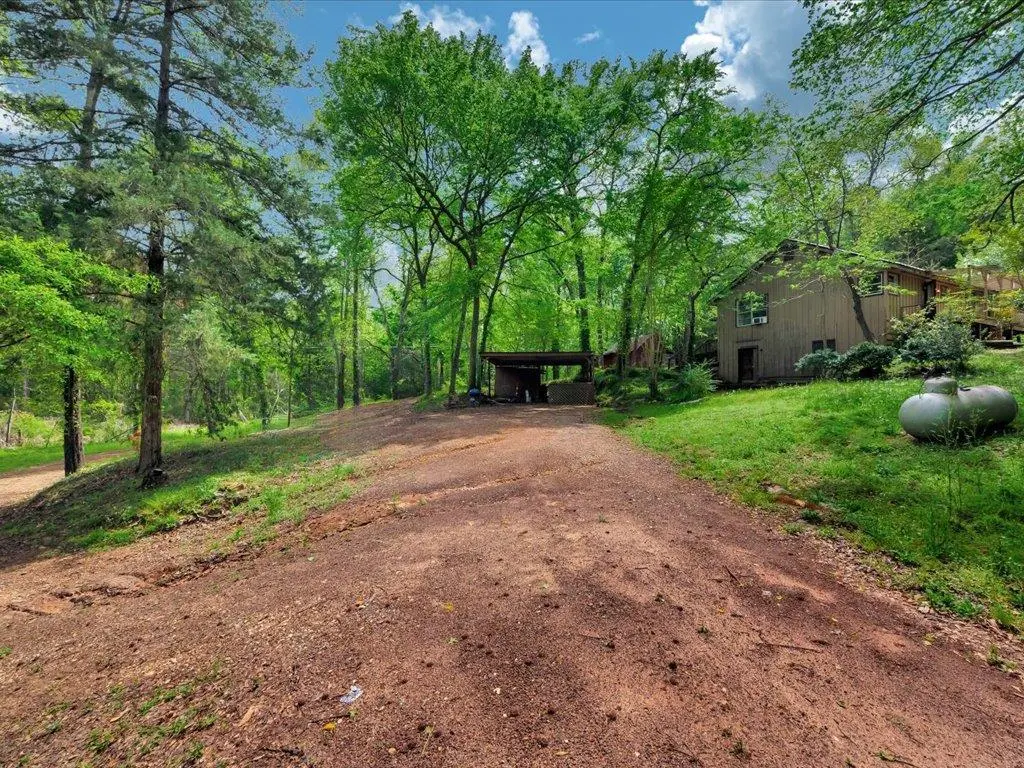
Investor opportunity in a peaceful, wooded setting just 3.8 miles from Mission Tejas State Park! This 2,016 sq ft, two-story home built in 1992 sits on 1 acre and offers strong potential for renovation, resale, or rental income. Featuring a spacious layout, large living areas, and a covered porch perfect for enjoying the natural surroundings, this property is ready for your vision. Interior needs updates, making it an ideal value-add project. Additional structures on-site provide great storage or workshop potential. Whether you're looking for your next flip, investment property, or weekend retreat, this one is full of opportunity. Being sold as-is.
Key facts
- Covered porch
- Wooded setting
- 1 acre lot
Tags
Neighborhood map
What this means for you Summary
Snapshot
- This is a 3-bed/2.0-bath single-family listed at $120k.
Deal economics
- At list price, monthly cash flow is $83 ($991/yr) — positive.
- The deal already cash-flows at list — no discount required.
- To meet the 1% rule (rent ≥ 1% of price), the offer needs to be $117k (2.3% below list).
- Recommended offer: $116k (3.0% below list) — sets the bar for market timing.
- Cap rate 7.1% vs local median 1.3% in Grapeland — top-decile yield for the area; either an underpriced asset or a hidden risk that comps aren't pricing in. Stress-test before assuming the spread holds.
Location & tenants
- Location reads 69/100 on livability (#427 in TX) — a middle-class / working-renter tenant base. Strengths: crime A+, cost of living A+, housing A+; Watch: schools D, amenities F, commute F.
- Kennard ISD (rural): math 45% / reading 40% proficiency, ranked #670 of 1,141 in TX (top 59%) — families likely to look elsewhere, expect single-tenant / working-renter base with shorter leases; 63% free/reduced lunch — lower-income household profile, screen leases tightly.
- Market conditions: 134 active listings in the ZIP; 3 units permitted in Houston County in 2024 (0 in 5+ unit buildings).
Forward outlook
- In year one you build about $5k of equity ($830 loan paydown + $5k appreciation (3.8% local appreciation)).
- Houston County population projected at -16% by 2050 — secular population decline; favor cash flow + early exit over multi-decade hold.
- At projected returns (3.8% appreciation + 3.0% rent growth), your $34k cash investment doubles in ~5 years — after that, you're playing with house money.
- By year 7, paydown + projected appreciation supports a ~$34k cash-out refi (75% LTV) — recoverable capital for the next deal without selling this one.
Negotiation context
- It's been on market 59 days — a 3% lower offer ($116k) is reasonable based on typical stale-listing flexibility.
Risks & watch-outs
- Climate carrying-cost: severe wind risk, 80% chance of damaging wind over 30y; extreme-heat days projected 7→26/yr by 2055 (HVAC capex compounding) — expect insurance premiums to compound above CPI over the hold.
Questions for the listing agent
- It's been on market 59 days. Have you received any prior offers? Is the seller open to a 3% concession, seller financing, or rate buy-down credit?
- Is there a deadline driving the sale (1031 exchange, divorce, estate, relocation)? That informs how much negotiation room exists.
- Schools are D-rated, which usually means shorter tenancies and higher turnover. Who's the typical renter profile here, and what's been the actual vacancy rate?
- What's the average days-on-market for RENTAL listings here right now (not sales)? A rising rental-DOM trend means longer vacancies and softer asking-rent achievability than the comps imply.
- What's the recent tenant-quality profile in this submarket — average credit score on applications, eviction rate, late-payment / NSF rate, and stable-employment percentage? A property-management company in the area should have these aggregated.
- How much new for-sale + rental construction is in the pipeline within 1–3 miles? Heavy new supply typically softens prices + rents 12–24 months out; constrained supply supports both.
Investment metrics
- 1% rule
- 0.98% ✗
- Cap rate
- 7.12%
- Cash-on-cash
- 2.95%
- DSCR
- 1.13
- GRM
- 8.5
CMA / ARV
No comps found within radius.
Projected returns pro-forma
3.77% appreciation · 3.0% rent growth · sell at horizon
- IRR
- 12.3%
- Equity multiple
- 1.74×
- Total profit
- $24,733
- Equity at exit
- $59,267
- IRR
- 13.9%
- Equity multiple
- 3.22×
- Total profit
- $74,756
- Equity at exit
- $95,701
Cash invested: $33,600 (down + closing). Projections, not guarantees.
Landlord ↔ Tenant lean methodology
- Overall (STATE)
- 87 Strongly Landlord-Friendly
- State Texas
- 87 Strongly Landlord-Friendly · R+5
- County
- — inherits STATE
- City
- — inherits STATE
ZIP-level market 75844
- Home prices YoY
- 2.2%
- Active inventory
- 134
- Price-to-rent
- 8.5×
Monthly cashflow live
- Estimated rent
- $1,172 medium interval (Pro) →
- Mortgage (P&I)
- −$629
- Tax from tax record
- −$164 /mo · $1,972/yr
- Insurance
- −$50
- HOA
- −$0
- Vacancy / Maint / Mgmt
- −$246
- Net cashflow
- $83
Break-even live
Sensitivity live
| Price | -10% $151 | -5% $117 | +0% $83 | +5% $49 | +10% $15 |
|---|---|---|---|---|---|
| Rent | -10% $-10 | -5% $36 | +0% $83 | +5% $129 | +10% $175 |
| Rate | -1.0pp $143 | -0.5pp $113 | base $83 | +0.5pp $51 | +1.0pp $20 |
UW: 25.0% down · 7.5% · 30yr · 1.5% tax · 5.0% vac · 8.0% maint · 8.0% mgmt
Financing live
Cash to close
- Down payment
- $30,000
- Closing costs
- $3,600
- Reserves months
- —
- Total cash needed
- —
Loan-product check · same deal, 3 products live
Conventional
25% down · 7.5% · 30yr
- Down + closing
- —
- Monthly P&I
- —
- Monthly cashflow
- —
- DSCR
- —
- Eligible?
- —
Personal DTI + credit; lowest rate.
DSCR
20% down · 8.5% · 30yr
- Down + closing
- —
- Monthly P&I
- —
- Monthly cashflow
- —
- DSCR
- —
- Eligible?
- —
No personal income docs; deal must DSCR.
Hard money
10% down · 12.0% · 12mo
- Down + closing
- —
- Monthly P&I
- —
- Monthly cashflow
- —
- DSCR
- —
- Eligible?
- —
Short-term bridge; refi at stabilization.
Listing history 19 events
-
2026-06-19days on market $120,000 Active 59 DOM
-
2026-06-18days on market $120,000 Active 58 DOM
-
2026-06-17days on market $120,000 Active 57 DOM
-
2026-06-16days on market $120,000 Active 56 DOM
-
2026-06-15days on market $120,000 Active 55 DOM
-
2026-06-14days on market $120,000 Active 53 DOM
-
2026-06-13days on market $120,000 Active 52 DOM
-
2026-06-10days on market $120,000 Active 50 DOM
-
2026-06-09days on market $120,000 Active 49 DOM
-
2026-06-08days on market $120,000 Active 48 DOM
-
2026-06-07days on market $120,000 Active 47 DOM
-
2026-06-05days on market $120,000 Active 44 DOM
-
2026-06-03days on market $120,000 Active 43 DOM
-
2026-06-02days on market $120,000 Active 42 DOM
-
2026-06-01days on market $120,000 Active 41 DOM
-
2026-05-31days on market $120,000 Active 40 DOM
-
2026-05-30days on market $120,000 Active 39 DOM
-
2026-04-21$120,000 Active 656-char remark
Show marketing remark (656 chars)
Investor opportunity in a peaceful, wooded setting just 3.8 miles from Mission Tejas State Park! This 2,016 sq ft, two-story home built in 1992 sits on 1 acre and offers strong potential for renovation, resale, or rental income. Featuring a spacious layout, large living areas, and a covered porch perfect for enjoying the natural surroundings, this property is ready for your vision. Interior needs updates, making it an ideal value-add project. Additional structures on-site provide great storage or workshop potential. Whether you're looking for your next flip, investment property, or weekend retreat, this one is full of opportunity. Being sold as-is.
-
2014-10-28soldstatus
ⓘ Source: listings_history table (triggers on properties + properties_extension) + one-shot
backfill from property_details.listing_events for pre-trigger history.
Tax reassessment forecast TX · Resets to sale price
- Current annual tax
- $1,972 · $164/mo
- Projected year-2 tax
- $2,196 · $183/mo
- Expected delta
- +$224/yr (+$19/mo · 11.4%)
ⓘ Screening estimate from a state-policy table — verify with the county assessor before closing.
Climate risk First Street
- Flood 1/10 Low FEMA zone X (unshaded) · 0% chance over 30 yrs
- Wildfire 3/10 Moderate
- Heat 7/10 Severe 7 d/yr ≥110°F today · 26 d/yr by 30 yrs out
- Wind 8/10 Severe 80% chance of damaging wind over 30 yrs
- Air quality 1/10 Low 0 unhealthy d/yr today · 0 by 30 yrs out
Nearby sold comps map
Loading sold comps map…
Walkable amenities ~0.75 mi
Loading nearby amenities…
Taxation est. · year 1
- Rental income
- $14,069
- − Mortgage interest
- −$6,722
- − Property taxes
- −$1,972
- − Insurance
- −$600
- − Repairs & maintenance
- −$1,126
- − Management
- −$1,126
- − Depreciation
- −$3,491
- Taxable loss
- −$967
- Est. tax savings @ 24.0%
- +$232
- After-tax cash flow
- $1,223/yr
For passive investors: Depreciation is non-cash, so a rental often shows a tax loss while cash-flowing — sheltering income. Rental losses are passive: they offset passive income freely, and up to $25,000/yr can offset ordinary (W-2) income if you actively participate and your MAGI is under $100k (phasing out to $0 by $150k); unused losses carry forward. On sale, claimed depreciation is recaptured at up to 25%, and gains may owe capital-gains tax (a 1031 exchange can defer both). Figures are a year-1 estimate at your 24.0% rate — not tax advice; consult a CPA.
Schools (NCES district)
- District
- Kennard ISD
- NCES district ID
- 4825470
- Math proficiency
- 45% ▲ 20.00%
- Reading proficiency
- 40% ▲ 10.00%
- Median HH income
- $36,315
- Composite
- 37.6/100
- National rank
- #8840
- State rank
- #670 of 1141 in TX
Livability — Grapeland
- Score
- 69/100
- State rank
- #427
- US rank
- #8834
Category grades
Schools grade is shown separately in the Schools card above.
Census & demographics
- Population (ZIP)
- 5,004
Population outlook (Houston County) Hauer SSP2
- Today (2025)
- 21,269 people
- By 2030
- 20,568 · -3.3%
- By 2040
- 19,255 · -9.5%
- By 2050
- 17,980 · -15.5%
- By 2075
- 15,214 · -28.5%
- By 2100
- 11,720 · -44.9%
Race, ethnicity, and origin ACS 2023
- Neighborhood character
- Predominantly White (72%)
- Race & ethnicity
- White 72% Black 16% Hispanic / Latino 6% Two or more races 4% Native American 1%
- Hispanic origin (detail)
- Mexican 5%
- Common ancestry
- Serbian 4% Slovak 3% Romanian 2%
- Foreign-born
- 2% · Canada
- Languages at home
- 98% English-only · Spanish 2%
Political lean MEDSL · Houston
- 2024 margin
- Solid R (+55.4) · D 22.1% · R 77.4%
- 2008→2024 swing
- -18.1pp toward R · 2008: -37.3pp · 2024: -55.4pp
- All cycles
- 2024: R+55.4 2020: R+50.3 2016: R+50.9 2012: R+44.3 2008: R+37.3
Not yet ingested
- Civics
- —
Market trends
- HPI YoY
- ▲ 3.77%
- Current HPI
- 174.906
- Rent YoY
- —
- Metro
- —
- State GDP YoY
- ▲ 3.95%
- F500 in state
- 110
Industry mix (Fortune 500 HQ in TX)
| Industry | F500 HQs | Revenue |
|---|---|---|
| Energy | 16 | $1,198B |
|
||
| Technology | 5 | $198B |
|
||
| Engineering / Construction | 4 | $72B |
|
||
| Energy Services | 3 | $60B |
|
||
| Utilities | 3 | $41B |
|
||
| Healthcare | 2 | $330B |
|
||
Price history
2 events — show timeline
- 2026-04-21 Listed $120,000 Deep East Texas MLS
- 2014-10-28 Sold (Public Records) — Public Records
Property tax history
+3.2%/yrLatest (2025): $1,972 · -1.5% YoY. Source: county tax records.
Cash-flow waterfall
monthlySold comps — $/sqft
last 12 mo · ≤1 miLoading sold comps…