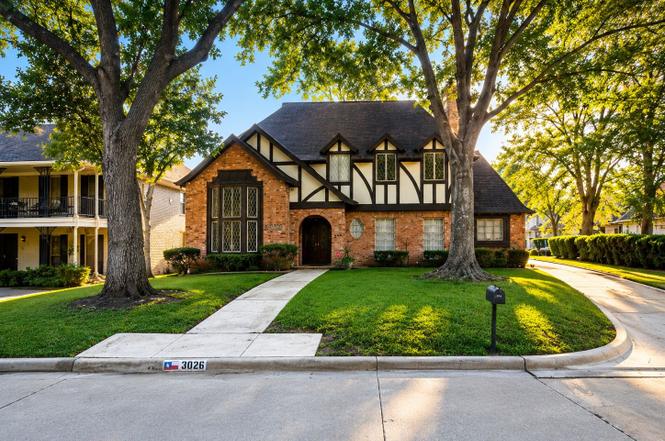
3026 Robinson Rd · Missouri City, TX
Flood risk 1/10 · Minimal
- FEMA flood zone
- X (unshaded)
- Chance of flooding over 30 yrs
- 0.0%
- Est. flood insurance / yr
- $507 – $1,088
Fire risk 1/10 · Minimal
- Est. fire insurance / yr
- $1,222 – $2,270
Heat risk 9/10 · Severe
- Hot days now (above 110°F)
- 7 days/yr
- Hot days in 30 yrs
- 23 days/yr
Wind risk 9/10 · Severe
- Chance of severe wind over 30 yrs
- 99.0%
Air-quality risk 3/10 · Minor
- Unhealthy air days now
- 2 days/yr
- Unhealthy air days in 30 yrs
- 3 days/yr
Risk factors via First Street. Map © Google.
Why this score? — see what drove the D+ grade
The composite is a weighted blend of 9 inputs, each scored 0–100. Each bar is that input's sub-score; the figure is the points it added to the 100-point composite (weight × sub-score).
- ARV discount +15.0/15.0
- Cash flow +9.8/30.0
- Schools +4.5/10.0
- 1% rule +4.4/10.0
- Appreciation +4.2/10.0
- Livability +3.4/5.0
- DSCR +2.8/10.0
- Rent growth +2.5/5.0
- Condition / age +2.5/5.0
$269,000
🖨 Deal sheet 📄 Offer letter ✓ Due diligence
Listing remarks MLS
Just up the street from the golf course & City Centre you can drive your golf cart at your convenience. Lovely English Tudor home with all the appointments. Covered front porch, Spacious entry thru beveled leaded front doors to a dramatic entry staircase. Formal dining that leads to kitchen with great cabinets for lots of storage and granite counters. Replaced appliances plus leaded garden window to look out over your kitchen sink . The den is in the heart of the home easily accessing the breakfast, kitchen and breakfast bar. Cozy fireplace for those cool nights. Master down with double closets, a wall of linen storage & separate makeup vanity, plus big counter & double sinks. Tub/shower & toilet are private. Upstairs you have 3 big bedrooms with plenty of closet space & extra storage. One bedroom is attached to the upstairs bathroom for privacy as well. Big laundry off the breakfast leads to breezeway to garage. Den opens to a big back patio to take in all the nature around you.
Key facts
- Fort bend tollway
- Sam houston tollway
- Covered back patio
Tags
Property features AI
Finance
- Other: Full ownership
- HOA & community: Quail Valley Fund association; Annual association fee of $500; Community features include curbs, golf, and gutters
Exterior
- Parking: Detached garage; 2-car garage
- Utilities: Public water; Public sewer
- Home design: Residential property; Faces east; Built in 1973; Slab foundation
- Construction: Brick construction; Composition roof
- Exterior features: Covered patio; Patio; Porch; Deck; Near golf course; Subdivision; Concrete road surface
Interior
- Kitchen: Kitchen on first level (14 x 12); Breakfast nook on first level (11 x 9)
- Bedrooms: Primary bedroom on second level (17 x 14); Bedroom on second level (13 x 12); Bedroom on second level (12 x 11); Bedroom on second level (12 x 11)
- Flooring: Carpet; Tile; Wood
- Bathrooms: 2 full bathrooms; 1 half bathroom; Primary bathroom on second level (11 x 9); Bathroom on second level (9 x 8)
- Heating & cooling: Central heating (gas, zoned); Central air conditioning (electric, zoned)
- Interior features: Entrance foyer; High ceilings; 2 fireplaces; 11 total rooms
Neighborhood map
What this means for you Summary
Snapshot
- This is a 4-bed/3.0-bath single-family listed at $269k.
Deal economics
- At list price, monthly cash flow is $-174 ($-2k/yr) — negative.
- To cash-flow at today's rent, offer at most $238k (11.4% below list).
- To meet the 1% rule (rent ≥ 1% of price), the offer needs to be $254k (5.5% below list).
- Recommended offer: $238k (11.4% below list) — sets the bar for cash-flow.
- Cap rate 5.5% vs local median 3.5% in Missouri City — top-decile yield for the area; either an underpriced asset or a hidden risk that comps aren't pricing in. Stress-test before assuming the spread holds.
Location & tenants
- Location reads 67/100 on livability (#526 in TX) — a middle-class / working-renter tenant base. Strengths: housing A+, crime A, employment A; Watch: amenities F, commute F, health & safety F.
- Fort Bend ISD (suburban): math 44% / reading 53% proficiency, ranked #140 of 826 in TX (top 17%) — families likely to look elsewhere, expect single-tenant / working-renter base with shorter leases.
- Zoned schools: Quail Valley El (math 27% / reading 42%, grade F, #1,995 of 4,322 statewide, top 50%, 564 students, 64% FRL); Quail Valley Middle (math 55% / reading 57%, grade B-, #234 of 1,662 statewide, top 14%, 1,043 students, 45% FRL) — zoned schools average 55% FRL vs 35% district-wide (20 pts higher); higher-poverty schools than district average — tighter screening recommended.
- Market conditions: Rents soft (-0.1%/yr); 1215 active listings in the ZIP; 13 comparable units currently listed for rent nearby; rentals at typical pace (median 21d on market — plan ~3-4 weeks tenant-placement turnaround); high-income renter base; 12,093 units permitted in Fort Bend County in 2024 (815 in 5+ unit buildings).
Forward outlook
- Local home prices are declining (-1.7%/yr); year-one equity from $2k of loan paydown is wiped out by about $4k of value loss. Plan a longer hold.
- Fort Bend County population projected at +75% by 2050 — long-run rental-demand tailwind backs the buy-and-hold thesis.
Negotiation context
- Only 7 days on market — expect competitive offers; lowballing is unlikely to land.
- 8 sale attempts since 12y ago with the ask held roughly flat each time — persistent listings suggest the price (not the market) is what's stuck; bring a comps-based counter.
Risks & watch-outs
- Watch-outs: property tax is 2.7% of price.
- Climate carrying-cost: severe wind risk, 99% chance of damaging wind over 30y; extreme-heat days projected 7→23/yr by 2055 (HVAC capex compounding) — expect insurance premiums to compound above CPI over the hold.
Questions for the listing agent
- What do current leases actually rent for vs. the listed asking? Can we see a recent rent roll and the last 12 months of T-12 income?
- Built in 1973 — when were the roof, HVAC, electrical panel, plumbing, and water heater last replaced?
- Property tax is high relative to price — has the assessment been appealed recently, and will the sale trigger a re-assessment?
- What does the HOA fee cover, when was the last increase, and are there any pending special assessments or reserve-fund shortfalls?
- Is there a deadline driving the sale (1031 exchange, divorce, estate, relocation)? That informs how much negotiation room exists.
- Schools are B-rated — typically a magnet for longer-tenancy family renters. What's the average tenant stay here, and is there a school-zone premium baked into asking?
- The area grade is low — what's the realistic commute time and amenity access for the typical tenant pool here? Any planned neighborhood developments (good or bad) we should know about?
- What's the average days-on-market for RENTAL listings here right now (not sales)? A rising rental-DOM trend means longer vacancies and softer asking-rent achievability than the comps imply.
- What's the recent tenant-quality profile in this submarket — average credit score on applications, eviction rate, late-payment / NSF rate, and stable-employment percentage? A property-management company in the area should have these aggregated.
- How much new for-sale + rental construction is in the pipeline within 1–3 miles? Heavy new supply typically softens prices + rents 12–24 months out; constrained supply supports both.
Investment metrics
- 1% rule
- 0.94% ✗
- Cap rate
- 5.52%
- Cash-on-cash
- -2.77%
- DSCR
- 0.88
- GRM
- 8.8
CMA / ARV
- ARV (on-the-fly)
- $431,100
- Comps found
- 12
Show comp detail 12 sales within ~0.75 mi
| Address | Dist | Beds/Ba | Sqft | Sold | Price | $/sf | Match |
|---|---|---|---|---|---|---|---|
| 3322 Robinson Road Rd | 0.40mi | 4/3.0 | 3,029 (+5%) | 2mo | $549,900 | $182 | 70 |
| 2702 Quail Creek Dr | 0.48mi | 4/2.0 | 2,774 (-4%) | 0mo | $280,000 | $101 | 67 |
| 2823 W Pebble Beach Dr | 0.45mi | 4/2.5 | 2,691 (-6%) | 3mo | $415,000 | $154 | 64 |
| 3010 Apple Valley Ln | 0.23mi | 4/2.5 | 2,492 (-13%) | 1mo | $375,000 | $150 | 64 |
| 3602 E Creek Club Dr | 0.47mi | 4/2.5 | 2,694 (-6%) | 4mo | $369,000 | $137 | 63 |
| 2935 Oak Pointe Blvd | 0.52mi | 4/3.5 | 2,684 (-7%) | 0mo | $439,900 | $164 | 62 |
| 3014 Canyon Ct | 0.66mi | 4/2.5 | 2,797 (-3%) | 2mo | $440,000 | $157 | 62 |
| 2607 E Pebble Beach Dr | 0.61mi | 4/3.5 | 2,726 (-5%) | 1mo | $399,999 | $147 | 60 |
| 3450 Talia Wood Ct | 0.74mi | 5/3.5 (+1) | 2,940 (+2%) | 6mo | $394,900 | $134 | 50 |
| 3510 Plum Brook Ln | 0.74mi | 4/2.5 | 2,674 (-7%) | 4mo | $350,000 | $131 | 49 |
| 3203 Broken Bough Dr | 0.48mi | 4/2.5 | 2,476 (-14%) | 5mo | $340,000 | $137 | 48 |
| 3126 Glenn Lakes Ln | 0.70mi | 4/2.5 | 2,545 (-11%) | 3mo | $399,000 | $157 | 44 |
Match score weights: distance 35% · size 25% · config 20% · recency 20%. Top-matched comps best support the ARV.
Projected returns pro-forma
-1.67% appreciation · 0.0% rent growth · sell at horizon
- IRR
- -15.8%
- Equity multiple
- 0.38×
- Total profit
- $-46,525
- Equity at exit
- $56,417
- IRR
- -13.1%
- Equity multiple
- 0.09×
- Total profit
- $-68,659
- Equity at exit
- $52,256
Cash invested: $75,320 (down + closing). Projections, not guarantees.
Landlord ↔ Tenant lean methodology
- Overall (STATE)
- 87 Strongly Landlord-Friendly
- State Texas
- 87 Strongly Landlord-Friendly · R+5
- County
- — inherits STATE
- City
- — inherits STATE
ZIP-level market 77459
- Home prices YoY
- -0.8%
- Rents YoY
- -0.1%
- Active inventory
- 1215
- Price-to-rent
- 8.8×
Monthly cashflow live
- Estimated rent
- $2,541 high interval (Pro) →
- Mortgage (P&I)
- −$1,411
- Tax from tax record
- −$616 /mo · $7,394/yr
- Insurance
- −$112
- HOA
- −$42
- Vacancy / Maint / Mgmt
- −$534
- Net cashflow
- $-174
Break-even live
UW: 25.0% down · 7.5% · 30yr · 1.5% tax · 5.0% vac · 8.0% maint · 8.0% mgmt
Financing live
Cash to close
- Down payment
- $67,250
- Closing costs
- $8,070
- Reserves months
- —
- Total cash needed
- —
Loan-product check · same deal, 3 products live
Conventional
25% down · 7.5% · 30yr
- Down + closing
- —
- Monthly P&I
- —
- Monthly cashflow
- —
- DSCR
- —
- Eligible?
- —
Personal DTI + credit; lowest rate.
DSCR
20% down · 8.5% · 30yr
- Down + closing
- —
- Monthly P&I
- —
- Monthly cashflow
- —
- DSCR
- —
- Eligible?
- —
No personal income docs; deal must DSCR.
Hard money
10% down · 12.0% · 12mo
- Down + closing
- —
- Monthly P&I
- —
- Monthly cashflow
- —
- DSCR
- —
- Eligible?
- —
Short-term bridge; refi at stabilization.
Rent comps 13 comps
| Address | Beds | Baths | Sqft | Rent | $/sqft | DOM | Units | Dist |
|---|---|---|---|---|---|---|---|---|
| 3327 Shady Glen Ln Missouri City, TX | 4.0 | 2.5 | 2232 | $2,250 | $1.01 | 13d | 1 | 0.55mi |
| 2319 Quail Valley East Dr Missouri City, TX | 5.0 | 3.0 | 2235 | $2,000 | $0.89 | 44d | 1 | 0.60mi |
| 3912 Cedar Valley Dr Missouri City, TX | 3.0 | 2.0 | 2151 | $2,200 | $1.02 | 21d | 1 | 0.69mi |
| 2307 Hilton Head Dr Missouri City, TX | 4.0 | 2.0 | 2606 | $2,239 | $0.86 | 17d | 1 | 0.70mi |
| 3512 Talia Wood Ct Missouri City, TX | 4.0 | 3.5 | 2950 | $2,900 | $0.98 | 10d | 1 | 0.73mi |
| 3611 Duncaster Dr Missouri City, TX | 3.0 | 2.5 | 1926 | $2,100 | $1.09 | 20d | 1 | 0.82mi |
| 3907 Kiamesha Dr Missouri City, TX | 4.0 | 2.5 | 2896 | $2,750 | $0.95 | 17d | 1 | 0.86mi |
| 2010 Quail Valley East Dr Missouri City, TX | 5.0 | 3.0 | 2651 | $2,695 | $1.02 | 44d | 1 | 1.02mi |
| 2120 Bermuda Dunes Dr Missouri City, TX | 3.0 | 2.5 | 2100 | $2,200 | $1.05 | 24d | 1 | 1.02mi |
| 2608 Grand Plantation Ct Missouri City, TX | 3.0 | 2.0 | 2150 | $2,450 | $1.14 | 13d | 1 | 1.23mi |
| 4039 Mission Valley Dr Missouri City, TX | 4.0 | 2.5 | 2364 | $2,495 | $1.06 | 22d | 1 | 1.38mi |
| 6518 Portuguese Bend Dr Missouri City, TX | 4.0 | 2.5 | 2920 | $6,500 | $2.23 | 44d | 1 | 1.44mi |
| 4340 Lake Walk Ct Missouri City, TX | 3.0 | 2.5 | 2100 | $2,600 | $1.24 | 22d | 1 | 1.46mi |
HOA detail
- Monthly dues
- $42 · $504/yr
Listing history 6 events
-
2026-06-18days on market $269,000 Active 7 DOM
-
2026-06-17days on market $269,000 Active 6 DOM
-
2026-06-16days on market $269,000 Active 5 DOM
-
2026-06-15days on market $269,000 Active 4 DOM
-
2026-06-13remarks 647-char remark
-
2026-06-13$269,000 Active 2 DOM
ⓘ Source: listings_history table (triggers on properties + properties_extension) + one-shot
backfill from property_details.listing_events for pre-trigger history.
Tax reassessment forecast TX · Resets to sale price
- Current annual tax
- $7,394 · $616/mo
- Projected year-2 tax
- $7,394 · $616/mo
- Expected delta
- $0/yr ($0/mo · 0.0%)
ⓘ Screening estimate from a state-policy table — verify with the county assessor before closing.
Climate risk First Street
- Flood 1/10 Low FEMA zone X (unshaded) · 0% chance over 30 yrs
- Wildfire 1/10 Low
- Heat 9/10 Extreme 7 d/yr ≥110°F today · 23 d/yr by 30 yrs out
- Wind 9/10 Extreme 99% chance of damaging wind over 30 yrs
- Air quality 3/10 Moderate 2 unhealthy d/yr today · 3 by 30 yrs out
Nearby sold comps map
Loading sold comps map…
Walkable amenities ~0.75 mi
Loading nearby amenities…
Taxation est. · year 1
- Rental income
- $30,491
- − Mortgage interest
- −$15,068
- − Property taxes
- −$7,394
- − Insurance
- −$1,345
- − Repairs & maintenance
- −$2,439
- − Management
- −$2,439
- − HOA
- −$504
- − Depreciation
- −$7,825
- Taxable loss
- −$6,524
- Est. tax savings @ 24.0%
- +$1,566
- After-tax cash flow
- $-517/yr
For passive investors: Depreciation is non-cash, so a rental often shows a tax loss while cash-flowing — sheltering income. Rental losses are passive: they offset passive income freely, and up to $25,000/yr can offset ordinary (W-2) income if you actively participate and your MAGI is under $100k (phasing out to $0 by $150k); unused losses carry forward. On sale, claimed depreciation is recaptured at up to 25%, and gains may owe capital-gains tax (a 1031 exchange can defer both). Figures are a year-1 estimate at your 24.0% rate — not tax advice; consult a CPA.
Schools (NCES district)
- District
- Fort Bend ISD
- NCES district ID
- 4819650
- Math proficiency
- 44% ▼ -15.00%
- Reading proficiency
- 53% ▼ -4.00%
- Median HH income
- $82,360
- Composite
- 44.61/100
- National rank
- #2779
- State rank
- #140 of 826 in TX
Livability — Missouri City
- Score
- 67/100
- State rank
- #526
- US rank
- #10308
Category grades
Schools grade is shown separately in the Schools card above.
Census & demographics
- Census place
- Missouri City, TX
- County
- Fort Bend County · 836,777 people
- City population
- 123,513
- Metro
- Houston-The Woodlands-Sugar Land, TX
- Population (ZIP)
- 84,221
- Household income
- $129,151
- Rent vs Own
- Severe rent burden
- 1004.0
Population outlook (Fort Bend County) Hauer SSP2
- Today (2025)
- 1,004,526 people
- By 2030
- 1,153,104 · +14.8%
- By 2040
- 1,453,718 · +44.7%
- By 2050
- 1,753,781 · +74.6%
- By 2075
- 2,455,772 · +144.5%
- By 2100
- 2,930,528 · +191.7%
Race, ethnicity, and origin ACS 2023
- Neighborhood character
- Highly diverse neighborhood (Simpson 0.75)
- Race & ethnicity
- White 34% Black 26% Asian 22% Hispanic / Latino 13% Two or more races 10%
- Hispanic origin (detail)
- Mexican 7%
- Common ancestry
- Lithuanian 2% Slovak 1% Italian 1%
- Foreign-born
- 21% · Canada, China, Vietnam
- Languages at home
- 73% English-only · Other Asian/Pacific 8% Spanish 7% Other Indo-European 5%
Political lean MEDSL · Fort Bend
- 2024 margin
- Toss-up / Even · D 49.5% · R 47.9% · Other 2.6%
- 2008→2024 swing
- +4.0pp toward D · 2008: -2.4pp · 2024: 1.6pp
- All cycles
- 2024: D+1.6 2020: D+10.6 2016: D+6.6 2012: R+6.8 2008: R+2.4
Not yet ingested
- Civics
- —
Market trends
- HPI YoY
- ▼ -1.67%
- Current HPI
- 212.3573
- Rent YoY
- ▼ -0.15%
- Metro
- Houston-The Woodlands-Sugar Land, TX
- State GDP YoY
- ▲ 3.95%
- F500 in state
- 110
Industry mix (Fortune 500 HQ in TX)
| Industry | F500 HQs | Revenue |
|---|---|---|
| Energy | 16 | $1,198B |
|
||
| Technology | 5 | $198B |
|
||
| Engineering / Construction | 4 | $72B |
|
||
| Energy Services | 3 | $60B |
|
||
| Utilities | 3 | $41B |
|
||
| Healthcare | 2 | $330B |
|
||
Price history
+15.0% since first listed20 events — show timeline
- 2026-06-11 Listed $269,000 HARMLS
- 2018-08-30 Sold (Public Records) — Public Records
- 2018-08-29 Sold (MLS) — HARMLS
- 2018-08-23 Pending — HARMLS
- 2018-03-13 Listed $249,900 HARMLS
- 2017-08-25 Listing Removed — HARMLS
- 2017-07-04 Price Changed $239,000 HARMLS
- 2017-05-10 Price Changed $242,000 HARMLS
- 2017-03-08 Price Changed $249,900 HARMLS
- 2017-01-27 Listed $259,900 HARMLS
- 2016-09-06 Listing Removed — HARMLS
- 2016-03-01 Listed $242,000 HARMLS
- 2016-01-09 Listing Removed — HARMLS
- 2016-01-08 Relisted — HARMLS
- 2016-01-05 Pending — HARMLS
- 2015-09-09 Listed $242,000 HARMLS
- 2015-09-09 Listing Removed — HARMLS
- 2015-05-29 Listed $249,000 HARMLS
- 2014-11-06 Listing Removed — HARMLS
- 2014-10-23 Listed $234,000 HARMLS
Property tax history
+4.1%/yrLatest (2025): $7,394 · -9.4% YoY. Source: county tax records.
Cash-flow waterfall
monthlySold comps — $/sqft
last 12 mo · ≤1 miLoading sold comps…