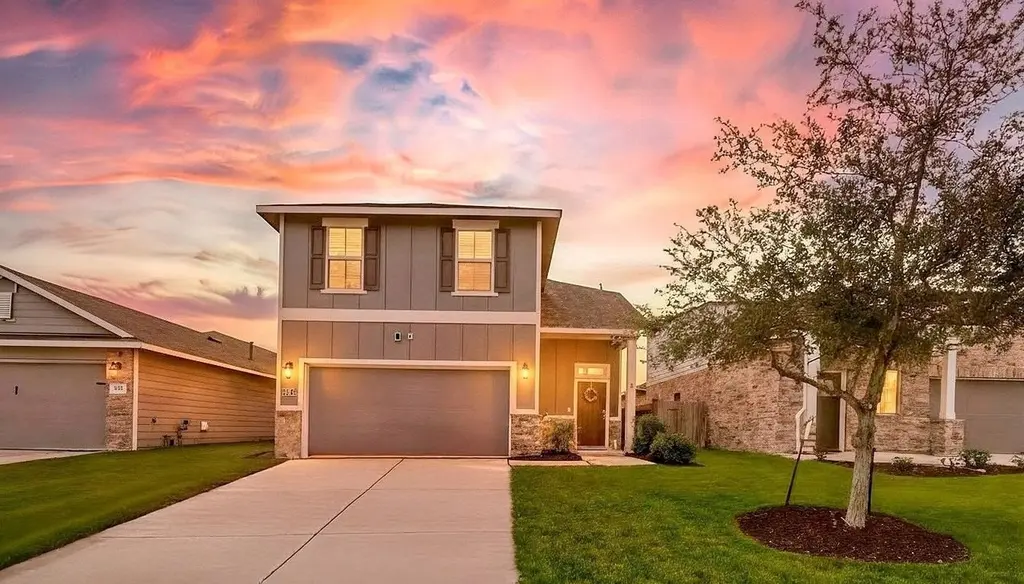
21419 Hawthorn Harvest Cir · Houston, TX
Flood risk 4/10 · Minor
- FEMA flood zone
- X (unshaded)
- Chance of flooding over 30 yrs
- 0.2%
- Est. flood insurance / yr
- $507 – $1,088
Fire risk 4/10 · Minor
- Est. fire insurance / yr
- $1,222 – $2,270
Heat risk 9/10 · Severe
- Hot days now (above 110°F)
- 7 days/yr
- Hot days in 30 yrs
- 22 days/yr
Wind risk 9/10 · Severe
- Chance of severe wind over 30 yrs
- 99.0%
Air-quality risk 2/10 · Minimal
- Unhealthy air days now
- 2 days/yr
- Unhealthy air days in 30 yrs
- 2 days/yr
Risk factors via First Street. Map © Google.
Why this score? — see what drove the D grade
The composite is a weighted blend of 9 inputs, each scored 0–100. Each bar is that input's sub-score; the figure is the points it added to the 100-point composite (weight × sub-score).
- ARV discount +11.6/15.0
- Cash flow +7.9/30.0
- Appreciation +4.4/10.0
- Schools +4.4/10.0
- Condition / age +4.0/5.0
- 1% rule +3.7/10.0
- Livability +3.7/5.0
- DSCR +2.0/10.0
- Rent growth +1.8/5.0
$300,000
🖨 Deal sheet (PDF) 📄 Offer letter ✓ Due diligence
Listing remarks
Welcome to this beautifully maintained home with an upstairs game room in the desired Lantana community. The open-concept main floor features a bright living and dining area with elegant tile flooring and plenty of natural light. The kitchen offers crisp white cabinetry, granite countertops, a peninsula with breakfast bar seating, and a spacious pantry. The first-floor primary suite is a relaxing retreat with a walk-in shower and closet. Upstairs is a versatile game room, three secondary bedrooms, and a full bath, giving everyone the space they need. Enjoy a peaceful backyard with no back neighbors, a covered patio, and room to entertain or unwind. Community amenities include a splash pad,
Key facts
- Spacious pantry
- Covered patio
- Upstairs game room
Tags
Neighborhood map
What this means for you Summary
Snapshot
- This is a 4-bed/2.5-bath single-family listed at $300k. Condition is rated good.
Deal economics
- At list price, monthly cash flow is $-314 ($-4k/yr) — negative.
- To cash-flow at today's rent, offer at most $245k (18.5% below list).
- To meet the 1% rule (rent ≥ 1% of price), the offer needs to be $262k (12.7% below list).
- Recommended offer: $245k (18.5% below list) — sets the bar for cash-flow.
- Cap rate 5.0% vs local median 3.2% in Houston — top-decile yield for the area; either an underpriced asset or a hidden risk that comps aren't pricing in. Stress-test before assuming the spread holds.
Location & tenants
- Location reads 74/100 on livability (#184 in TX, #4,771 nationally) — a middle-class / working-renter tenant base. Strengths: amenities A+, cost of living A+, housing A+; Watch: crime F.
- Cypress-Fairbanks ISD (suburban): math 45% / reading 52% proficiency, ranked #161 of 826 in TX (top 20%) — families likely to look elsewhere, expect single-tenant / working-renter base with shorter leases.
- Zoned schools: Hemmenway El (math 29% / reading 40%, grade F, #1,995 of 4,322 statewide, top 50%, 1,151 students, 82% FRL); Thornton Middle (math 28% / reading 41%, grade F, #858 of 1,662 statewide, top 54%, 1,397 students, 80% FRL); Cypress-Fairbanks J J A E P (12 students, 0% FRL).
- Zoned-school proficiency averages 34% at this address vs 48% district-wide (-14 pts) — the specific schools serving this property underperform the Cypress-Fairbanks ISD average; the district grade overstates school quality for this exact location.
- Market conditions: Rents soft (-2.9%/yr); 763 active listings in the ZIP; 27 comparable units currently listed for rent nearby; rentals lingering (median 46d on market — plan ~5-8 weeks vacancy on turnover, expect pricing pressure); 70% of comp listings sitting > 30 days — soft ceiling on asking rent; solid renter incomes; 29,883 units permitted in Harris County in 2024 (8,621 in 5+ unit buildings).
- This rent runs 36% of the median local income ($88k/yr) — at the standard rent-burdened threshold; future hikes will face affordability resistance.
Forward outlook
- Local home prices are declining (-1.3%/yr); year-one equity from $2k of loan paydown is wiped out by about $4k of value loss. Plan a longer hold.
- Harris County population projected at +47% by 2050 — long-run rental-demand tailwind backs the buy-and-hold thesis.
Negotiation context
- It's been on market 206 days — a 12% lower offer ($264k) is reasonable based on typical stale-listing flexibility.
- 2 sale attempts; this cycle's ask has dropped $20k (6%) from the opening price — seller is motivated, your offer sets the floor, not the list.
Risks & watch-outs
- Watch-outs: property tax is 2.6% of price.
- Climate carrying-cost: severe wind risk, 99% chance of damaging wind over 30y; extreme-heat days projected 7→22/yr by 2055 (HVAC capex compounding) — expect insurance premiums to compound above CPI over the hold.
Questions for the listing agent
- What do current leases actually rent for vs. the listed asking? Can we see a recent rent roll and the last 12 months of T-12 income?
- It's been on market 206 days. Have you received any prior offers? Is the seller open to a 18% concession, seller financing, or rate buy-down credit?
- Property tax is high relative to price — has the assessment been appealed recently, and will the sale trigger a re-assessment?
- What does the HOA fee cover, when was the last increase, and are there any pending special assessments or reserve-fund shortfalls?
- Why hasn't it sold? Are there any deal-killer items the seller is aware of (foundation, flood, title, zoning, code violations)?
- Is there a deadline driving the sale (1031 exchange, divorce, estate, relocation)? That informs how much negotiation room exists.
- Schools are D-rated, which usually means shorter tenancies and higher turnover. Who's the typical renter profile here, and what's been the actual vacancy rate?
- Crime grade is F in this area — have there been break-ins, vandalism, or insurance claims at this property in the last 3 years? What carrier currently insures it and at what premium?
- The area grade is low — what's the realistic commute time and amenity access for the typical tenant pool here? Any planned neighborhood developments (good or bad) we should know about?
- What's the average days-on-market for RENTAL listings here right now (not sales)? A rising rental-DOM trend means longer vacancies and softer asking-rent achievability than the comps imply.
- What's the recent tenant-quality profile in this submarket — average credit score on applications, eviction rate, late-payment / NSF rate, and stable-employment percentage? A property-management company in the area should have these aggregated.
- How much new for-sale + rental construction is in the pipeline within 1–3 miles? Heavy new supply typically softens prices + rents 12–24 months out; constrained supply supports both.
Investment metrics
- 1% rule
- 0.87% ✗
- Cap rate
- 5.04%
- Cash-on-cash
- -4.48%
- DSCR
- 0.80
- GRM
- 9.6
CMA / ARV
- ARV (median comp)
- $330,008
- List price
- $300,000
- Delta
- -9.09%
- Verdict
- FAIR
- Comps
- 20 within 1.0 mi
Show comp detail 12 sales within ~0.75 mi
| Address | Dist | Beds/Ba | Sqft | Sold | Price | $/sf | Match |
|---|---|---|---|---|---|---|---|
| 21626 Sage Landing Ln | 0.21mi | 4/2.5 | 2,250 (-3%) | 7mo | $310,000 | $138 | 80 |
| 6435 Purple Wreath Way | 0.26mi | 4/2.5 | 2,115 (-8%) | 5mo | $293,000 | $139 | 70 |
| 21623 Calico Bush Trl | 0.19mi | 4/2.5 | 2,168 (-6%) | 17mo | $320,000 | $148 | 67 |
| 21415 Holly Heights Rd | 0.20mi | 4/2.5 | 2,090 (-10%) | 10mo | $315,000 | $151 | 67 |
| 6318 Verbena Blossom Trl | 0.27mi | 4/2.5 | 2,097 (-9%) | 9mo | $309,000 | $147 | 65 |
| 6807 Blue Stem Hill Cir | 0.14mi | 4/2.0 | 2,015 (-13%) | 11mo | $315,000 | $156 | 61 |
| 6319 Founding Dr | 0.59mi | 4/2.5 | 2,202 (-5%) | 6mo | $330,000 | $150 | 60 |
| 6131 Purple Iris St | 0.60mi | 5/2.5 (+1) | 2,326 (+1%) | 7mo | $315,000 | $135 | 60 |
| 7303 Cypress Pin Oak Dr | 0.66mi | 3/3.0 (-1) | 2,412 (+4%) | 5mo | $320,000 | $133 | 51 |
| 21323 Cypress Live Oak | 0.59mi | 3/2.0 (-1) | 2,069 (-10%) | 6mo | $320,000 | $155 | 43 |
| 21111 Diamond Rock Ct | 0.63mi | 4/2.5 | 2,048 (-11%) | 11mo | $289,000 | $141 | 42 |
| 7330 Cypress Shumard Oak Dr | 0.75mi | 4/2.0 | 2,028 (-12%) | 18mo | $355,000 | $175 | 28 |
Match score weights: distance 35% · size 25% · config 20% · recency 20%. Top-matched comps best support the ARV.
Projected returns pro-forma
-1.27% appreciation · 0.0% rent growth · sell at horizon
- IRR
- -15.7%
- Equity multiple
- 0.36×
- Total profit
- $-53,646
- Equity at exit
- $68,536
- IRR
- -12.5%
- Equity multiple
- 0.04×
- Total profit
- $-80,421
- Equity at exit
- $68,711
Cash invested: $84,000 (down + closing). Projections, not guarantees.
Landlord ↔ Tenant lean methodology
- Overall (STATE)
- 87 Strongly Landlord-Friendly
- State Texas
- 87 Strongly Landlord-Friendly · R+5
- County
- — inherits STATE
- City
- — inherits STATE
ZIP-level market 77449
- Home prices YoY
- -0.5%
- Rents YoY
- -2.9%
- Active inventory
- 763
- Price-to-rent
- 9.6×
Monthly cashflow live
- Estimated rent
- $2,618 high interval (Pro) →
- Mortgage (P&I)
- −$1,573
- Tax from tax record
- −$641 /mo · $7,695/yr
- Insurance
- −$125
- HOA
- −$42
- Vacancy / Maint / Mgmt
- −$550
- Net cashflow
- $-314
Break-even live
Sensitivity live
| Price | -10% $-144 | -5% $-229 | +0% $-314 | +5% $-398 | +10% $-483 |
|---|---|---|---|---|---|
| Rent | -10% $-520 | -5% $-417 | +0% $-314 | +5% $-210 | +10% $-107 |
| Rate | -1.0pp $-162 | -0.5pp $-237 | base $-314 | +0.5pp $-391 | +1.0pp $-470 |
UW: 25.0% down · 7.5% · 30yr · 1.5% tax · 5.0% vac · 8.0% maint · 8.0% mgmt
Financing live
Cash to close
- Down payment
- $75,000
- Closing costs
- $9,000
- Reserves months
- —
- Total cash needed
- —
Loan-product check · same deal, 3 products live
Conventional
25% down · 7.5% · 30yr
- Down + closing
- —
- Monthly P&I
- —
- Monthly cashflow
- —
- DSCR
- —
- Eligible?
- —
Personal DTI + credit; lowest rate.
DSCR
20% down · 8.5% · 30yr
- Down + closing
- —
- Monthly P&I
- —
- Monthly cashflow
- —
- DSCR
- —
- Eligible?
- —
No personal income docs; deal must DSCR.
Hard money
10% down · 12.0% · 12mo
- Down + closing
- —
- Monthly P&I
- —
- Monthly cashflow
- —
- DSCR
- —
- Eligible?
- —
Short-term bridge; refi at stabilization.
Rent comps 27 comps
| Address | Beds | Baths | Sqft | Rent | $/sqft | DOM | Units | Dist |
|---|---|---|---|---|---|---|---|---|
| 21415 Bluebonnet Cove Ct Katy, TX | 4.0 | 2.5 | 2514 | $3,000 | $1.19 | 45d | 1 | 0.25mi |
| 21454 Bluebonnet Cove Ct Katy, TX | 4.0 | 2.5 | 2320 | $2,600 | $1.12 | 45d | 1 | 0.31mi |
| 6506 Garden Canyon Dr Katy, TX | 3.0 | 2.0 | 1842 | $1,895 | $1.03 | 23d | 1 | 0.61mi |
| 21054 Breezeway Cove Dr Bridgeland, TX | 3.0–4.0 | 2.5–3.5 | 1784 | $3,258 | $1.83 | 1d | 41 | 0.86mi |
| 21235 Catalina Palm Dr Cypress, TX | 4.0 | 2.0 | 1756 | $2,600 | $1.48 | 45d | 1 | 0.88mi |
| 20735 Dewberry Creek Ln Katy, TX | 4.0 | 2.0 | 1609 | $1,756 | $1.09 | 23d | 1 | 0.92mi |
| 21331 Hartford Hollow Ln Katy, TX | 3.0 | 2.0 | 1820 | $1,500 | $0.82 | 21d | 1 | 0.96mi |
| 7558 Magnolia Orchid Ln Cypress, TX | 4.0 | 2.5 | 1743 | $2,390 | $1.37 | 45d | 1 | 0.97mi |
| 21038 Bay Village Dr Cypress, TX | 4.0 | 2.5 | 1904 | $2,491 | $1.31 | 45d | 1 | 1.01mi |
| 7546 Coral Terrace Dr Cypress, TX | 3.0 | 2.5 | 2050 | $2,699 | $1.32 | 45d | 1 | 1.03mi |
| 21034 Shore Oak Dr Cypress, TX | 4.0 | 3.0 | 2110 | $2,950 | $1.40 | 45d | 1 | 1.05mi |
| 6642 High Stone Ln Katy, TX | 4.0 | 2.0 | 2091 | $1,999 | $0.96 | 45d | 1 | 1.06mi |
| 7310 Coconut Bay Dr Cypress, TX | 4.0 | 2.0 | 1620 | $2,307 | $1.42 | 45d | 1 | 1.10mi |
| 21114 Montego Bay Dr Cypress, TX | 3.0 | 2.5 | 2124 | $2,499 | $1.18 | 45d | 1 | 1.12mi |
| 6810 N Fry Rd Katy, TX | 1.0–3.0 | 1.0–3.0 | 1151 | $2,683 | $2.33 | 1d | 58 | 1.19mi |
| 21031 Sandestin Ridge Dr Cypress, TX | 5.0 | 3.5 | 2099 | $2,861 | $1.36 | 45d | 1 | 1.20mi |
| 7911 Tuscan Cypress Dr Cypress, TX | 4.0 | 3.0 | 1730 | $2,475 | $1.43 | 45d | 1 | 1.25mi |
| 21522 Violet Ridge Rd Katy, TX | 3.0 | 4.0 | 1597 | $2,200 | $1.38 | 45d | 1 | 1.30mi |
| 21047 Treasure Gate Ln Cypress, TX | 5.0 | 3.0 | 2461 | $2,953 | $1.20 | 45d | 1 | 1.32mi |
| 21046 Treasure Gate Ln Cypress, TX | 4.0 | 2.5 | 2489 | $3,045 | $1.22 | 45d | 1 | 1.34mi |
| 21038 Treasure Gate Ln Cypress, TX | 4.0 | 2.5 | 1804 | $2,676 | $1.48 | 45d | 1 | 1.36mi |
| 6610 Gorton Dr Katy, TX | 4.0 | 3.5 | 2481 | $750 | $0.30 | 4d | 1 | 1.37mi |
| 21010 Treasure Gate Ln Cypress, TX | 4.0 | 2.0 | 2157 | $2,768 | $1.28 | 45d | 1 | 1.39mi |
| 21054 Montego Breeze Ln Cypress, TX | 3.0–5.0 | 2.0–3.5 | 1935 | $2,622 | $1.35 | 14d | 21 | 1.39mi |
| 21034 Montego Breeze Ln Cypress, TX | 5.0 | 3.0 | 2461 | $2,861 | $1.16 | 45d | 1 | 1.42mi |
| 21014 Montego Breeze Ln Cypress, TX | 4.0 | 2.5 | 2489 | $2,953 | $1.19 | 45d | 1 | 1.44mi |
| 20730 Dickinson Manor Ln Cypress, TX | 5.0 | 2.5 | 2710 | $2,350 | $0.87 | 3d | 1 | 1.47mi |
HOA detail
- Monthly dues
- $42 · $504/yr
Listing history 20 events
-
2026-06-21days on market $300,000 Active 206 DOM
-
2026-06-18days on market $300,000 Active 203 DOM
-
2026-06-17days on market $300,000 Active 202 DOM
-
2026-06-16days on market $300,000 Active 201 DOM
-
2026-06-15days on market $300,000 Active 200 DOM
-
2026-06-13days on market $300,000 Active 198 DOM
-
2026-06-13days on market $300,000 Active 197 DOM
-
2026-06-09days on market $300,000 Active 194 DOM
-
2026-06-08days on market $300,000 Active 193 DOM
-
2026-06-07days on market $300,000 Active 192 DOM
-
2026-06-04days on market $300,000 Active 189 DOM
-
2026-06-03days on market $300,000 Active 188 DOM
-
2026-06-02days on market $300,000 Active 187 DOM
-
2026-06-02days on market $300,000 Active 186 DOM
-
2026-05-31days on market $300,000 Active 185 DOM
-
2026-05-18historical
-
2026-04-24status Active
-
2026-04-24price $310,000
-
2026-04-20historical
-
2025-11-20$320,000 Active
ⓘ Source: listings_history table (triggers on properties + properties_extension) + one-shot
backfill from property_details.listing_events for pre-trigger history.
Tax reassessment forecast TX · Resets to sale price
- Current annual tax
- $7,695 · $641/mo
- Projected year-2 tax
- $7,695 · $641/mo
- Expected delta
- $0/yr ($0/mo · 0.0%)
ⓘ Screening estimate from a state-policy table — verify with the county assessor before closing.
Climate risk First Street
- Flood 4/10 Moderate FEMA zone X (unshaded) · 20% chance over 30 yrs
- Wildfire 4/10 Moderate
- Heat 9/10 Extreme 7 d/yr ≥110°F today · 22 d/yr by 30 yrs out
- Wind 9/10 Extreme 99% chance of damaging wind over 30 yrs
- Air quality 2/10 Low 2 unhealthy d/yr today · 2 by 30 yrs out
Nearby sold comps map
Loading sold comps map…
Walkable amenities ~0.75 mi
Loading nearby amenities…
Taxation est. · year 1
- Rental income
- $31,412
- − Mortgage interest
- −$16,805
- − Property taxes
- −$7,695
- − Insurance
- −$1,500
- − Repairs & maintenance
- −$2,513
- − Management
- −$2,513
- − HOA
- −$504
- − Depreciation
- −$8,727
- Taxable loss
- −$8,845
- Est. tax savings @ 24.0%
- +$2,123
- After-tax cash flow
- $-1,639/yr
For passive investors: Depreciation is non-cash, so a rental often shows a tax loss while cash-flowing — sheltering income. Rental losses are passive: they offset passive income freely, and up to $25,000/yr can offset ordinary (W-2) income if you actively participate and your MAGI is under $100k (phasing out to $0 by $150k); unused losses carry forward. On sale, claimed depreciation is recaptured at up to 25%, and gains may owe capital-gains tax (a 1031 exchange can defer both). Figures are a year-1 estimate at your 24.0% rate — not tax advice; consult a CPA.
Condition & rehab AI · 1 photo
This beautifully maintained single-family home in the Lantana community is in good condition with minimal updates needed to enhance its resale and rental value.
Value-add opportunities
- Both Painting the exterior and interior walls — Fresh paint enhances curb appeal and interior aesthetics.
- Both Landscaping improvements — Enhances curb appeal and can increase property value.
- Resale Upgrading the kitchen appliances — Modern appliances can attract more buyers.
- Resale Upgrading the bathrooms with modern fixtures — Modern bathrooms can attract more buyers and renters.
- Both Upgrading the HVAC system — A new HVAC system can improve comfort and energy efficiency, increasing both resale and rental value.
Renovation cost estimate screening
Value-add ROI direction
- Both Painting the exterior and interior walls — Fresh paint enhances curb appeal and interior aesthetics. ↑
- Both Landscaping improvements — Enhances curb appeal and can increase property value. ↑
- Resale Upgrading the kitchen appliances — Modern appliances can attract more buyers. ↑
- Resale Upgrading the bathrooms with modern fixtures — Modern bathrooms can attract more buyers and renters. ↑
- Both Upgrading the HVAC system — A new HVAC system can improve comfort and energy efficiency, increasing both resale and rental value. ↑
ⓘ Cost ranges are severity-bucket heuristics (US national rule-of-thumb). Get contractor quotes + a written scope before underwriting a rehab budget.
Schools (NCES district)
- District
- Cypress-Fairbanks ISD
- NCES district ID
- 4816110
- Math proficiency
- 45% ▼ -12.00%
- Reading proficiency
- 52% ▼ -2.00%
- Median HH income
- $72,025
- Composite
- 43.63/100
- National rank
- #2968
- State rank
- #161 of 826 in TX
Livability — Houston
- Score
- 74/100
- State rank
- #184
- US rank
- #4771
Category grades
Schools grade is shown separately in the Schools card above.
Census & demographics
- County
- Harris County · 4,702,590 people
- City population
- 3,226,434
- Metro
- Houston-The Woodlands-Sugar Land, TX
- Population (ZIP)
- 130,028
- Household income
- $87,808
- Rent vs Own
- Severe rent burden
- 3088.0
Population outlook (Harris County) Hauer SSP2
- Today (2025)
- 5,571,493 people
- By 2030
- 6,089,821 · +9.3%
- By 2040
- 7,142,806 · +28.2%
- By 2050
- 8,185,864 · +46.9%
- By 2075
- 10,574,329 · +89.8%
- By 2100
- 12,109,958 · +117.4%
Race, ethnicity, and origin ACS 2023
- Neighborhood character
- Diverse neighborhood (Simpson 0.68)
- Race & ethnicity
- Hispanic / Latino 49% Two or more races 22% Black 20% White 19% Asian 6%
- Hispanic origin (detail)
- Mexican 26% Puerto Rican 1% Cuban 4%
- Common ancestry
- Lithuanian 1% Italian 1%
- Foreign-born
- 32% · Canada, Jamaica, Vietnam
- Languages at home
- 48% English-only · Spanish 40% Other Indo-European 3% Vietnamese 1%
Political lean MEDSL · Harris
- 2024 margin
- Lean D (+5.5) · D 52.0% · R 46.4% · Other 1.6%
- 2008→2024 swing
- +3.9pp toward D · 2008: 1.6pp · 2024: 5.5pp
- All cycles
- 2024: D+5.5 2020: D+13.3 2016: D+12.4 2012: D+0.1 2008: D+1.6
Not yet ingested
- Civics
- —
Market trends
- HPI YoY
- ▼ -1.27%
- Current HPI
- 254.6622
- Rent YoY
- ▼ -2.86%
- Metro
- Houston-The Woodlands-Sugar Land, TX
- State GDP YoY
- ▲ 3.95%
- F500 in state
- 110
Industry mix (Fortune 500 HQ in TX)
| Industry | F500 HQs | Revenue |
|---|---|---|
| Energy | 16 | $1,198B |
|
||
| Technology | 5 | $198B |
|
||
| Engineering / Construction | 4 | $72B |
|
||
| Energy Services | 3 | $60B |
|
||
| Utilities | 3 | $41B |
|
||
| Healthcare | 2 | $330B |
|
||
Price history
-3.1% since first listed5 events — show timeline
- 2026-05-18 Listing Removed — HARMLS
- 2026-04-24 Relisted — HARMLS
- 2026-04-24 Price Changed $310,000 HARMLS
- 2026-04-20 Listing Removed — HARMLS
- 2025-11-20 Listed $320,000 HARMLS
Property tax history
+2.1%/yrLatest (2025): $7,695 · -1.6% YoY. Source: county tax records.
Cash-flow waterfall
monthlySold comps — $/sqft
last 12 mo · ≤1 miLoading sold comps…