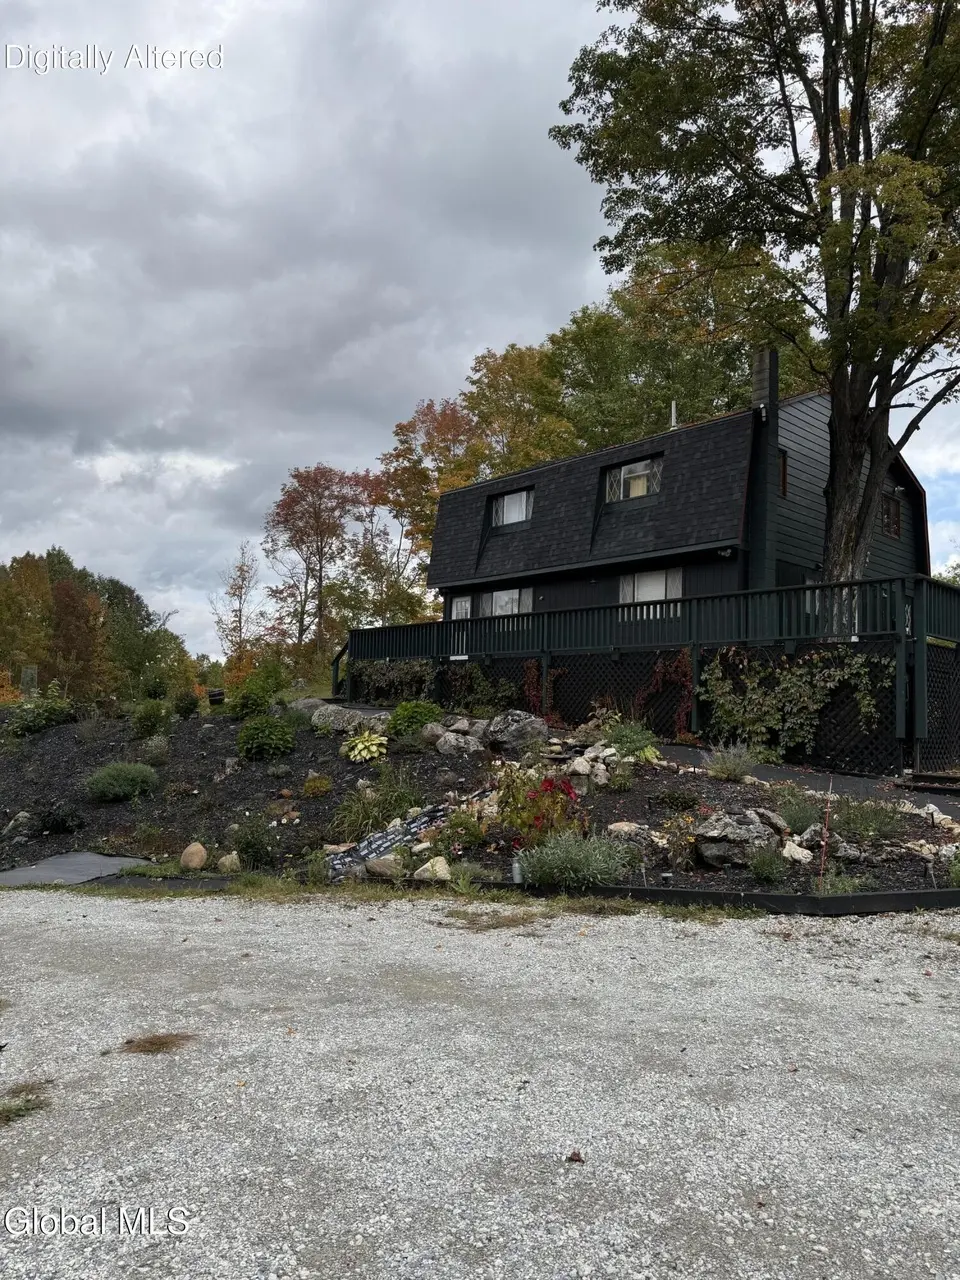
38 Henry Wescott Rd · Warrensburg, NY
Flood risk 1/10 · Minimal
- FEMA flood zone
- X
- Chance of flooding over 30 yrs
- 0.0%
- Est. flood insurance / yr
- $507 – $1,088
Fire risk 4/10 · Minor
- Est. fire insurance / yr
- $691 – $1,283
Heat risk 1/10 · Minimal
- Hot days now (above 87°F)
- 7 days/yr
- Hot days in 30 yrs
- 16 days/yr
Wind risk 2/10 · Minimal
- Chance of severe wind over 30 yrs
- 1.0%
Air-quality risk 1/10 · Minimal
- Unhealthy air days now
- 0 days/yr
- Unhealthy air days in 30 yrs
- 0 days/yr
Risk factors via First Street. Map © Google.
Why this score? — see what drove the F grade
The composite is a weighted blend of 9 inputs, each scored 0–100. Each bar is that input's sub-score; the figure is the points it added to the 100-point composite (weight × sub-score).
- Appreciation +10.0/10.0
- ARV discount +7.5/15.0
- Schools +4.1/10.0
- Livability +3.2/5.0
- Rent growth +2.5/5.0
- Condition / age +2.5/5.0
- Cash flow +0.9/30.0
- 1% rule +0.0/10.0
- DSCR +0.0/10.0
$445,000
🖨 Deal sheet 📄 Offer letter ✓ Due diligence
Listing remarks MLS
Enjoy quiet seclusion in this unique 4 BR/2.5 bath contemporary situated atop an attractively landscaped knoll covered with gorgeous perennials and young fruit trees. The interior has hardwood floors thruout, a woodburning fireplace for warmth on cool days; a large custom kitchen with first floor laundry The outside of the home will double outdoor entertaining and enjoying the views of surrounding mountains with wide terraced decks wrapping the entire house. Enjoy summer days swimming, fishing and hiking on 4000 acres of state land just 5 miles aways at little Garnet Lake and skiing and snowboarding on the state owned Gore Mountain in under 20 min.
Key facts
- 3.79 acre lot
- 8 parking spots
- Built 2020
Neighborhood map
What this means for you Summary
Snapshot
- This is a 4-bed/2.5-bath single-family listed at $445k.
Deal economics
- At list price, monthly cash flow is $-2k ($-22k/yr) — negative.
- To cash-flow at today's rent, offer at most $118k (73.5% below list).
- To meet the 1% rule (rent ≥ 1% of price), the offer needs to be $145k (67.3% below list).
- Recommended offer: $118k (73.5% below list) — sets the bar for cash-flow.
- Cap rate 1.3% vs local median 2.6% in Warrensburg — below-typical yield; the buyer is paying a premium for something (appreciation thesis, condition, location) that the cap rate doesn't capture.
Location & tenants
- Location reads 63/100 on livability (#823 in NY) — a middle-class / working-renter tenant base. Strengths: housing A+, cost of living B+, crime B; Watch: schools D, amenities F, commute F.
- Warrensburg Central School District (town): math 47% / reading 44% proficiency, ranked #552 of 755 in NY (top 73%) — families likely to look elsewhere, expect single-tenant / working-renter base with shorter leases.
- Market conditions: 49 active listings in the ZIP; 180 units permitted in Warren County in 2024 (40 in 5+ unit buildings).
Forward outlook
- In year one you build about $48k of equity ($3k loan paydown + $44k appreciation (10.0% local appreciation)).
- Warren County population projected at -19% by 2050 — secular population decline; favor cash flow + early exit over multi-decade hold.
- By year 2, paydown + projected appreciation supports a ~$76k cash-out refi (75% LTV) — recoverable capital for the next deal without selling this one.
Negotiation context
- It's been on market 64 days — a 6% lower offer ($418k) is reasonable based on typical stale-listing flexibility.
- 11 sale attempts since 7y ago with the ask held roughly flat each time — persistent listings suggest the price (not the market) is what's stuck; bring a comps-based counter.
- Current owner paid $106k; list at $445k implies a 321% gain — meaningful room to come down on a strong offer.
Questions for the listing agent
- What do current leases actually rent for vs. the listed asking? Can we see a recent rent roll and the last 12 months of T-12 income?
- It's been on market 64 days. Have you received any prior offers? Is the seller open to a 74% concession, seller financing, or rate buy-down credit?
- Why hasn't it sold? Are there any deal-killer items the seller is aware of (foundation, flood, title, zoning, code violations)?
- Is there a deadline driving the sale (1031 exchange, divorce, estate, relocation)? That informs how much negotiation room exists.
- Schools are D-rated, which usually means shorter tenancies and higher turnover. Who's the typical renter profile here, and what's been the actual vacancy rate?
- The area grade is low — what's the realistic commute time and amenity access for the typical tenant pool here? Any planned neighborhood developments (good or bad) we should know about?
- What's the average days-on-market for RENTAL listings here right now (not sales)? A rising rental-DOM trend means longer vacancies and softer asking-rent achievability than the comps imply.
- What's the recent tenant-quality profile in this submarket — average credit score on applications, eviction rate, late-payment / NSF rate, and stable-employment percentage? A property-management company in the area should have these aggregated.
- How much new for-sale + rental construction is in the pipeline within 1–3 miles? Heavy new supply typically softens prices + rents 12–24 months out; constrained supply supports both.
Investment metrics
- 1% rule
- 0.33% ✗
- Cap rate
- 1.30%
- Cash-on-cash
- -17.84%
- DSCR
- 0.21
- GRM
- 25.5
CMA / ARV
- ARV (median comp)
- $941,926
- List price
- $445,000
- Delta
- -52.76%
- Verdict
- UNDERPRICED
- Comps
- 2 within 1.0 mi
Projected returns pro-forma
10.0% appreciation · 3.0% rent growth · sell at horizon
- IRR
- 12.0%
- Equity multiple
- 2.00×
- Total profit
- $124,337
- Equity at exit
- $400,891
- IRR
- 12.6%
- Equity multiple
- 4.68×
- Total profit
- $458,897
- Equity at exit
- $864,537
Cash invested: $124,600 (down + closing). Projections, not guarantees.
Landlord ↔ Tenant lean methodology
- Overall (STATE)
- 15 Strongly Tenant-Friendly
- State New York
- 15 Strongly Tenant-Friendly · D+10
- County
- — inherits STATE
- City
- — inherits STATE
ZIP-level market 12885
- Home prices YoY
- 19.6%
- Active inventory
- 49
- Price-to-rent
- 25.5×
Monthly cashflow live
- Estimated rent
- $1,454 medium interval (Pro) →
- Mortgage (P&I)
- −$2,334
- Tax from tax record
- −$482 /mo · $5,789/yr
- Insurance
- −$185
- HOA
- −$0
- Vacancy / Maint / Mgmt
- −$305
- Net cashflow
- $-1,853
Break-even live
UW: 25.0% down · 7.5% · 30yr · 1.5% tax · 5.0% vac · 8.0% maint · 8.0% mgmt
Financing live
Cash to close
- Down payment
- $111,250
- Closing costs
- $13,350
- Reserves months
- —
- Total cash needed
- —
Loan-product check · same deal, 3 products live
Conventional
25% down · 7.5% · 30yr
- Down + closing
- —
- Monthly P&I
- —
- Monthly cashflow
- —
- DSCR
- —
- Eligible?
- —
Personal DTI + credit; lowest rate.
DSCR
20% down · 8.5% · 30yr
- Down + closing
- —
- Monthly P&I
- —
- Monthly cashflow
- —
- DSCR
- —
- Eligible?
- —
No personal income docs; deal must DSCR.
Hard money
10% down · 12.0% · 12mo
- Down + closing
- —
- Monthly P&I
- —
- Monthly cashflow
- —
- DSCR
- —
- Eligible?
- —
Short-term bridge; refi at stabilization.
Listing history 40 events
-
2026-06-18days on market $445,000 Active 64 DOM
-
2026-06-17days on market $445,000 Active 63 DOM
-
2026-06-16days on market $445,000 Active 62 DOM
-
2026-06-15days on market $445,000 Active 61 DOM
-
2026-06-13days on market $445,000 Active 59 DOM
-
2026-06-12days on market $445,000 Active 58 DOM
-
2026-06-09days on market $445,000 Active 55 DOM
-
2026-06-08days on market $445,000 Active 54 DOM
-
2026-06-07days on market $445,000 Active 53 DOM
-
2026-06-07days on market $445,000 Active 52 DOM
-
2026-06-04days on market $445,000 Active 49 DOM
-
2026-06-02days on market $445,000 Active 48 DOM
-
2026-06-01days on market $445,000 Active 47 DOM
-
2026-05-31days on market $445,000 Active 46 DOM
-
2026-04-15$445,000 Active 659-char remark
Show marketing remark (659 chars)
Enjoy quiet seclusion in this unique 4 BR/2.5 bath contemporary situated atop an attractively landscaped knoll covered with gorgeous perennials and young fruit trees. The interior has hardwood floors thruout, a woodburning fireplace for warmth on cool days; a large custom kitchen with first floor laundry The outside of the home will double outdoor entertaining and enjoying the views of surrounding mountains with wide terraced decks wrapping the entire house. Enjoy summer days swimming, fishing and hiking on 4000 acres of state land just 5 miles aways at little Garnet Lake and skiing and snowboarding on the state owned Gore Mountain in under 20 min.
-
2024-09-30historical
-
2024-08-02price $465,000
-
2024-05-16status Active
-
2024-05-14historical
-
2024-02-13$475,000 Active
-
2023-11-24historical
-
2023-07-18$499,000 Active
-
2023-06-08historical
-
2023-02-07$499,000 Active
-
2022-10-15historical
-
2022-06-16$515,000 Active
-
2022-06-15historical
-
2022-04-16$485,000 Active
-
2021-12-01historical
-
2021-05-14$220,000 New
-
2021-04-30soldstatus $105,658
-
2020-08-18historical
-
2020-06-17$199,900 New
-
2020-06-08historical
-
2020-03-04status Pend (Under Cntr)
-
2019-12-30price $115,000
-
2019-12-12status Back On Market
-
2019-12-01historical
-
2019-08-09$120,000 Price Change
-
2000-09-08soldstatus $88,600
ⓘ Source: listings_history table (triggers on properties + properties_extension) + one-shot
backfill from property_details.listing_events for pre-trigger history.
Tax reassessment forecast NY · Partial reset (capped growth)
- Current annual tax
- $5,789 · $482/mo
- Projected year-2 tax
- $6,655 · $555/mo
- Expected delta
- +$866/yr (+$72/mo · 15.0%)
ⓘ Screening estimate from a state-policy table — verify with the county assessor before closing.
Climate risk First Street
- Flood 1/10 Low FEMA zone X · 0% chance over 30 yrs
- Wildfire 4/10 Moderate
- Heat 1/10 Low 7 d/yr ≥87°F today · 16 d/yr by 30 yrs out
- Wind 2/10 Low 100% chance of damaging wind over 30 yrs
- Air quality 1/10 Low 0 unhealthy d/yr today · 0 by 30 yrs out
Nearby sold comps map
Loading sold comps map…
Walkable amenities ~0.75 mi
Loading nearby amenities…
Taxation est. · year 1
- Rental income
- $17,450
- − Mortgage interest
- −$24,927
- − Property taxes
- −$5,789
- − Insurance
- −$2,225
- − Repairs & maintenance
- −$1,396
- − Management
- −$1,396
- − Depreciation
- −$12,945
- Taxable loss
- −$31,229
- Est. tax savings @ 24.0%
- +$7,495
- After-tax cash flow
- $-14,737/yr
For passive investors: Depreciation is non-cash, so a rental often shows a tax loss while cash-flowing — sheltering income. Rental losses are passive: they offset passive income freely, and up to $25,000/yr can offset ordinary (W-2) income if you actively participate and your MAGI is under $100k (phasing out to $0 by $150k); unused losses carry forward. On sale, claimed depreciation is recaptured at up to 25%, and gains may owe capital-gains tax (a 1031 exchange can defer both). Figures are a year-1 estimate at your 24.0% rate — not tax advice; consult a CPA.
Schools (NCES district)
- District
- Warrensburg Central School District
- NCES district ID
- 3629910
- Math proficiency
- 47% ▲ 4.00%
- Reading proficiency
- 44% ▼ -2.00%
- Median HH income
- $48,828
- Composite
- 41.15/100
- National rank
- #7424
- State rank
- #552 of 755 in NY
Livability — Warrensburg
- Score
- 63/100
- State rank
- #823
- US rank
- #15925
Category grades
Schools grade is shown separately in the Schools card above.
Census & demographics
- Population (ZIP)
- 4,531
Population outlook (Warren County) Hauer SSP2
- Today (2025)
- 62,372 people
- By 2030
- 60,491 · -3.0%
- By 2040
- 55,616 · -10.8%
- By 2050
- 50,437 · -19.1%
- By 2075
- 40,843 · -34.5%
- By 2100
- 31,159 · -50.0%
Race, ethnicity, and origin ACS 2023
- Neighborhood character
- Predominantly White (89%)
- Race & ethnicity
- White 89% Two or more races 5% Asian 3% Hispanic / Latino 3%
- Common ancestry
- Lithuanian 4% Portuguese 2% Slovak 2%
- Foreign-born
- 4% · Canada
- Languages at home
- 96% English-only · Other Indo-European 2% Tagalog/Filipino 1%
Political lean MEDSL · Warren
- 2024 margin
- Toss-up / Even · D 47.9% · R 52.1%
- 2008→2024 swing
- -6.9pp toward R · 2008: 2.6pp · 2024: -4.2pp
- All cycles
- 2024: R+4.2 2020: R+0.2 2016: R+10.6 2012: D+2.1 2008: D+2.6
Not yet ingested
- Civics
- —
Market trends
- HPI YoY
- ▲ 60.30%
- Current HPI
- 368.3803
- Rent YoY
- —
- Metro
- —
- State GDP YoY
- ▲ 2.60%
- F500 in state
- 92
Industry mix (Fortune 500 HQ in NY)
| Industry | F500 HQs | Revenue |
|---|---|---|
| Financial Services | 10 | $950B |
|
||
| Consumer Goods | 9 | $162B |
|
||
| Insurance | 4 | $225B |
|
||
| Telecommunications | 2 | $144B |
|
||
| Pharmaceuticals | 2 | $112B |
|
||
| Media / Entertainment | 2 | $69B |
|
||
Price history
+402.3% since first listed26 events — show timeline
- 2026-04-15 Listed $445,000 Global MLS
- 2024-09-30 Listing Removed — Global MLS
- 2024-08-02 Price Changed $465,000 Global MLS
- 2024-05-16 Relisted — Global MLS
- 2024-05-14 Listing Removed — Global MLS
- 2024-02-13 Listed $475,000 Global MLS
- 2023-11-24 Listing Removed — Global MLS
- 2023-07-18 Listed $499,000 Global MLS
- 2023-06-08 Listing Removed — Global MLS
- 2023-02-07 Listed $499,000 Global MLS
- 2022-10-15 Listing Removed — Global MLS
- 2022-06-16 Listed $515,000 Global MLS
- 2022-06-15 Listing Removed — Global MLS
- 2022-04-16 Listed $485,000 Global MLS
- 2021-12-01 Listing Removed — Global MLS
- 2021-05-14 Listed $220,000 Global MLS
- 2021-04-30 Sold (Public Records) $105,658 Public Records
- 2020-08-18 Listing Removed — Global MLS
- 2020-06-17 Listed $199,900 Global MLS
- 2020-06-08 Listing Removed — Global MLS
- 2020-03-04 Pending — Global MLS
- 2019-12-30 Price Changed $115,000 Global MLS
- 2019-12-12 Relisted — Global MLS
- 2019-12-01 Listing Removed — Global MLS
- 2019-08-09 Listed $120,000 Global MLS
- 2000-09-08 Sold (Public Records) $88,600 Public Records
Property tax history
+10.6%/yrLatest (2025): $5,789 · +4.8% YoY. Source: county tax records.
Cash-flow waterfall
monthlySold comps — $/sqft
last 12 mo · ≤1 miLoading sold comps…