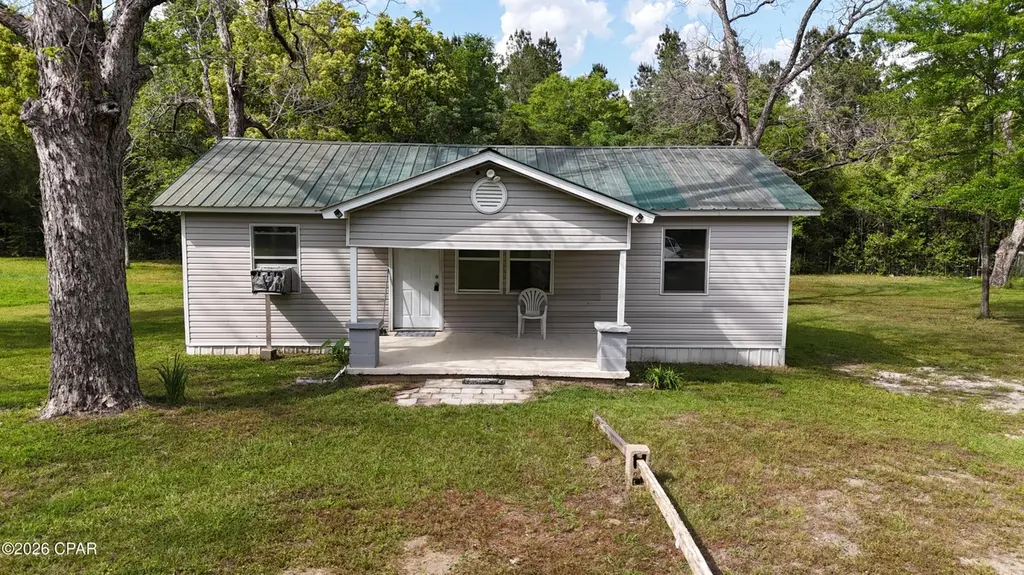
402 Hatcher Dr · Bonifay, FL
Flood risk 1/10 · Minimal
- FEMA flood zone
- X (unshaded)
- Chance of flooding over 30 yrs
- 0.0%
- Est. flood insurance / yr
- $507 – $1,088
Fire risk 5/10 · Moderate
- Est. fire insurance / yr
- $947 – $1,759
Heat risk 8/10 · Major
- Hot days now (above 107°F)
- 7 days/yr
- Hot days in 30 yrs
- 18 days/yr
Wind risk 9/10 · Severe
- Chance of severe wind over 30 yrs
- 99.0%
Air-quality risk 2/10 · Minimal
- Unhealthy air days now
- 1 days/yr
- Unhealthy air days in 30 yrs
- 1 days/yr
Risk factors via First Street. Map © Google.
Why this score? — see what drove the B+ grade
The composite is a weighted blend of 9 inputs, each scored 0–100. Each bar is that input's sub-score; the figure is the points it added to the 100-point composite (weight × sub-score).
- Cash flow +30.0/30.0
- DSCR +10.0/10.0
- Appreciation +10.0/10.0
- 1% rule +9.0/10.0
- ARV discount +7.5/15.0
- Condition / age +3.8/5.0
- Schools +3.7/10.0
- Livability +3.4/5.0
- Rent growth +2.5/5.0
$82,000
🖨 Deal sheet 📄 Offer letter ✓ Due diligence
Listing remarks
This charming remodeled older home offers the perfect blend of character and modern comfort! With three spacious bedrooms and a versatile large bonus room, there's ample space for your family's needs or the potential to create your dream home office or playroom. The covered porch invites you to relax outdoors, while the good-sized living room and separate dining room provide an ideal setting for gatherings and entertaining. The kitchen boasts a handy pantry, making meal prep a breeze. With plenty of room to plant a garden, you can enjoy the beauty of nature right in your backyard. . Don't forget the outbuildings, which offer additional storage or workshop possibilities. This property is a w
Key facts
- Covered porch
- Handy pantry
- Outbuildings
Tags
Property features AI
Exterior
- Utilities: Public road maintenance (city); Lot approximately 1 acre
- Home design: Single-family residence zoning; Irregular lot shape; City street frontage; Publicly maintained road
- Construction: Vinyl siding and wood frame construction; Metal roof
- Exterior features: Deck; Covered porch; Outbuilding/shed; Partial fencing; Above-ground pool
Interior
- Kitchen: Kitchen on the first floor
- Bedrooms: Bedrooms located on the first floor (multiple bedrooms)
- Bathrooms: 1 full bathroom
- Heating & cooling: Electric heating; Window air conditioning units
- Interior features: Bonus room; Dining room; Living room; Porch
- Laundry & utility: Electric water heater
Neighborhood map
What this means for you Summary
Snapshot
- This is a 3-bed/1.0-bath single-family listed at $82k. Condition is rated good.
Deal economics
- At list price, monthly cash flow is $343 ($4k/yr) — positive.
- The deal already cash-flows at list — no discount required.
- Meets the 1% rule at list price ($1k rent vs $82k).
- Recommended offer: $77k (6.0% below list) — sets the bar for market timing.
- Cap rate 11.3% vs local median 3.8% in Bonifay — top-decile yield for the area; either an underpriced asset or a hidden risk that comps aren't pricing in. Stress-test before assuming the spread holds.
Location & tenants
- Location reads 67/100 on livability (#577 in FL) — a middle-class / working-renter tenant base. Strengths: crime A+, cost of living A+, housing A+; Watch: schools D, amenities F, commute F.
- Holmes (rural): math 44% / reading 45% proficiency, ranked #53 of 73 in FL (top 73%) — families likely to look elsewhere, expect single-tenant / working-renter base with shorter leases.
- Market conditions: 141 active listings in the ZIP; 12 units permitted in Holmes County in 2024 (0 in 5+ unit buildings).
Forward outlook
- In year one you build about $9k of equity ($567 loan paydown + $8k appreciation (10.0% local appreciation)).
- Holmes County population projected at -17% by 2050 — secular population decline; favor cash flow + early exit over multi-decade hold.
- At projected returns (10.0% appreciation + 3.0% rent growth), your $23k cash investment doubles in ~2 years — after that, you're playing with house money.
- By year 4, paydown + projected appreciation supports a ~$31k cash-out refi (75% LTV) — recoverable capital for the next deal without selling this one.
Negotiation context
- It's been on market 73 days — a 6% lower offer ($77k) is reasonable based on typical stale-listing flexibility.
- 6 sale attempts; this cycle's ask has dropped $8k (9%) from the opening price — seller is motivated, your offer sets the floor, not the list.
Risks & watch-outs
- Watch-outs: built in 1947 — expect roof / HVAC / electrical / plumbing capex.
- Climate carrying-cost: severe wind risk, 99% chance of damaging wind over 30y; moderate wildfire risk; extreme-heat days projected 7→18/yr by 2055 (HVAC capex compounding) — expect insurance premiums to compound above CPI over the hold.
Questions for the listing agent
- It's been on market 73 days. Have you received any prior offers? Is the seller open to a 6% concession, seller financing, or rate buy-down credit?
- Built in 1947 — when were the roof, HVAC, electrical panel, plumbing, and water heater last replaced?
- Why hasn't it sold? Are there any deal-killer items the seller is aware of (foundation, flood, title, zoning, code violations)?
- Is there a deadline driving the sale (1031 exchange, divorce, estate, relocation)? That informs how much negotiation room exists.
- Schools are D-rated, which usually means shorter tenancies and higher turnover. Who's the typical renter profile here, and what's been the actual vacancy rate?
- What's the average days-on-market for RENTAL listings here right now (not sales)? A rising rental-DOM trend means longer vacancies and softer asking-rent achievability than the comps imply.
- What's the recent tenant-quality profile in this submarket — average credit score on applications, eviction rate, late-payment / NSF rate, and stable-employment percentage? A property-management company in the area should have these aggregated.
- How much new for-sale + rental construction is in the pipeline within 1–3 miles? Heavy new supply typically softens prices + rents 12–24 months out; constrained supply supports both.
Investment metrics
- 1% rule
- 1.40% ✓
- Cap rate
- 11.31%
- Cash-on-cash
- 17.91%
- DSCR
- 1.80
- GRM
- 5.9
CMA / ARV
- ARV (on-the-fly)
- $196,716
- Comps found
- 5
Show comp detail 5 sales within ~0.75 mi
| Address | Dist | Beds/Ba | Sqft | Sold | Price | $/sf | Match |
|---|---|---|---|---|---|---|---|
| 603 W Kansas Ave | 0.34mi | 2/1.0 (-1) | 1,100 (-6%) | 6mo | $125,000 | $114 | 65 |
| 711 N Cotton St | 0.46mi | 3/1.0 | 1,000 (-14%) | 2mo | $133,000 | $133 | 53 |
| 900 N Tracy St | 0.71mi | 3/2.0 | 1,209 (+4%) | 8mo | $204,000 | $169 | 49 |
| 904 N Tracy St | 0.72mi | 3/2.0 | 1,209 (+4%) | 9mo | $204,900 | $169 | 48 |
| 908 N Tracy St | 0.72mi | 3/2.0 | 1,209 (+4%) | 10mo | $204,000 | $169 | 47 |
Match score weights: distance 35% · size 25% · config 20% · recency 20%. Top-matched comps best support the ARV.
Projected returns pro-forma
10.0% appreciation · 3.0% rent growth · sell at horizon
- IRR
- 37.6%
- Equity multiple
- 3.90×
- Total profit
- $66,499
- Equity at exit
- $73,872
- IRR
- 32.4%
- Equity multiple
- 8.78×
- Total profit
- $178,702
- Equity at exit
- $159,308
Cash invested: $22,960 (down + closing). Projections, not guarantees.
Landlord ↔ Tenant lean methodology
- Overall (STATE)
- 87 Strongly Landlord-Friendly
- State Florida
- 87 Strongly Landlord-Friendly · R+3
- County
- — inherits STATE
- City
- — inherits STATE
ZIP-level market 32425
- Home prices YoY
- 16.2%
- Active inventory
- 141
- Price-to-rent
- 5.9×
Monthly cashflow live
- Estimated rent
- $1,151 medium interval (Pro) →
- Mortgage (P&I)
- −$430
- Tax est. 1.5%
- −$102 /mo · $1,230/yr
- Insurance
- −$34
- HOA
- −$0
- Vacancy / Maint / Mgmt
- −$242
- Net cashflow
- $343
Break-even live
Sensitivity live
| Price | -10% $399 | -5% $371 | +0% $343 | +5% $314 | +10% $286 |
|---|---|---|---|---|---|
| Rent | -10% $252 | -5% $297 | +0% $343 | +5% $388 | +10% $434 |
| Rate | -1.0pp $384 | -0.5pp $363 | base $343 | +0.5pp $321 | +1.0pp $300 |
UW: 25.0% down · 7.5% · 30yr · 1.5% tax · 5.0% vac · 8.0% maint · 8.0% mgmt
Financing live
Cash to close
- Down payment
- $20,500
- Closing costs
- $2,460
- Reserves months
- —
- Total cash needed
- —
Loan-product check · same deal, 3 products live
Conventional
25% down · 7.5% · 30yr
- Down + closing
- —
- Monthly P&I
- —
- Monthly cashflow
- —
- DSCR
- —
- Eligible?
- —
Personal DTI + credit; lowest rate.
DSCR
20% down · 8.5% · 30yr
- Down + closing
- —
- Monthly P&I
- —
- Monthly cashflow
- —
- DSCR
- —
- Eligible?
- —
No personal income docs; deal must DSCR.
Hard money
10% down · 12.0% · 12mo
- Down + closing
- —
- Monthly P&I
- —
- Monthly cashflow
- —
- DSCR
- —
- Eligible?
- —
Short-term bridge; refi at stabilization.
Listing history 28 events
-
2026-06-18days on market $82,000 Active 73 DOM
-
2026-06-17days on market $82,000 Active 72 DOM
-
2026-06-16days on market $82,000 Active 71 DOM
-
2026-06-15days on market $82,000 Active 70 DOM
-
2026-06-14days on market $82,000 Active 68 DOM
-
2026-06-13days on market $82,000 Active 67 DOM
-
2026-06-10days on market $82,000 Active 65 DOM
-
2026-06-09days on market $82,000 Active 64 DOM
-
2026-06-08days on market $82,000 Active 63 DOM
-
2026-06-07days on market $82,000 Active 62 DOM
-
2026-06-05days on market $82,000 Active 59 DOM
-
2026-06-02days on market $82,000 Active 57 DOM
-
2026-06-01days on market $82,000 Active 56 DOM
-
2026-05-31days on market $82,000 Active 55 DOM
-
2026-05-30days on market $82,000 Active 54 DOM
-
2026-05-19price $82,000
-
2026-04-14status Active
-
2026-04-09historical Active Under Contract
-
2026-04-01$89,900 Active
-
2026-01-31status Active
-
2026-01-16status Pending
-
2025-08-11status Active
-
2025-07-30historical Active Under Contract
-
2025-07-30status Pending
-
2025-07-11status Active
-
2025-06-09status Pending
-
2025-05-21price $99,000
-
2025-01-16$110,000 Active
ⓘ Source: listings_history table (triggers on properties + properties_extension) + one-shot
backfill from property_details.listing_events for pre-trigger history.
Climate risk First Street
- Flood 1/10 Low FEMA zone X (unshaded) · 0% chance over 30 yrs
- Wildfire 5/10 Major
- Heat 8/10 Severe 7 d/yr ≥107°F today · 18 d/yr by 30 yrs out
- Wind 9/10 Extreme 99% chance of damaging wind over 30 yrs
- Air quality 2/10 Low 1 unhealthy d/yr today · 1 by 30 yrs out
Nearby sold comps map
Loading sold comps map…
Walkable amenities ~0.75 mi
Loading nearby amenities…
Taxation est. · year 1
- Rental income
- $13,812
- − Mortgage interest
- −$4,593
- − Property taxes
- −$1,230
- − Insurance
- −$410
- − Repairs & maintenance
- −$1,105
- − Management
- −$1,105
- − Depreciation
- −$2,385
- Taxable income
- $2,984
- Est. tax owed @ 24.0%
- −$716
- After-tax cash flow
- $3,395/yr
For passive investors: Depreciation is non-cash, so a rental often shows a tax loss while cash-flowing — sheltering income. Rental losses are passive: they offset passive income freely, and up to $25,000/yr can offset ordinary (W-2) income if you actively participate and your MAGI is under $100k (phasing out to $0 by $150k); unused losses carry forward. On sale, claimed depreciation is recaptured at up to 25%, and gains may owe capital-gains tax (a 1031 exchange can defer both). Figures are a year-1 estimate at your 24.0% rate — not tax advice; consult a CPA.
Condition & rehab AI · 12 photos
This charming remodeled older home offers a good condition with minimal repairs needed. It's move-in ready with a good curb appeal and ample space for a family or rental.
Value-add opportunities
- Resale Paint exterior siding — Enhances curb appeal and value
- Rental Clean gutters — Keeps property in good condition and reduces maintenance costs
Renovation cost estimate screening
Value-add ROI direction
- Resale Paint exterior siding — Enhances curb appeal and value ↑
- Rental Clean gutters — Keeps property in good condition and reduces maintenance costs ↑
ⓘ Cost ranges are severity-bucket heuristics (US national rule-of-thumb). Get contractor quotes + a written scope before underwriting a rehab budget.
Schools (NCES district)
- District
- Holmes
- NCES district ID
- 1200900
- Math proficiency
- 44% ▼ -5.00%
- Reading proficiency
- 45% ▼ -7.00%
- Median HH income
- $35,365
- Composite
- 36.83/100
- National rank
- #4558
- State rank
- #53 of 73 in FL
Livability — Bonifay
- Score
- 67/100
- State rank
- #577
- US rank
- #10976
Category grades
Schools grade is shown separately in the Schools card above.
Census & demographics
- Census place
- Bonifay, FL
- Population (ZIP)
- 13,944
Population outlook (Holmes County) Hauer SSP2
- Today (2025)
- 17,963 people
- By 2030
- 17,245 · -4.0%
- By 2040
- 15,970 · -11.1%
- By 2050
- 14,905 · -17.0%
- By 2075
- 12,327 · -31.4%
- By 2100
- 9,760 · -45.7%
Race, ethnicity, and origin ACS 2023
- Neighborhood character
- Predominantly White (81%)
- Race & ethnicity
- White 81% Black 9% Two or more races 6% Hispanic / Latino 4%
- Common ancestry
- Slovak 1% Iranian 1% Lithuanian 1%
- Foreign-born
- 2% · Canada
- Languages at home
- 94% English-only · Spanish 4% Russian/Polish/Slavic 1% French/Haitian/Cajun 1%
Political lean MEDSL · Holmes
- 2024 margin
- Solid R (+80.2) · D 9.7% · R 89.9%
- 2008→2024 swing
- -15.1pp toward R · 2008: -65.0pp · 2024: -80.2pp
- All cycles
- 2024: R+80.2 2020: R+78.9 2016: R+77.9 2012: R+68.3 2008: R+65.0
Not yet ingested
- Civics
- —
Market trends
- HPI YoY
- ▲ 44.87%
- Current HPI
- 322.29
- Rent YoY
- —
- Metro
- —
- State GDP YoY
- ▲ 3.28%
- F500 in state
- 36
Industry mix (Fortune 500 HQ in FL)
| Industry | F500 HQs | Revenue |
|---|---|---|
| Industrial Technology | 2 | $29B |
|
||
| Insurance | 2 | $17B |
|
||
| Retail | 1 | $60B |
|
||
| Technology Distribution | 1 | $58B |
|
||
| Homebuilding | 1 | $35B |
|
||
| Technology Manufacturing | 1 | $35B |
|
||
Price history
-25.5% since first listed13 events — show timeline
- 2026-05-19 Price Changed $82,000 CPARMLS
- 2026-04-14 Relisted — CPARMLS
- 2026-04-09 Contingent — CPARMLS
- 2026-04-01 Listed $89,900 CPARMLS
- 2026-01-31 Relisted — CPARMLS
- 2026-01-16 Pending — CPARMLS
- 2025-08-11 Relisted — CPARMLS
- 2025-07-30 Contingent — CPARMLS
- 2025-07-30 Pending — CPARMLS
- 2025-07-11 Relisted — CPARMLS
- 2025-06-09 Pending — CPARMLS
- 2025-05-21 Price Changed $99,000 CPARMLS
- 2025-01-16 Listed $110,000 CPARMLS
Cash-flow waterfall
monthlySold comps — $/sqft
last 12 mo · ≤1 miLoading sold comps…