730 Ticky Fork Rd · Ravenna, KY
Flood risk 9/10 · Severe
- FEMA flood zone
- X (unshaded)
- Chance of flooding over 30 yrs
- 0.99%
- Est. flood insurance / yr
- $507 – $1,088
Fire risk 7/10 · Major
- Est. fire insurance / yr
- $839 – $1,559
Heat risk 5/10 · Moderate
- Hot days now (above 101°F)
- 7 days/yr
- Hot days in 30 yrs
- 21 days/yr
Wind risk 3/10 · Minor
- Chance of severe wind over 30 yrs
- 5.0%
Air-quality risk 1/10 · Minimal
- Unhealthy air days now
- 0 days/yr
- Unhealthy air days in 30 yrs
- 0 days/yr
Risk factors via First Street. Map © Google.
Why this score? — see what drove the C grade
The composite is a weighted blend of 9 inputs, each scored 0–100. Each bar is that input's sub-score; the figure is the points it added to the 100-point composite (weight × sub-score).
- Cash flow +21.7/30.0
- ARV discount +7.5/15.0
- DSCR +6.9/10.0
- 1% rule +4.5/10.0
- Appreciation +3.9/10.0
- Livability +3.4/5.0
- Rent growth +2.5/5.0
- Condition / age +2.5/5.0
- Schools +2.1/10.0
$125,000
🖨 Deal sheet 📄 Offer letter ✓ Due diligence
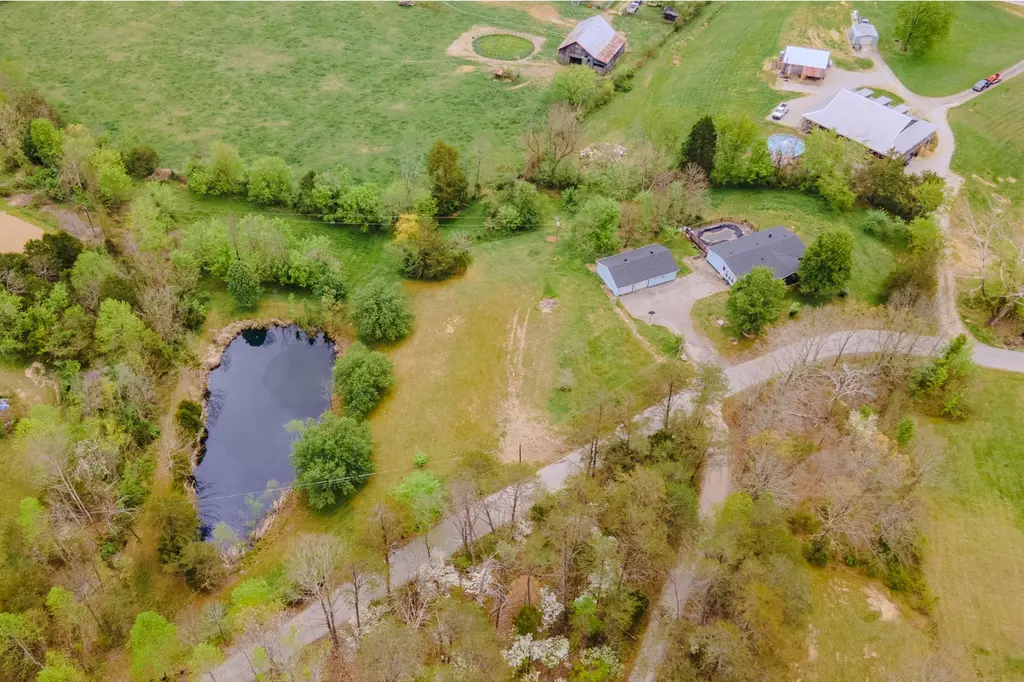
Listing remarks
Auction Cancelled Under Contract. Peaceful country living awaits in Ravenna! This three-bedroom, two-bath manufactured home offers the perfect blend of comfort and space, featuring a scenic private pond on about 3 acres. Enjoy warm summer days with an above-ground pool and take advantage of the detached garage for additional storage or workspace. This property delivers the privacy and tranquility of country life while still being within reach of nearby conveniences. The Real Estate will be sold Onsite and Online. The contents will be sold Onsite only. We will be selling by the deed. Sale terms: If you bid online you must submit a letter of good standing from your bank at least 24 hours prio
Key facts
- Country living
- Private pond
- Above-ground pool
Tags
Property features AI
Exterior
- Parking: Detached garage; Property has a garage
- Utilities: Public water; Septic tank
- Home design: One-level home
- Construction: Vinyl siding; Foundation: Other; Total building area: 1,568
- Exterior features: Above-ground pool; Property on waterfront (water body: Other)
Interior
- Bedrooms: 2 bedrooms
- Flooring: Carpet
- Bathrooms: 2 full bathrooms
- Heating & cooling: Heating present (type: Other); Cooling present (type: Other)
- Interior features: Carpet flooring; Fireplace
Neighborhood map
What this means for you Summary
Snapshot
- This is a 3-bed/2.0-bath manufactured listed at $125k.
Deal economics
- At list price, monthly cash flow is $126 ($2k/yr) — positive.
- The deal already cash-flows at list — no discount required.
- To meet the 1% rule (rent ≥ 1% of price), the offer needs to be $118k (5.2% below list).
- Recommended offer: $118k (5.2% below list) — sets the bar for 1% rule.
Location & tenants
- Location reads 67/100 on livability (#210 in KY) — a middle-class / working-renter tenant base. Strengths: crime A+, cost of living A+, housing A+; Watch: amenities F, commute F, employment F.
- Estill County (rural): math 19% / reading 33% proficiency, ranked #146 of 165 in KY (top 88%) — low school quality limits family demand, transient renter base, plan for 1-2y turnover.
- Zoned schools: Estill Springs Elementary (465 students, 70% FRL); Estill County Middle School (math 17% / reading 34%, grade F, #181 of 217 statewide, top 84%, 446 students, 70% FRL); Estill County High School (math 22% / reading 37%, grade F, #127 of 254 statewide, top 58%, 644 students, 61% FRL).
- Market conditions: 8 active listings in the ZIP.
Forward outlook
- Local home prices are declining (-2.1%/yr); year-one equity from $864 of loan paydown is wiped out by about $3k of value loss. Plan a longer hold.
- Estill County population projected at -20% by 2050 — secular population decline; favor cash flow + early exit over multi-decade hold.
Negotiation context
- Only 13 days on market — expect competitive offers; lowballing is unlikely to land.
- Current owner paid $89k; 40% above their basis — modest negotiation headroom, anchor on the comps not their cost.
Risks & watch-outs
- Watch-outs: flood insurance adds $66/mo.
- Climate carrying-cost: severe flood risk; major wildfire risk; extreme-heat days projected 7→21/yr by 2055 (HVAC capex compounding) — expect insurance premiums to compound above CPI over the hold.
Questions for the listing agent
- What's the actual annual flood-insurance premium (NFIP or private), and is the property in a SFHA with mandatory coverage?
- Is there a deadline driving the sale (1031 exchange, divorce, estate, relocation)? That informs how much negotiation room exists.
- Schools are F-rated, which usually means shorter tenancies and higher turnover. Who's the typical renter profile here, and what's been the actual vacancy rate?
- What's the average days-on-market for RENTAL listings here right now (not sales)? A rising rental-DOM trend means longer vacancies and softer asking-rent achievability than the comps imply.
- What's the recent tenant-quality profile in this submarket — average credit score on applications, eviction rate, late-payment / NSF rate, and stable-employment percentage? A property-management company in the area should have these aggregated.
- How much new for-sale + rental construction is in the pipeline within 1–3 miles? Heavy new supply typically softens prices + rents 12–24 months out; constrained supply supports both.
Investment metrics
- 1% rule
- 0.95% ✗
- Cap rate
- 8.14%
- Cash-on-cash
- 6.61%
- DSCR
- 1.29
- GRM
- 8.8
CMA / ARV
No comps found within radius.
Projected returns pro-forma
-2.13% appreciation · 3.0% rent growth · sell at horizon
- IRR
- -5.4%
- Equity multiple
- 0.78×
- Total profit
- $-7,596
- Equity at exit
- $23,555
- IRR
- 2.7%
- Equity multiple
- 1.22×
- Total profit
- $7,787
- Equity at exit
- $19,447
Cash invested: $35,000 (down + closing). Projections, not guarantees.
Landlord ↔ Tenant lean methodology
- Overall (STATE)
- 83 Strongly Landlord-Friendly
- State Kentucky
- 83 Strongly Landlord-Friendly · R+16
- County
- — inherits STATE
- City
- — inherits STATE
ZIP-level market 40472
- Home prices YoY
- -1.0%
- Active inventory
- 8
- Price-to-rent
- 8.8×
Monthly cashflow live
- Estimated rent
- $1,184 medium interval (Pro) →
- Mortgage (P&I)
- −$656
- Tax from tax record
- −$35 /mo · $423/yr
- Insurance
- −$52
- Flood insurance flood zone
- −$66 /mo · $798/yr
- HOA
- −$0
- Vacancy / Maint / Mgmt
- −$249
- Net cashflow
- $126
Break-even live
UW: 25.0% down · 7.5% · 30yr · 1.5% tax · 5.0% vac · 8.0% maint · 8.0% mgmt
Financing live
Cash to close
- Down payment
- $31,250
- Closing costs
- $3,750
- Reserves months
- —
- Total cash needed
- —
Loan-product check · same deal, 3 products live
Conventional
25% down · 7.5% · 30yr
- Down + closing
- —
- Monthly P&I
- —
- Monthly cashflow
- —
- DSCR
- —
- Eligible?
- —
Personal DTI + credit; lowest rate.
DSCR
20% down · 8.5% · 30yr
- Down + closing
- —
- Monthly P&I
- —
- Monthly cashflow
- —
- DSCR
- —
- Eligible?
- —
No personal income docs; deal must DSCR.
Hard money
10% down · 12.0% · 12mo
- Down + closing
- —
- Monthly P&I
- —
- Monthly cashflow
- —
- DSCR
- —
- Eligible?
- —
Short-term bridge; refi at stabilization.
Listing history 2 events
-
2026-05-07$125,000 Active 814-char remark
-
2005-07-01soldstatus $89,200
ⓘ Source: listings_history table (triggers on properties + properties_extension) + one-shot
backfill from property_details.listing_events for pre-trigger history.
Tax reassessment forecast KY · Resets to sale price
- Current annual tax
- $423 · $35/mo
- Projected year-2 tax
- $1,075 · $90/mo
- Expected delta
- +$652/yr (+$54/mo · 154.3%)
ⓘ Screening estimate from a state-policy table — verify with the county assessor before closing.
Climate risk First Street
- Flood 9/10 Extreme FEMA zone X (unshaded) · 99% chance over 30 yrs
- Wildfire 7/10 Severe
- Heat 5/10 Major 7 d/yr ≥101°F today · 21 d/yr by 30 yrs out
- Wind 3/10 Moderate 5% chance of damaging wind over 30 yrs
- Air quality 1/10 Low 0 unhealthy d/yr today · 0 by 30 yrs out
Nearby sold comps map
Loading sold comps map…
Walkable amenities ~0.75 mi
Loading nearby amenities…
Taxation est. · year 1
- Rental income
- $14,213
- − Mortgage interest
- −$7,002
- − Property taxes
- −$423
- − Insurance
- −$1,422
- − Repairs & maintenance
- −$1,137
- − Management
- −$1,137
- − Depreciation
- −$3,636
- Taxable loss
- −$544
- Est. tax savings @ 24.0%
- +$131
- After-tax cash flow
- $1,648/yr
For passive investors: Depreciation is non-cash, so a rental often shows a tax loss while cash-flowing — sheltering income. Rental losses are passive: they offset passive income freely, and up to $25,000/yr can offset ordinary (W-2) income if you actively participate and your MAGI is under $100k (phasing out to $0 by $150k); unused losses carry forward. On sale, claimed depreciation is recaptured at up to 25%, and gains may owe capital-gains tax (a 1031 exchange can defer both). Figures are a year-1 estimate at your 24.0% rate — not tax advice; consult a CPA.
Schools (NCES district)
- District
- Estill County
- NCES district ID
- 2101760
- Math proficiency
- 19% ▼ -24.00%
- Reading proficiency
- 33% ▼ -13.00%
- Median HH income
- $29,324
- Composite
- 20.86/100
- National rank
- #8498
- State rank
- #146 of 165 in KY
Livability — Ravenna
- Score
- 67/100
- State rank
- #210
- US rank
- #10283
Category grades
Schools grade is shown separately in the Schools card above.
Census & demographics
- Population (ZIP)
- 1,398
Population outlook (Estill County) Hauer SSP2
- Today (2025)
- 13,588 people
- By 2030
- 13,086 · -3.7%
- By 2040
- 12,012 · -11.6%
- By 2050
- 10,928 · -19.6%
- By 2075
- 8,646 · -36.4%
- By 2100
- 6,689 · -50.8%
Race, ethnicity, and origin ACS 2023
- Neighborhood character
- Predominantly White (100%)
- Race & ethnicity
- White 100%
- Common ancestry
- Slovak 2% Italian 1% Serbian 1%
Political lean MEDSL · Estill
- 2024 margin
- Solid R (+63.2) · D 17.7% · R 81.0% · Other 1.3%
- 2008→2024 swing
- -23.1pp toward R · 2008: -40.1pp · 2024: -63.2pp
- All cycles
- 2024: R+63.2 2020: R+57.3 2016: R+56.5 2012: R+46.2 2008: R+40.1
Not yet ingested
- Civics
- —
Market trends
- HPI YoY
- ▼ -2.13%
- Current HPI
- 207.4411
- Rent YoY
- —
- Metro
- —
- State GDP YoY
- ▲ 1.81%
- F500 in state
- 4
Industry mix (Fortune 500 HQ in KY)
| Industry | F500 HQs | Revenue |
|---|---|---|
| Healthcare | 1 | $118B |
|
||
| Food / Beverage | 1 | $7B |
|
||
Price history
+40.1% since first listed3 events — show timeline
- 2026-05-20 Pending — ImagineMLS
- 2026-05-07 Listed $125,000 ImagineMLS
- 2005-07-01 Sold (Public Records) $89,200 Public Records
Property tax history
-5.7%/yrLatest (2025): $423 · -6.7% YoY. Source: county tax records.
Cash-flow waterfall
monthlySold comps — $/sqft
last 12 mo · ≤1 miLoading sold comps…