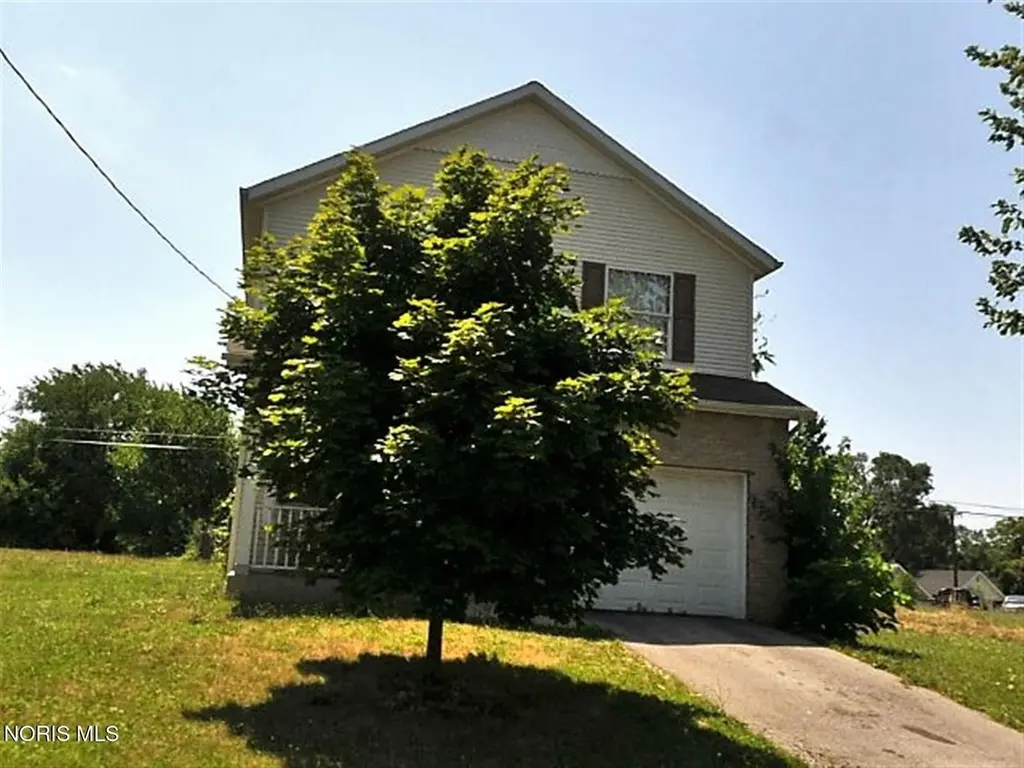
737 Tecumseh St · Toledo, OH
Flood risk 1/10 · Minimal
- FEMA flood zone
- X (unshaded)
- Chance of flooding over 30 yrs
- 0.0%
- Est. flood insurance / yr
- $507 – $1,088
Fire risk 1/10 · Minimal
- Est. fire insurance / yr
- $713 – $1,323
Heat risk 3/10 · Minor
- Hot days now (above 101°F)
- 7 days/yr
- Hot days in 30 yrs
- 16 days/yr
Wind risk 2/10 · Minimal
- Chance of severe wind over 30 yrs
- —
Air-quality risk 2/10 · Minimal
- Unhealthy air days now
- 1 days/yr
- Unhealthy air days in 30 yrs
- 2 days/yr
Risk factors via First Street. Map © Google.
Why this score? — see what drove the B grade
The composite is a weighted blend of 9 inputs, each scored 0–100. Each bar is that input's sub-score; the figure is the points it added to the 100-point composite (weight × sub-score).
- Cash flow +30.0/30.0
- 1% rule +10.0/10.0
- DSCR +10.0/10.0
- ARV discount +7.5/15.0
- Appreciation +6.2/10.0
- Livability +3.3/5.0
- Rent growth +2.5/5.0
- Condition / age +2.5/5.0
- Schools +1.6/10.0
$84,900
🖨 Deal sheet 📄 Offer letter ✓ Due diligence
Listing remarks MLS
Well-maintained single-family home built in 2002 with key updates throughout. Major mechanicals including the AC, furnace, and water heater are approximately two years old. The kitchen features newer appliances, including refrigerator, dishwasher, and stove. The primary bedroom is conveniently located on the first floor and includes a private en-suite bathroom. Additional living space offers a functional and practical layout. Exterior features include a fully fenced backyard, providing privacy and outdoor enjoyment. The property is currently tenant occupied, generating $1,200 per month in rental income. A solid opportunity for investors or future owner-occupants seeking a home with updates already in place. No showing without an accept offer.
Key facts
- 4,400 sq ft lot
- Garage
- Built 2002
Neighborhood map
What this means for you Summary
Snapshot
- This is a 4-bed/2.0-bath single-family listed at $85k.
Deal economics
- At list price, monthly cash flow is $527 ($6k/yr) — positive.
- The deal already cash-flows at list — no discount required.
- Meets the 1% rule at list price ($1k rent vs $85k).
- Recommended offer: $80k (6.0% below list) — sets the bar for market timing.
- Cap rate 13.7% vs local median 7.6% in Toledo — top-decile yield for the area; either an underpriced asset or a hidden risk that comps aren't pricing in. Stress-test before assuming the spread holds.
Location & tenants
- Location reads 66/100 on livability (#645 in OH) — a middle-class / working-renter tenant base. Strengths: cost of living A+, housing A+, health & safety A+; Watch: amenities C-, schools D-, crime F.
- Toledo City (urban): math 15% / reading 24% proficiency, ranked #634 of 656 in OH (top 97%) — low school quality limits family demand, transient renter base, plan for 1-2y turnover; 72% free/reduced lunch — lower-income household profile, screen leases tightly.
- Market conditions: 16 active listings in the ZIP; 10 comparable units currently listed for rent nearby; rentals lingering (median 44d on market — plan ~5-8 weeks vacancy on turnover, expect pricing pressure); 60% of comp listings sitting > 30 days — soft ceiling on asking rent; lower-income renter base — watch delinquency; 415 units permitted in Lucas County in 2024 (122 in 5+ unit buildings).
- At $1,383/mo this rent would consume 80% of the median local household income ($21k/yr) (locally 693% of renters already pay >50% of income on rent) — very limited rent-growth headroom before tenants either downsize or default.
Forward outlook
- In year one you build about $3k of equity ($587 loan paydown + $2k appreciation (2.4% local appreciation)).
- Lucas County population projected at -16% by 2050 — secular population decline; favor cash flow + early exit over multi-decade hold.
- At projected returns (2.4% appreciation + 3.0% rent growth), your $24k cash investment doubles in ~3 years — after that, you're playing with house money.
Negotiation context
- It's been on market 76 days — a 6% lower offer ($80k) is reasonable based on typical stale-listing flexibility.
- 6 sale attempts since 3y ago with the ask held roughly flat each time — persistent listings suggest the price (not the market) is what's stuck; bring a comps-based counter.
- Current owner paid $70k; 21% above their basis — modest negotiation headroom, anchor on the comps not their cost.
Questions for the listing agent
- It's been on market 76 days. Have you received any prior offers? Is the seller open to a 6% concession, seller financing, or rate buy-down credit?
- Why hasn't it sold? Are there any deal-killer items the seller is aware of (foundation, flood, title, zoning, code violations)?
- Is there a deadline driving the sale (1031 exchange, divorce, estate, relocation)? That informs how much negotiation room exists.
- Schools are D-rated, which usually means shorter tenancies and higher turnover. Who's the typical renter profile here, and what's been the actual vacancy rate?
- Crime grade is F in this area — have there been break-ins, vandalism, or insurance claims at this property in the last 3 years? What carrier currently insures it and at what premium?
- What's the average days-on-market for RENTAL listings here right now (not sales)? A rising rental-DOM trend means longer vacancies and softer asking-rent achievability than the comps imply.
- What's the recent tenant-quality profile in this submarket — average credit score on applications, eviction rate, late-payment / NSF rate, and stable-employment percentage? A property-management company in the area should have these aggregated.
- How much new for-sale + rental construction is in the pipeline within 1–3 miles? Heavy new supply typically softens prices + rents 12–24 months out; constrained supply supports both.
Investment metrics
- 1% rule
- 1.63% ✓
- Cap rate
- 13.74%
- Cash-on-cash
- 26.60%
- DSCR
- 2.18
- GRM
- 5.1
CMA / ARV
- ARV (median comp)
- $48,503
- List price
- $84,900
- Delta
- 75.04%
- Verdict
- OVERPRICED
- Comps
- 20 within 1.0 mi
Show comp detail 12 sales within ~0.75 mi
| Address | Dist | Beds/Ba | Sqft | Sold | Price | $/sf | Match |
|---|---|---|---|---|---|---|---|
| 1109 City Park Park | 0.52mi | 4/2.0 | 1,531 (-4%) | 6mo | $4,500 | $3 | 64 |
| 820 N Miller St | 0.35mi | 4/1.5 | 1,428 (-10%) | 3mo | $50,000 | $35 | 62 |
| 619 Pinewood Ave | 0.48mi | 4/1.5 | 1,444 (-9%) | 6mo | $65,000 | $45 | 55 |
| 670 Indiana Ave | 0.44mi | 3/2.0 (-1) | 1,668 (+5%) | 16mo | $82,000 | $49 | 53 |
| 1245 Hamilton St | 0.66mi | 4/1.5 | 1,663 (+5%) | 12mo | $68,000 | $41 | 49 |
| 245 Langdon St | 0.65mi | 3/1.0 (-1) | 1,538 (-3%) | 9mo | $23,500 | $15 | 48 |
| 210 Charles St | 0.52mi | 3/1.0 (-1) | 1,712 (+8%) | 7mo | $47,500 | $28 | 48 |
| 1117 Woodland Ave | 0.70mi | 3/1.5 (-1) | 1,602 (+1%) | 16mo | $87,900 | $55 | 45 |
| 391 Woodland Ave | 0.71mi | 3/1.5 (-1) | 1,509 (-5%) | 14mo | $91,350 | $61 | 41 |
| 247 Field Ave | 0.73mi | 4/1.0 | 1,712 (+8%) | 11mo | $70,400 | $41 | 39 |
| 656 Palmwood Ave | 0.67mi | 3/1.0 (-1) | 1,460 (-8%) | 16mo | $23,500 | $16 | 32 |
| 1011 Woodland Ave | 0.61mi | 3/2.0 (-1) | 1,351 (-15%) | 14mo | $69,653 | $52 | 30 |
Match score weights: distance 35% · size 25% · config 20% · recency 20%. Top-matched comps best support the ARV.
Projected returns pro-forma
2.35% appreciation · 3.0% rent growth · sell at horizon
- IRR
- 31.4%
- Equity multiple
- 2.72×
- Total profit
- $40,915
- Equity at exit
- $35,112
- IRR
- 32.4%
- Equity multiple
- 5.30×
- Total profit
- $102,325
- Equity at exit
- $51,842
Cash invested: $23,772 (down + closing). Projections, not guarantees.
Landlord ↔ Tenant lean methodology
- Overall (STATE)
- 73 Landlord-Friendly
- State Ohio
- 73 Landlord-Friendly · R+6
- County
- — inherits STATE
- City
- — inherits STATE
ZIP-level market 43604
- Home prices YoY
- 2.1%
- Active inventory
- 16
- Price-to-rent
- 5.1×
Monthly cashflow live
- Estimated rent
- $1,383 high interval (Pro) →
- Mortgage (P&I)
- −$445
- Tax from tax record
- −$85 /mo · $1,022/yr
- Insurance
- −$35
- HOA
- −$0
- Vacancy / Maint / Mgmt
- −$290
- Net cashflow
- $527
Break-even live
UW: 25.0% down · 7.5% · 30yr · 1.5% tax · 5.0% vac · 8.0% maint · 8.0% mgmt
Financing live
Cash to close
- Down payment
- $21,225
- Closing costs
- $2,547
- Reserves months
- —
- Total cash needed
- —
Loan-product check · same deal, 3 products live
Conventional
25% down · 7.5% · 30yr
- Down + closing
- —
- Monthly P&I
- —
- Monthly cashflow
- —
- DSCR
- —
- Eligible?
- —
Personal DTI + credit; lowest rate.
DSCR
20% down · 8.5% · 30yr
- Down + closing
- —
- Monthly P&I
- —
- Monthly cashflow
- —
- DSCR
- —
- Eligible?
- —
No personal income docs; deal must DSCR.
Hard money
10% down · 12.0% · 12mo
- Down + closing
- —
- Monthly P&I
- —
- Monthly cashflow
- —
- DSCR
- —
- Eligible?
- —
Short-term bridge; refi at stabilization.
Rent comps 10 comps
| Address | Beds | Baths | Sqft | Rent | $/sqft | DOM | Units | Dist |
|---|---|---|---|---|---|---|---|---|
| 1122 Pinewood Ave Toledo, OH | 3.0 | 1.0 | 1559 | $1,150 | $0.74 | 13d | 1 | 0.71mi |
| 1021 Walbridge Ave Toledo, OH | 3.0 | 1.0 | 1592 | $975 | $0.61 | 43d | 1 | 0.86mi |
| 1140 Palmwood Ave Toledo, OH | 3.0 | 1.0 | 1292 | $1,500 | $1.16 | 43d | 1 | 0.87mi |
| 1321 Gordon St Toledo, OH | 3.0 | 1.0 | 1121 | $1,050 | $0.94 | 43d | 1 | 0.96mi |
| 244 Knower St Toledo, OH | 3.0 | 1.0 | 1120 | $995 | $0.89 | 13d | 1 | 1.14mi |
| 319 N Detroit Ave Toledo, OH | 3.0 | 1.0 | 1341 | $845 | $0.63 | 43d | 1 | 1.19mi |
| 322 14th St Apt 203 Toledo, OH | 3.0 | 1.5 | 1065 | $1,000 | $0.94 | 13d | 1 | 1.25mi |
| 532 Carlton St Toledo, OH | 3.0 | 1.0 | 1130 | $1,050 | $0.93 | 43d | 1 | 1.33mi |
| 523 Nicholas St Toledo, OH | 3.0 | 1.0 | 1290 | $1,350 | $1.05 | 13d | 1 | 1.34mi |
| 724 Spencer St Toledo, OH | 3.0 | 1.5 | 1127 | $1,100 | $0.98 | 43d | 1 | 1.46mi |
Listing history 28 events
-
2026-06-18days on market $84,900 Active 76 DOM
-
2026-06-17days on market $84,900 Active 75 DOM
-
2026-06-16days on market $84,900 Active 74 DOM
-
2026-06-15days on market $84,900 Active 73 DOM
-
2026-06-14days on market $84,900 Active 71 DOM
-
2026-06-10days on market $84,900 Active 68 DOM
-
2026-06-09days on market $84,900 Active 67 DOM
-
2026-06-08days on market $84,900 Active 66 DOM
-
2026-06-07days on market $84,900 Active 65 DOM
-
2026-06-05days on market $84,900 Active 62 DOM
-
2026-06-03days on market $84,900 Active 61 DOM
-
2026-06-02days on market $84,900 Active 60 DOM
-
2026-06-01days on market $84,900 Active 59 DOM
-
2026-05-31days on market $84,900 Active 58 DOM
-
2026-05-30days on market $84,900 Active 57 DOM
-
2026-05-15status Active 753-char remark
Show marketing remark (753 chars)
Well-maintained single-family home built in 2002 with key updates throughout. Major mechanicals including the AC, furnace, and water heater are approximately two years old. The kitchen features newer appliances, including refrigerator, dishwasher, and stove. The primary bedroom is conveniently located on the first floor and includes a private en-suite bathroom. Additional living space offers a functional and practical layout. Exterior features include a fully fenced backyard, providing privacy and outdoor enjoyment. The property is currently tenant occupied, generating $1,200 per month in rental income. A solid opportunity for investors or future owner-occupants seeking a home with updates already in place. No showing without an accept offer.
-
2026-04-23historical Contingent 753-char remark
Show marketing remark (753 chars)
Well-maintained single-family home built in 2002 with key updates throughout. Major mechanicals including the AC, furnace, and water heater are approximately two years old. The kitchen features newer appliances, including refrigerator, dishwasher, and stove. The primary bedroom is conveniently located on the first floor and includes a private en-suite bathroom. Additional living space offers a functional and practical layout. Exterior features include a fully fenced backyard, providing privacy and outdoor enjoyment. The property is currently tenant occupied, generating $1,200 per month in rental income. A solid opportunity for investors or future owner-occupants seeking a home with updates already in place. No showing without an accept offer.
-
2026-04-03$84,900 Active 753-char remark
Show marketing remark (753 chars)
Well-maintained single-family home built in 2002 with key updates throughout. Major mechanicals including the AC, furnace, and water heater are approximately two years old. The kitchen features newer appliances, including refrigerator, dishwasher, and stove. The primary bedroom is conveniently located on the first floor and includes a private en-suite bathroom. Additional living space offers a functional and practical layout. Exterior features include a fully fenced backyard, providing privacy and outdoor enjoyment. The property is currently tenant occupied, generating $1,200 per month in rental income. A solid opportunity for investors or future owner-occupants seeking a home with updates already in place. No showing without an accept offer.
-
2026-03-26historical $84,900 753-char remark
Show marketing remark (753 chars)
Well-maintained single-family home built in 2002 with key updates throughout. Major mechanicals including the AC, furnace, and water heater are approximately two years old. The kitchen features newer appliances, including refrigerator, dishwasher, and stove. The primary bedroom is conveniently located on the first floor and includes a private en-suite bathroom. Additional living space offers a functional and practical layout. Exterior features include a fully fenced backyard, providing privacy and outdoor enjoyment. The property is currently tenant occupied, generating $1,200 per month in rental income. A solid opportunity for investors or future owner-occupants seeking a home with updates already in place. No showing without an accept offer.
-
2025-10-14price $70,000 66-char remark
Show marketing remark (66 chars)
Great investment property. Freshly remodeled. New furnace and A/C.
-
2023-09-30historical $1,200
-
2023-09-19$1,200
-
2023-08-05historical $1,200
-
2023-08-02$1,200
-
2023-07-20status Pending 66-char remark
Show marketing remark (66 chars)
Great investment property. Freshly remodeled. New furnace and A/C.
-
2023-07-19soldstatus $70,000 Closed 66-char remark
Show marketing remark (66 chars)
Great investment property. Freshly remodeled. New furnace and A/C.
-
2023-04-26Contingent 66-char remark
Show marketing remark (66 chars)
Great investment property. Freshly remodeled. New furnace and A/C.
-
2023-04-25$80,000 66-char remark
Show marketing remark (66 chars)
Great investment property. Freshly remodeled. New furnace and A/C.
ⓘ Source: listings_history table (triggers on properties + properties_extension) + one-shot
backfill from property_details.listing_events for pre-trigger history.
Tax reassessment forecast OH · Partial reset (capped growth)
- Current annual tax
- $1,022 · $85/mo
- Projected year-2 tax
- $1,173 · $98/mo
- Expected delta
- +$151/yr (+$13/mo · 14.8%)
ⓘ Screening estimate from a state-policy table — verify with the county assessor before closing.
Climate risk First Street
- Flood 1/10 Low FEMA zone X (unshaded) · 0% chance over 30 yrs
- Wildfire 1/10 Low
- Heat 3/10 Moderate 7 d/yr ≥101°F today · 16 d/yr by 30 yrs out
- Wind 2/10 Low
- Air quality 2/10 Low 1 unhealthy d/yr today · 2 by 30 yrs out
Nearby sold comps map
Loading sold comps map…
Walkable amenities ~0.75 mi
Loading nearby amenities…
Taxation est. · year 1
- Rental income
- $16,598
- − Mortgage interest
- −$4,756
- − Property taxes
- −$1,022
- − Insurance
- −$424
- − Repairs & maintenance
- −$1,328
- − Management
- −$1,328
- − Depreciation
- −$2,470
- Taxable income
- $5,270
- Est. tax owed @ 24.0%
- −$1,265
- After-tax cash flow
- $5,058/yr
For passive investors: Depreciation is non-cash, so a rental often shows a tax loss while cash-flowing — sheltering income. Rental losses are passive: they offset passive income freely, and up to $25,000/yr can offset ordinary (W-2) income if you actively participate and your MAGI is under $100k (phasing out to $0 by $150k); unused losses carry forward. On sale, claimed depreciation is recaptured at up to 25%, and gains may owe capital-gains tax (a 1031 exchange can defer both). Figures are a year-1 estimate at your 24.0% rate — not tax advice; consult a CPA.
Schools (NCES district)
- District
- Toledo City
- NCES district ID
- 3904490
- Math proficiency
- 15% ▼ -16.00%
- Reading proficiency
- 24% ▼ -13.00%
- Median HH income
- $32,137
- Composite
- 15.76/100
- National rank
- #9276
- State rank
- #634 of 656 in OH
Livability — Toledo
- Score
- 66/100
- State rank
- #645
- US rank
- #11442
Category grades
Schools grade is shown separately in the Schools card above.
Census & demographics
- Census place
- Toledo, OH
- County
- Lucas County · 380,724 people
- City population
- 280,811
- Metro
- Toledo, OH
- Population (ZIP)
- 9,594
- Household income
- $20,734
- Rent vs Own
- Severe rent burden
- 693.0
Population outlook (Lucas County) Hauer SSP2
- Today (2025)
- 420,751 people
- By 2030
- 410,187 · -2.5%
- By 2040
- 384,019 · -8.7%
- By 2050
- 355,125 · -15.6%
- By 2075
- 291,683 · -30.7%
- By 2100
- 233,670 · -44.5%
Race, ethnicity, and origin ACS 2023
- Neighborhood character
- Diverse neighborhood (Simpson 0.61)
- Race & ethnicity
- Black 51% White 34% Two or more races 9% Hispanic / Latino 9%
- Hispanic origin (detail)
- Mexican 8%
- Common ancestry
- Romanian 2% Slovak 1% Lithuanian 1%
- Foreign-born
- 4% · Canada, South Korea, China
- Languages at home
- 95% English-only · Spanish 3% Arabic 1%
Political lean MEDSL · Lucas
- 2024 margin
- D (+12.6) · D 55.8% · R 43.2%
- 2008→2024 swing
- -18.9pp toward R · 2008: 31.4pp · 2024: 12.6pp
- All cycles
- 2024: D+12.6 2020: D+16.8 2016: D+17.4 2012: D+30.4 2008: D+31.4
Not yet ingested
- Civics
- —
Market trends
- HPI YoY
- ▲ 2.35%
- Current HPI
- 111.6154
- Rent YoY
- —
- Metro
- Toledo, OH
- State GDP YoY
- ▲ 1.98%
- F500 in state
- 48
Industry mix (Fortune 500 HQ in OH)
| Industry | F500 HQs | Revenue |
|---|---|---|
| Insurance | 3 | $145B |
|
||
| Industrial Machinery | 3 | $49B |
|
||
| Financial Services | 3 | $24B |
|
||
| Consumer Goods | 2 | $93B |
|
||
| Aerospace / Defense | 2 | $47B |
|
||
| Utilities | 2 | $33B |
|
||
Price history
+6.1% since first listed13 events — show timeline
- 2026-05-15 Relisted — NORIS
- 2026-04-23 Contingent — NORIS
- 2026-04-03 Listed $84,900 NORIS
- 2026-03-26 Coming Soon $84,900 NORIS
- 2025-10-14 Price Changed $70,000 NORIS
- 2023-09-30 Rental Removed $1,200 BUILDIUM
- 2023-09-19 Listed for Rent $1,200 BUILDIUM
- 2023-08-05 Rental Removed $1,200 BUILDIUM
- 2023-08-02 Listed for Rent $1,200 BUILDIUM
- 2023-07-20 Pending — NORIS
- 2023-07-19 Sold (MLS) $70,000 NORIS
- 2023-04-26 Listed — NORIS
- 2023-04-25 Listed $80,000 NORIS
Property tax history
+11.1%/yrLatest (2025): $1,022 · +3.0% YoY. Source: county tax records.
Cash-flow waterfall
monthlySold comps — $/sqft
last 12 mo · ≤1 miLoading sold comps…