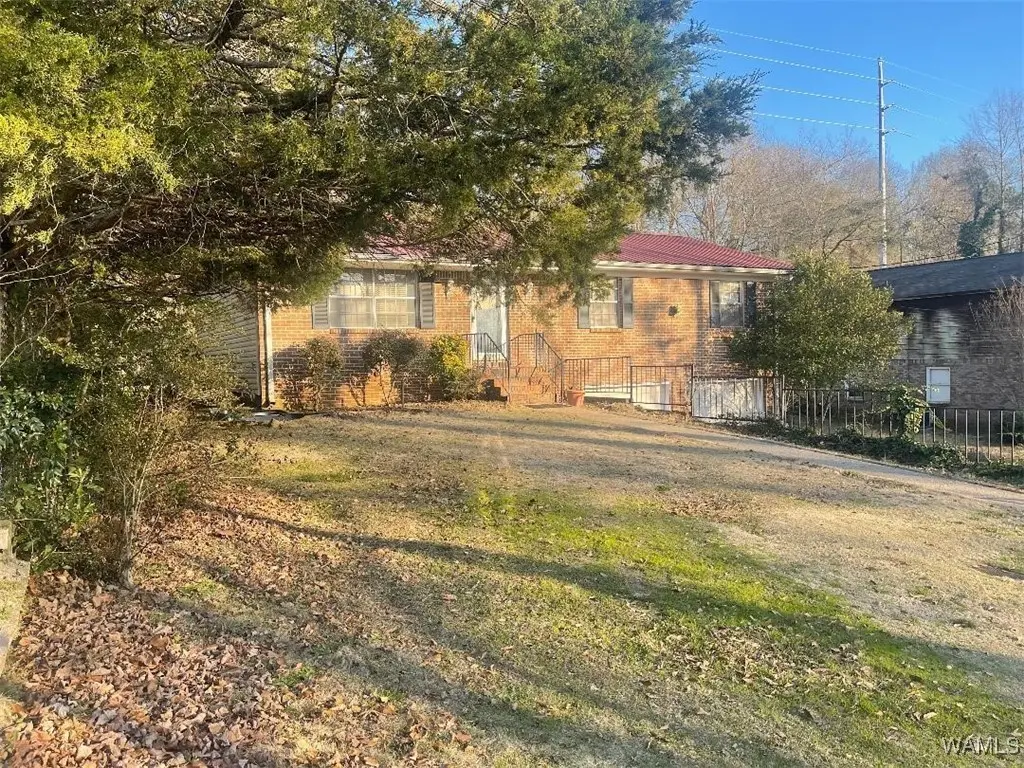
2817 Valley Crest Rd Rd · Tuscaloosa, AL
Flood risk 7/10 · Major
- FEMA flood zone
- X (unshaded)
- Chance of flooding over 30 yrs
- 0.77%
- Est. flood insurance / yr
- $473 – $860
Fire risk 3/10 · Minor
- Est. fire insurance / yr
- $916 – $1,700
Heat risk 7/10 · Major
- Hot days now (above 107°F)
- 7 days/yr
- Hot days in 30 yrs
- 19 days/yr
Wind risk 6/10 · Moderate
- Chance of severe wind over 30 yrs
- 50.0%
Air-quality risk 3/10 · Minor
- Unhealthy air days now
- 2 days/yr
- Unhealthy air days in 30 yrs
- 3 days/yr
Risk factors via First Street. Map © Google.
Why this score? — see what drove the F grade
The composite is a weighted blend of 9 inputs, each scored 0–100. Each bar is that input's sub-score; the figure is the points it added to the 100-point composite (weight × sub-score).
- ARV discount +12.6/15.0
- Cash flow +6.8/30.0
- Rent growth +3.9/5.0
- Livability +3.9/5.0
- Schools +2.5/10.0
- Condition / age +2.5/5.0
- 1% rule +1.8/10.0
- DSCR +1.0/10.0
- Appreciation +0.0/10.0
$199,500
🖨 Deal sheet (PDF) 📄 Offer letter ✓ Due diligence
Listing remarks MLS
Main floor has 3 bedrooms 2 bath and enjoy your sunroom, large family room, open kitchen with open dining. plus, in basement 1 bath with kitchenet, living space and large office sold as is, Large fenced in back yard. More pictures coming soon Call today
Key facts
- 0.4 acre lot
- 2 garage spots
- Built 1970
Neighborhood map
What this means for you Summary
Snapshot
- This is a 3-bed/1.0-bath single-family listed at $200k.
Deal economics
- At list price, monthly cash flow is $-365 ($-4k/yr) — negative.
- To cash-flow at today's rent, offer at most $147k (26.5% below list).
- To meet the 1% rule (rent ≥ 1% of price), the offer needs to be $135k (32.2% below list).
- Recommended offer: $135k (32.2% below list) — sets the bar for 1% rule.
- Cap rate 4.4% vs local median 3.4% in Tuscaloosa — meaningfully above typical; check what's discounted (condition, days-on-market, listing class) to confirm the premium yield is real.
Location & tenants
- Location reads 77/100 on livability (#9 in AL, #2,909 nationally) — a middle-class / working-renter tenant base. Strengths: amenities A+, health & safety A+, cost of living A; Watch: crime F, employment D-.
- Tuscaloosa City (urban): math 19% / reading 40% proficiency, ranked #74 of 129 in AL (top 57%) — low school quality limits family demand, transient renter base, plan for 1-2y turnover.
- Zoned schools: Eastwood Middle School (math 3% / reading 31%, grade F, #201 of 257 statewide, top 79%, 758 students, 78% FRL); Paul W Bryant High School (math 3% / reading 7%, grade F, #276 of 305 statewide, top 95%, 1,042 students, 48% FRL) — zoned schools at 63% FRL track the district average.
- Zoned-school proficiency averages 11% at this address vs 30% district-wide (-18 pts) — the specific schools serving this property underperform the Tuscaloosa City average; the district grade overstates school quality for this exact location.
- Market conditions: Rents rising fast (+5.4%/yr); 462 active listings in the ZIP; 22 comparable units currently listed for rent nearby; rentals lingering (median 46d on market — plan ~5-8 weeks vacancy on turnover, expect pricing pressure); 50% of comp listings sitting > 30 days — soft ceiling on asking rent; 622 units permitted in Tuscaloosa County in 2024 (69 in 5+ unit buildings).
Forward outlook
- Local home prices are declining (-3.0%/yr); year-one equity from $1k of loan paydown is wiped out by about $6k of value loss. Plan a longer hold.
- Tuscaloosa County population projected at +26% by 2050 — long-run rental-demand tailwind backs the buy-and-hold thesis.
Negotiation context
- It's been on market 116 days — a 9% lower offer ($182k) is reasonable based on typical stale-listing flexibility.
Risks & watch-outs
- Watch-outs: flood insurance adds $56/mo.
- Climate carrying-cost: major flood risk; major wind risk, 50% chance of damaging wind over 30y; extreme-heat days projected 7→19/yr by 2055 (HVAC capex compounding) — expect insurance premiums to compound above CPI over the hold.
Questions for the listing agent
- What do current leases actually rent for vs. the listed asking? Can we see a recent rent roll and the last 12 months of T-12 income?
- It's been on market 116 days. Have you received any prior offers? Is the seller open to a 32% concession, seller financing, or rate buy-down credit?
- Built in 1970 — when were the roof, HVAC, electrical panel, plumbing, and water heater last replaced?
- What's the actual annual flood-insurance premium (NFIP or private), and is the property in a SFHA with mandatory coverage?
- Why hasn't it sold? Are there any deal-killer items the seller is aware of (foundation, flood, title, zoning, code violations)?
- Is there a deadline driving the sale (1031 exchange, divorce, estate, relocation)? That informs how much negotiation room exists.
- Crime grade is F in this area — have there been break-ins, vandalism, or insurance claims at this property in the last 3 years? What carrier currently insures it and at what premium?
- The area grade is low — what's the realistic commute time and amenity access for the typical tenant pool here? Any planned neighborhood developments (good or bad) we should know about?
- What's the average days-on-market for RENTAL listings here right now (not sales)? A rising rental-DOM trend means longer vacancies and softer asking-rent achievability than the comps imply.
- What's the recent tenant-quality profile in this submarket — average credit score on applications, eviction rate, late-payment / NSF rate, and stable-employment percentage? A property-management company in the area should have these aggregated.
- How much new for-sale + rental construction is in the pipeline within 1–3 miles? Heavy new supply typically softens prices + rents 12–24 months out; constrained supply supports both.
Investment metrics
- 1% rule
- 0.68% ✗
- Cap rate
- 4.43%
- Cash-on-cash
- -6.65%
- DSCR
- 0.70
- GRM
- 12.3
CMA / ARV
- ARV (median comp)
- $224,865
- List price
- $199,500
- Delta
- -11.28%
- Verdict
- UNDERPRICED
- Comps
- 20 within 1.0 mi
Show comp detail 12 sales within ~0.75 mi
| Address | Dist | Beds/Ba | Sqft | Sold | Price | $/sf | Match |
|---|---|---|---|---|---|---|---|
| 2837 Valley Crest RD Rd | 0.05mi | 3/2.0 | 1,368 (-0%) | 10mo | $182,000 | $133 | 85 |
| 2801 Valley Crest Rd | 0.04mi | 2/2.0 (-1) | 1,471 (+7%) | 6mo | $207,000 | $141 | 72 |
| 3337 Willow Ridge Ln | 0.41mi | 3/2.0 | 1,420 (+4%) | 1mo | $212,500 | $150 | 70 |
| 3323 Willow Ridge Dr | 0.41mi | 3/2.0 | 1,315 (-4%) | 1mo | $211,500 | $161 | 69 |
| 141 Circlewood | 0.30mi | 3/3.0 | 1,475 (+8%) | 0mo | $225,000 | $153 | 65 |
| 3413 Willow Ridge Dr | 0.46mi | 3/2.0 | 1,388 (+1%) | 10mo | $215,000 | $155 | 64 |
| 2619 Willow Ridge Way | 0.45mi | 3/2.0 | 1,420 (+4%) | 9mo | $235,000 | $165 | 62 |
| 2488 Valley View Ln | 0.10mi | 3/2.0 | 1,552 (+13%) | 12mo | $250,000 | $161 | 60 |
| 3414 32nd Ave E | 0.69mi | 3/2.0 | 1,429 (+4%) | 6mo | $165,000 | $115 | 52 |
| 2726 Loop Rd | 0.50mi | 3/2.0 | 1,175 (-14%) | 4mo | $200,000 | $170 | 46 |
| 1816 24th Ave E | 0.71mi | 3/1.5 | 1,228 (-10%) | 12mo | $180,000 | $147 | 38 |
| 2915 Shannon Dr | 0.73mi | 2/1.0 (-1) | 1,176 (-14%) | 12mo | $150,000 | $128 | 27 |
Match score weights: distance 35% · size 25% · config 20% · recency 20%. Top-matched comps best support the ARV.
Projected returns pro-forma
-3.0% appreciation · 5.42% rent growth · sell at horizon
- IRR
- -27.2%
- Equity multiple
- 0.07×
- Total profit
- $-52,148
- Equity at exit
- $29,746
- IRR
- -18.0%
- Equity multiple
- -0.08×
- Total profit
- $-60,572
- Equity at exit
- $17,249
Cash invested: $55,860 (down + closing). Projections, not guarantees.
Landlord ↔ Tenant lean methodology
- Overall (STATE)
- 90 Strongly Landlord-Friendly
- State Alabama
- 90 Strongly Landlord-Friendly · R+15
- County
- — inherits STATE
- City
- — inherits STATE
ZIP-level market 35405
- Home prices YoY
- -26.9%
- Rents YoY
- 5.4%
- Active inventory
- 462
- Price-to-rent
- 12.3×
Monthly cashflow live
- Estimated rent
- $1,353 high interval (Pro) →
- Mortgage (P&I)
- −$1,046
- Tax est. 1.5%
- −$249 /mo · $2,992/yr
- Insurance
- −$83
- Flood insurance flood zone
- −$56 /mo · $666/yr
- HOA
- −$0
- Vacancy / Maint / Mgmt
- −$284
- Net cashflow
- $-365
Break-even live
Sensitivity live
| Price | -10% $-227 | -5% $-296 | +0% $-365 | +5% $-434 | +10% $-503 |
|---|---|---|---|---|---|
| Rent | -10% $-472 | -5% $-418 | +0% $-365 | +5% $-312 | +10% $-258 |
| Rate | -1.0pp $-265 | -0.5pp $-314 | base $-365 | +0.5pp $-417 | +1.0pp $-469 |
UW: 25.0% down · 7.5% · 30yr · 1.5% tax · 5.0% vac · 8.0% maint · 8.0% mgmt
Financing live
Cash to close
- Down payment
- $49,875
- Closing costs
- $5,985
- Reserves months
- —
- Total cash needed
- —
Loan-product check · same deal, 3 products live
Conventional
25% down · 7.5% · 30yr
- Down + closing
- —
- Monthly P&I
- —
- Monthly cashflow
- —
- DSCR
- —
- Eligible?
- —
Personal DTI + credit; lowest rate.
DSCR
20% down · 8.5% · 30yr
- Down + closing
- —
- Monthly P&I
- —
- Monthly cashflow
- —
- DSCR
- —
- Eligible?
- —
No personal income docs; deal must DSCR.
Hard money
10% down · 12.0% · 12mo
- Down + closing
- —
- Monthly P&I
- —
- Monthly cashflow
- —
- DSCR
- —
- Eligible?
- —
Short-term bridge; refi at stabilization.
Rent comps 22 comps
| Address | Beds | Baths | Sqft | Rent | $/sqft | DOM | Units | Dist |
|---|---|---|---|---|---|---|---|---|
| 2837 Valley Crest Rd Tuscaloosa, AL | 2.0 | 1.0 | 1369 | $550 | $0.40 | 45d | 1 | 0.06mi |
| 123 Circlewood Tuscaloosa, AL | 2.0 | 1.0 | 1250 | $1,150 | $0.92 | 45d | 1 | 0.30mi |
| 1800 Hargrove East Rd Tuscaloosa, AL | 2.0 | 1.0 | 950 | $875 | $0.92 | 15d | 1 | 0.59mi |
| 2501 Veterans Memorial Pkwy Tuscaloosa, AL | 2.0 | 2.0 | 1018 | $875 | $0.86 | 46d | 1 | 0.91mi |
| 2501 Veterans Memorial Pkwy Tuscaloosa, AL | 2.0 | 2.0 | 1078 | $975 | $0.90 | 15d | 1 | 0.91mi |
| 1515 Kicker Rd Tuscaloosa, AL | 1.0–2.0 | 1.0–2.0 | 1050 | $1,025 | $0.98 | 45d | 1 | 1.02mi |
| 3719 Hargrove Rd E Tuscaloosa, AL | 3.0 | 2.0 | 1300 | $1,150 | $0.88 | 23d | 1 | 1.07mi |
| 3218 Veterans Memorial Pkwy Tuscaloosa, AL | 3.0 | 3.0–3.5 | 1484 | $1,950 | $1.31 | 23d | 1 | 1.12mi |
| 3504 12th Ave E Tuscaloosa, AL | 2.0 | 1.0–1.5 | 1019 | $1,037 | $1.02 | 45d | 10 | 1.16mi |
| 4325 Henry Rd Tuscaloosa, AL | 4.0 | 2.0 | 1444 | $1,795 | $1.24 | 15d | 1 | 1.17mi |
| 2400 Sky Dr Tuscaloosa, AL | 4.0 | 2.0 | 1504 | $1,695 | $1.13 | 15d | 1 | 1.23mi |
| 4527 18th Ave E Tuscaloosa, AL | 1.0–2.0 | 1.0–2.0 | 878 | $1,249 | $1.42 | 45d | 6 | 1.29mi |
| 1722 13th St E Tuscaloosa, AL | 3.0 | 1.0 | 1200 | $1,100 | $0.92 | 45d | 1 | 1.32mi |
| 713 33rd St E Tuscaloosa, AL | 2.0 | 2.0 | 1036 | $815 | $0.79 | 45d | 1 | 1.37mi |
| 1010 23rd Ave E Tuscaloosa, AL | 3.0 | 2.0 | 1251 | $1,500 | $1.20 | 45d | 1 | 1.39mi |
| 621 E 33rd St Unit D Tuscaloosa, AL | 2.0 | 1.0 | 1000 | $925 | $0.93 | 45d | 1 | 1.42mi |
| 4801 Cypress Creek Ave E Tuscaloosa, AL | 1.0–2.0 | 1.0–1.5 | 889 | $1,009 | $1.13 | 15d | 9 | 1.44mi |
| 2201 48th St E Tuscaloosa, AL | 1.0–3.0 | 1.0–2.0 | 893 | $1,345 | $1.51 | 15d | 21 | 1.46mi |
| 1305 12th St E Tuscaloosa, AL | 4.0 | 2.0 | 1377 | $1,615 | $1.17 | 23d | 1 | 1.46mi |
| 936 22nd Ave E Tuscaloosa, AL | 1.0–2.0 | 1.0–2.0 | 906 | $2,000 | $2.21 | 15d | 4 | 1.48mi |
| 933 21st Ave E Tuscaloosa, AL | 1.0–2.0 | 1.0–2.0 | 906 | $2,150 | $2.37 | 45d | 2 | 1.49mi |
| 922 23rd Ave E Tuscaloosa, AL | 1.0–2.0 | 1.0–2.0 | 1092 | $2,300 | $2.11 | 15d | 4 | 1.50mi |
Listing history 4 events
-
2026-05-30days on market $199,500 Active 116 DOM
-
2026-04-14price $199,500 256-char remark
Show marketing remark (256 chars)
Main floor has 3 bedrooms 2 bath and enjoy your sunroom, large family room, open kitchen with open dining. plus, in basement 1 bath with kitchenet, living space and large office sold as is, Large fenced in back yard. More pictures coming soon Call today
-
2026-03-30price $205,800 256-char remark
Show marketing remark (256 chars)
Main floor has 3 bedrooms 2 bath and enjoy your sunroom, large family room, open kitchen with open dining. plus, in basement 1 bath with kitchenet, living space and large office sold as is, Large fenced in back yard. More pictures coming soon Call today
-
2026-02-02$205,900 Active 256-char remark
Show marketing remark (256 chars)
Main floor has 3 bedrooms 2 bath and enjoy your sunroom, large family room, open kitchen with open dining. plus, in basement 1 bath with kitchenet, living space and large office sold as is, Large fenced in back yard. More pictures coming soon Call today
ⓘ Source: listings_history table (triggers on properties + properties_extension) + one-shot
backfill from property_details.listing_events for pre-trigger history.
Climate risk First Street
- Flood 7/10 Severe FEMA zone X (unshaded) · 77% chance over 30 yrs
- Wildfire 3/10 Moderate
- Heat 7/10 Severe 7 d/yr ≥107°F today · 19 d/yr by 30 yrs out
- Wind 6/10 Major 50% chance of damaging wind over 30 yrs
- Air quality 3/10 Moderate 2 unhealthy d/yr today · 3 by 30 yrs out
Nearby sold comps map
Loading sold comps map…
Walkable amenities ~0.75 mi
Loading nearby amenities…
Taxation est. · year 1
- Rental income
- $16,241
- − Mortgage interest
- −$11,175
- − Property taxes
- −$2,992
- − Insurance
- −$1,664
- − Repairs & maintenance
- −$1,299
- − Management
- −$1,299
- − Depreciation
- −$5,804
- Taxable loss
- −$7,993
- Est. tax savings @ 24.0%
- +$1,918
- After-tax cash flow
- $-2,462/yr
For passive investors: Depreciation is non-cash, so a rental often shows a tax loss while cash-flowing — sheltering income. Rental losses are passive: they offset passive income freely, and up to $25,000/yr can offset ordinary (W-2) income if you actively participate and your MAGI is under $100k (phasing out to $0 by $150k); unused losses carry forward. On sale, claimed depreciation is recaptured at up to 25%, and gains may owe capital-gains tax (a 1031 exchange can defer both). Figures are a year-1 estimate at your 24.0% rate — not tax advice; consult a CPA.
Schools (NCES district)
- District
- Tuscaloosa City
- NCES district ID
- 0103360
- Math proficiency
- 19% ▼ -24.00%
- Reading proficiency
- 40% ▼ -1.00%
- Median HH income
- $37,474
- Composite
- 24.51/100
- National rank
- #7647
- State rank
- #74 of 129 in AL
Livability — Tuscaloosa
- Score
- 77/100
- State rank
- #9
- US rank
- #2909
Category grades
Schools grade is shown separately in the Schools card above.
Census & demographics
- Census place
- Tuscaloosa, AL
- County
- Tuscaloosa County · 206,491 people
- City population
- 134,228
- Metro
- Tuscaloosa, AL
- Population (ZIP)
- 49,420
- Household income
- $62,301
- Rent vs Own
- Severe rent burden
- 1963.0
Population outlook (Tuscaloosa County) Hauer SSP2
- Today (2025)
- 228,293 people
- By 2030
- 240,551 · +5.4%
- By 2040
- 263,856 · +15.6%
- By 2050
- 286,491 · +25.5%
- By 2075
- 335,783 · +47.1%
- By 2100
- 370,520 · +62.3%
Race, ethnicity, and origin ACS 2023
- Neighborhood character
- Diverse neighborhood (Simpson 0.56)
- Race & ethnicity
- Black 56% White 35% Hispanic / Latino 5% Two or more races 3% Asian 2%
- Hispanic origin (detail)
- Mexican 2%
- Common ancestry
- Italian 1% Lithuanian 1% Slovak 1%
- Foreign-born
- 5% · Canada, China
- Languages at home
- 94% English-only · Spanish 4% Other Indo-European 1% Chinese 1%
Political lean MEDSL · Tuscaloosa
- 2024 margin
- Strong R (+20.4) · D 39.4% · R 59.8%
- 2008→2024 swing
- -4.4pp toward R · 2008: -16.0pp · 2024: -20.4pp
- All cycles
- 2024: R+20.4 2020: R+14.8 2016: R+19.5 2012: R+17.4 2008: R+16.0
Not yet ingested
- Civics
- —
Market trends
- HPI YoY
- ▼ -71.25%
- Current HPI
- 193.1929
- Rent YoY
- ▲ 5.42%
- Metro
- Tuscaloosa, AL
- State GDP YoY
- ▲ 2.94%
- F500 in state
- 4
Industry mix (Fortune 500 HQ in AL)
| Industry | F500 HQs | Revenue |
|---|---|---|
| Financial Services | 1 | $8B |
|
||
| Healthcare | 1 | $5B |
|
||
Price history
-3.1% since first listed3 events — show timeline
- 2026-04-14 Price Changed $199,500 WAMLS
- 2026-03-30 Price Changed $205,800 WAMLS
- 2026-02-02 Listed $205,900 WAMLS
Cash-flow waterfall
monthlySold comps — $/sqft
last 12 mo · ≤1 miLoading sold comps…