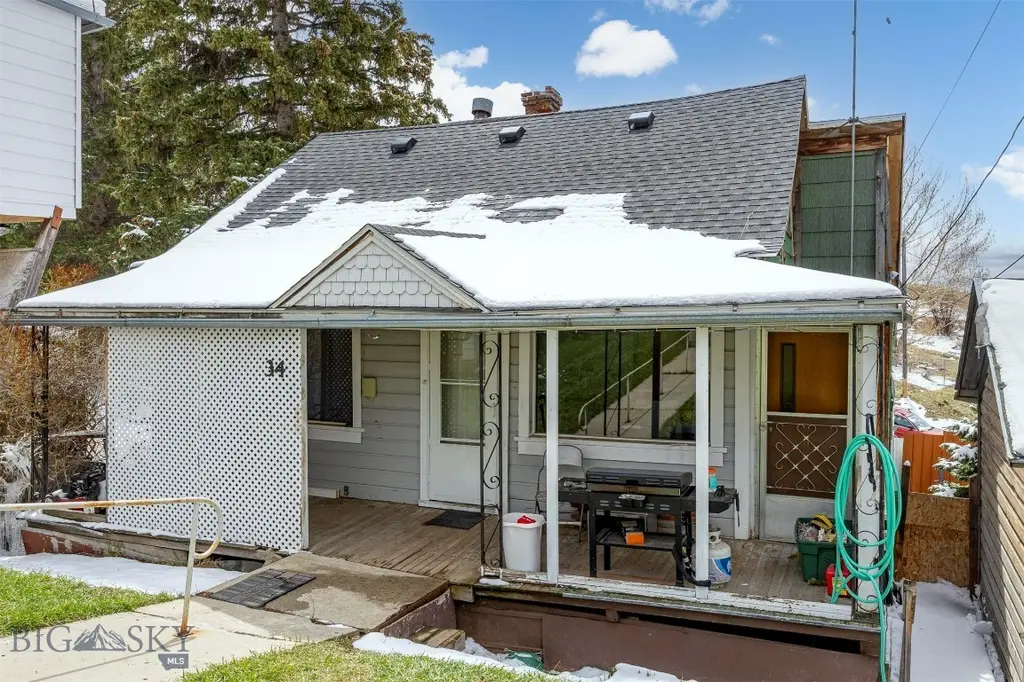
34 E Center St · Butte-Silver Bow (balance), MT
Flood risk 5/10 · Moderate
- FEMA flood zone
- X (unshaded)
- Chance of flooding over 30 yrs
- 0.24%
- Est. flood insurance / yr
- $473 – $860
Fire risk 5/10 · Moderate
- Est. fire insurance / yr
- $918 – $1,706
Heat risk 1/10 · Minimal
- Hot days now (above 86°F)
- 1 days/yr
- Hot days in 30 yrs
- 3 days/yr
Wind risk 1/10 · Minimal
- Chance of severe wind over 30 yrs
- —
Air-quality risk 9/10 · Severe
- Unhealthy air days now
- 19 days/yr
- Unhealthy air days in 30 yrs
- 26 days/yr
Risk factors via First Street. Map © Google.
Why this score? — see what drove the D+ grade
The composite is a weighted blend of 9 inputs, each scored 0–100. Each bar is that input's sub-score; the figure is the points it added to the 100-point composite (weight × sub-score).
- Cash flow +14.7/30.0
- ARV discount +12.1/15.0
- Rent growth +5.0/5.0
- DSCR +4.5/10.0
- 1% rule +3.1/10.0
- Schools +3.1/10.0
- Livability +2.5/5.0
- Condition / age +2.5/5.0
- Appreciation +0.0/10.0
$194,900
🖨 Deal sheet 📄 Offer letter ✓ Due diligence
Key facts
- Hot water tank
- Large sunroom
- Newer heating system
Tags
Property features AI
Finance
- Other: Property listed by Platinum Real Estate
- Financial info: Annual tax amount reported
Exterior
- Parking: Detached garage (1 car)
- Utilities: Public water; Public sewer; Sewer and water available
- Home design: Single-family residence; One story
- Construction: Above-grade finished area: 836; Total finished area: 1543
- Exterior features: Lot zoned R4
Interior
- Bathrooms: Two full bathrooms
- Heating & cooling: Forced air heating; No central air
- Interior features: Basement with walk-out access
Neighborhood map
What this means for you Summary
Snapshot
- This is a 3-bed/2.0-bath single-family listed at $195k.
Deal economics
- At list price, monthly cash flow is $49 ($588/yr) — positive.
- The deal already cash-flows at list — no discount required.
- To meet the 1% rule (rent ≥ 1% of price), the offer needs to be $158k (19.0% below list).
- Recommended offer: $158k (19.0% below list) — sets the bar for 1% rule.
- Cap rate 6.6% vs local median 2.9% in Butte-Silver Bow (balance) — top-decile yield for the area; either an underpriced asset or a hidden risk that comps aren't pricing in. Stress-test before assuming the spread holds.
Location & tenants
- Location reads: area grade D — affects rentability + tenant quality, not the cash-flow math above.
- Butte H S (town): math 24% / reading 50% proficiency, ranked #73 of 116 in MT (top 63%) — families likely to look elsewhere, expect single-tenant / working-renter base with shorter leases.
- Market conditions: Rents rising fast (+10.4%/yr); 320 active listings in the ZIP; 109 units permitted in Silver Bow County in 2024 (25 in 5+ unit buildings).
- This rent runs 31% of the median local income ($60k/yr) — at the standard rent-burdened threshold; future hikes will face affordability resistance.
Forward outlook
- Local home prices are declining (-3.0%/yr); year-one equity from $1k of loan paydown is wiped out by about $6k of value loss. Plan a longer hold.
- Silver Bow County population projected at +8% by 2050 — modest demand growth; plan on rents tracking national, not racing it.
Negotiation context
- It's been on market 52 days — a 3% lower offer ($189k) is reasonable based on typical stale-listing flexibility.
Risks & watch-outs
- Watch-outs: built in 1880 — expect roof / HVAC / electrical / plumbing capex.
- Climate carrying-cost: moderate flood risk; moderate wildfire risk — expect insurance premiums to compound above CPI over the hold.
Questions for the listing agent
- It's been on market 52 days. Have you received any prior offers? Is the seller open to a 19% concession, seller financing, or rate buy-down credit?
- Built in 1880 — when were the roof, HVAC, electrical panel, plumbing, and water heater last replaced?
- Is there a deadline driving the sale (1031 exchange, divorce, estate, relocation)? That informs how much negotiation room exists.
- The area grade is low — what's the realistic commute time and amenity access for the typical tenant pool here? Any planned neighborhood developments (good or bad) we should know about?
- What's the average days-on-market for RENTAL listings here right now (not sales)? A rising rental-DOM trend means longer vacancies and softer asking-rent achievability than the comps imply.
- What's the recent tenant-quality profile in this submarket — average credit score on applications, eviction rate, late-payment / NSF rate, and stable-employment percentage? A property-management company in the area should have these aggregated.
- How much new for-sale + rental construction is in the pipeline within 1–3 miles? Heavy new supply typically softens prices + rents 12–24 months out; constrained supply supports both.
Investment metrics
- 1% rule
- 0.81% ✗
- Cap rate
- 6.59%
- Cash-on-cash
- 1.08%
- DSCR
- 1.05
- GRM
- 10.3
CMA / ARV
- ARV (on-the-fly)
- $216,956
- Comps found
- 9
Show comp detail 9 sales within ~0.75 mi
| Address | Dist | Beds/Ba | Sqft | Sold | Price | $/sf | Match |
|---|---|---|---|---|---|---|---|
| 61 Bennett St | 0.14mi | 2/1.0 (-1) | 1,472 (-1%) | 9mo | $215,000 | $146 | 75 |
| 205 E Pacific St | 0.31mi | 3/1.5 | 1,462 (-2%) | 11mo | $199,000 | $136 | 72 |
| 21 Oneil St | 0.14mi | 2/1.0 (-1) | 1,279 (-14%) | 1mo | $150,000 | $117 | 61 |
| 121 Blue Wing St | 0.38mi | 4/1.0 (+1) | 1,531 (+3%) | 10mo | $205,000 | $134 | 60 |
| 705 Lexington Ave | 0.63mi | 3/2.0 | 1,468 (-1%) | 15mo | $320,000 | $218 | 56 |
| 6 E La Platte St | 0.09mi | 3/1.5 | 1,701 (+14%) | 21mo | $255,000 | $150 | 52 |
| 6 W Copper St | 0.62mi | 3/1.5 | 1,421 (-4%) | 14mo | $354,900 | $250 | 50 |
| 75 E Copper St | 0.58mi | 2/1.5 (-1) | 1,403 (-6%) | 15mo | $185,000 | $132 | 44 |
| 305 Virginia St | 0.59mi | 3/2.0 | 1,343 (-10%) | 19mo | $319,000 | $238 | 41 |
Match score weights: distance 35% · size 25% · config 20% · recency 20%. Top-matched comps best support the ARV.
Projected returns pro-forma
-3.0% appreciation · 8.0% rent growth · sell at horizon
- IRR
- -9.7%
- Equity multiple
- 0.63×
- Total profit
- $-20,186
- Equity at exit
- $29,060
- IRR
- 5.0%
- Equity multiple
- 1.44×
- Total profit
- $24,137
- Equity at exit
- $16,851
Cash invested: $54,572 (down + closing). Projections, not guarantees.
Landlord ↔ Tenant lean methodology
- Overall (STATE)
- 82 Strongly Landlord-Friendly
- State Montana
- 82 Strongly Landlord-Friendly · R+11
- County
- — inherits STATE
- City
- — inherits STATE
ZIP-level market 59701
- Home prices YoY
- -30.7%
- Rents YoY
- 10.4%
- Active inventory
- 320
- Price-to-rent
- 10.3×
Monthly cashflow live
- Estimated rent
- $1,579 medium interval (Pro) →
- Mortgage (P&I)
- −$1,022
- Tax from tax record
- −$95 /mo · $1,137/yr
- Insurance
- −$81
- HOA
- −$0
- Vacancy / Maint / Mgmt
- −$331
- Net cashflow
- $49
Break-even live
UW: 25.0% down · 7.5% · 30yr · 1.5% tax · 5.0% vac · 8.0% maint · 8.0% mgmt
Financing live
Cash to close
- Down payment
- $48,725
- Closing costs
- $5,847
- Reserves months
- —
- Total cash needed
- —
Loan-product check · same deal, 3 products live
Conventional
25% down · 7.5% · 30yr
- Down + closing
- —
- Monthly P&I
- —
- Monthly cashflow
- —
- DSCR
- —
- Eligible?
- —
Personal DTI + credit; lowest rate.
DSCR
20% down · 8.5% · 30yr
- Down + closing
- —
- Monthly P&I
- —
- Monthly cashflow
- —
- DSCR
- —
- Eligible?
- —
No personal income docs; deal must DSCR.
Hard money
10% down · 12.0% · 12mo
- Down + closing
- —
- Monthly P&I
- —
- Monthly cashflow
- —
- DSCR
- —
- Eligible?
- —
Short-term bridge; refi at stabilization.
Listing history 21 events
-
2026-06-19days on market $194,900 Active 52 DOM
-
2026-06-18days on market $194,900 Active 51 DOM
-
2026-06-17days on market $194,900 Active 50 DOM
-
2026-06-16days on market $194,900 Active 49 DOM
-
2026-06-15days on market $194,900 Active 48 DOM
-
2026-06-14days on market $194,900 Active 46 DOM
-
2026-06-12days on market $194,900 Active 45 DOM
-
2026-06-09days on market $194,900 Active 42 DOM
-
2026-06-08days on market $194,900 Active 41 DOM
-
2026-06-07pricedays on market $194,900 Active 40 DOM
-
2026-06-05days on market $204,900 Active 37 DOM
-
2026-06-03days on market $204,900 Active 36 DOM
-
2026-06-02days on market $204,900 Active 35 DOM
-
2026-06-01days on market $204,900 Active 34 DOM
-
2026-05-31days on market $204,900 Active 33 DOM
-
2026-05-30days on market $204,900 Active 32 DOM
-
2026-05-20price $204,900
-
2026-04-27$215,000 Active
-
2004-08-26soldstatus
-
2002-08-07soldstatus
-
2002-07-12soldstatus
ⓘ Source: listings_history table (triggers on properties + properties_extension) + one-shot
backfill from property_details.listing_events for pre-trigger history.
Tax reassessment forecast MT · Resets to sale price
- Current annual tax
- $1,137 · $95/mo
- Projected year-2 tax
- $1,637 · $136/mo
- Expected delta
- +$500/yr (+$42/mo · 44.0%)
ⓘ Screening estimate from a state-policy table — verify with the county assessor before closing.
Climate risk First Street
- Flood 5/10 Major FEMA zone X (unshaded) · 24% chance over 30 yrs
- Wildfire 5/10 Major
- Heat 1/10 Low 1 d/yr ≥86°F today · 3 d/yr by 30 yrs out
- Wind 1/10 Low
- Air quality 9/10 Extreme 19 unhealthy d/yr today · 26 by 30 yrs out
Nearby sold comps map
Loading sold comps map…
Walkable amenities ~0.75 mi
Loading nearby amenities…
Taxation est. · year 1
- Rental income
- $18,943
- − Mortgage interest
- −$10,917
- − Property taxes
- −$1,137
- − Insurance
- −$974
- − Repairs & maintenance
- −$1,515
- − Management
- −$1,515
- − Depreciation
- −$5,670
- Taxable loss
- −$2,787
- Est. tax savings @ 24.0%
- +$669
- After-tax cash flow
- $1,257/yr
For passive investors: Depreciation is non-cash, so a rental often shows a tax loss while cash-flowing — sheltering income. Rental losses are passive: they offset passive income freely, and up to $25,000/yr can offset ordinary (W-2) income if you actively participate and your MAGI is under $100k (phasing out to $0 by $150k); unused losses carry forward. On sale, claimed depreciation is recaptured at up to 25%, and gains may owe capital-gains tax (a 1031 exchange can defer both). Figures are a year-1 estimate at your 24.0% rate — not tax advice; consult a CPA.
Schools (NCES district)
- District
- Butte H S
- NCES district ID
- 3005310
- Math proficiency
- 24% ▼ -7.00%
- Reading proficiency
- 50% ▲ 1.00%
- Median HH income
- $37,852
- Composite
- 30.74/100
- National rank
- #6162
- State rank
- #73 of 116 in MT
Livability — Butte-Silver Bow (balance)
No livability data for this city. (Only ~50 U.S. cities are tracked.)
Census & demographics
- Census place
- Butte-Silver Bow (balance), MT
- County
- Silver Bow County · 34,232 people
- City population
- 35,306
- Metro
- Butte-Silver Bow, MT
- Population (ZIP)
- 34,232
- Household income
- $60,437
- Rent vs Own
- Severe rent burden
- 1060.0
Population outlook (Silver Bow County) Hauer SSP2
- Today (2025)
- 35,745 people
- By 2030
- 36,359 · +1.7%
- By 2040
- 37,490 · +4.9%
- By 2050
- 38,593 · +8.0%
- By 2075
- 43,773 · +22.5%
- By 2100
- 48,513 · +35.7%
Race, ethnicity, and origin ACS 2023
- Neighborhood character
- Predominantly White (89%)
- Race & ethnicity
- White 89% Two or more races 6% Hispanic / Latino 5% Native American 2%
- Common ancestry
- Portuguese 5% Lithuanian 3% Slovak 2%
- Foreign-born
- 1%
- Languages at home
- 97% English-only · Korean 1% Arabic 1%
Political lean MEDSL · Silver Bow
- 2024 margin
- Lean D (+7.0) · D 51.5% · R 44.5% · Other 4.0%
- 2008→2024 swing
- -33.4pp toward R · 2008: 40.4pp · 2024: 7.0pp
- All cycles
- 2024: D+7.0 2020: D+14.1 2016: D+14.2 2012: D+32.5 2008: D+40.4
Not yet ingested
- Civics
- —
Market trends
- HPI YoY
- ▼ -119.08%
- Current HPI
- 268.4972
- Rent YoY
- ▲ 10.44%
- Metro
- Butte-Silver Bow, MT
- State GDP YoY
- ▲ 3.41%
- F500 in state
- 2
Industry mix (Fortune 500 HQ in MT)
| Industry | F500 HQs | Revenue |
|---|---|---|
| Technology / Analytics | 1 | $2B |
|
||
Price history
-4.7% since first listed5 events — show timeline
- 2026-05-20 Price Changed $204,900 BSCMLS
- 2026-04-27 Listed $215,000 BSCMLS
- 2004-08-26 Sold (Public Records) — Public Records
- 2002-08-07 Sold (Public Records) — Public Records
- 2002-07-12 Sold (Public Records) — Public Records
Property tax history
+4.6%/yrLatest (2025): $1,137 · -9.5% YoY. Source: county tax records.
Cash-flow waterfall
monthlySold comps — $/sqft
last 12 mo · ≤1 miLoading sold comps…