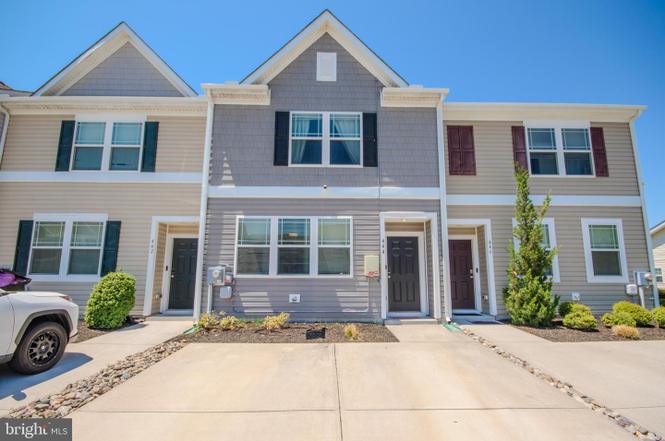
444 Creekbed Cir · Salisbury, MD
Flood risk No data
- FEMA flood zone
- —
- Chance of flooding over 30 yrs
- —
- Est. flood insurance / yr
- —
Fire risk No data
- Est. fire insurance / yr
- —
Heat risk No data
- Hot days now (above threshold)
- —
- Hot days in 30 yrs
- —
Wind risk No data
- Chance of severe wind over 30 yrs
- —
Air-quality risk No data
- Unhealthy air days now
- —
- Unhealthy air days in 30 yrs
- —
Risk factors via First Street. Map © Google.
Why this score? — see what drove the D- grade
The composite is a weighted blend of 9 inputs, each scored 0–100. Each bar is that input's sub-score; the figure is the points it added to the 100-point composite (weight × sub-score).
- Cash flow +12.8/30.0
- ARV discount +5.3/15.0
- DSCR +3.8/10.0
- Rent growth +3.4/5.0
- 1% rule +3.2/10.0
- Livability +3.0/5.0
- Condition / age +2.5/5.0
- Schools +1.9/10.0
- Appreciation +0.0/10.0
$250,000
🖨 Deal sheet 📄 Offer letter ✓ Due diligence
Listing remarks MLS
The best-selling Jefferson townhome design features 3 bedrooms and 2.5 bathrooms. Offering up to $10,000 in closing costs! You will love this open concept floorplan featuring an over-sized peninsula in the kitchen, 9' ceilings on the main level and stainless steel appliances. These move in ready homes include full lawn care and irrigation, ceiling fan rough ins in master and living room, two parking spaces outside your door, LED lighting and a walk in closet in the owner's suite. Visit us today to see how you can make this home yours.
Key facts
- $90 HOA
- 2 parking spots
- Built 2018
Property features AI
Finance
- Other: Pets allowed with no pet restrictions; In city limits (Salisbury)
- HOA & community: Monthly HOA fee of $90; HOA covers common area maintenance, snow removal, and management
Exterior
- Parking: Driveway parking; Two driveway spaces (total 2 garage/parking spaces)
- Utilities: Public water; Public septic; 200+ Amp electric service; Electric available; Cable TV available
- Home design: Interior townhouse/rowhouse; Fee simple ownership; Very good condition; Architectural shingle roof
- Construction: Vinyl siding; Stick-built construction; Slab foundation
- Exterior features: Privacy vinyl fencing; Not in a federal flood zone; City/County road responsibility; Blacktop road surface
Interior
- Kitchen: Dishwasher; Eat-in kitchen with pantry
- Bedrooms: Three bedrooms on the main level
- Flooring: Laminate flooring; Partial carpeting
- Bathrooms: Two full bathrooms; One half bathroom
- Heating & cooling: Heat pump(s); Electric cooling; Electric hot water
- Interior features: Open floor plan; Attic; Master bath(s); Sprinkler system; Eat-in kitchen; Pantry; Walk-in closet(s); Drywall walls and ceilings; Carpeted areas
Neighborhood map
What this means for you Summary
Snapshot
- This is a 3-bed/2.5-bath townhouse listed at $250k.
Deal economics
- At list price, monthly cash flow is $-23 ($-272/yr) — negative.
- To cash-flow at today's rent, offer at most $246k (1.6% below list).
- To meet the 1% rule (rent ≥ 1% of price), the offer needs to be $205k (18.2% below list).
- Recommended offer: $205k (18.2% below list) — sets the bar for 1% rule.
- Cap rate 6.2% vs local median 4.8% in Salisbury — meaningfully above typical; check what's discounted (condition, days-on-market, listing class) to confirm the premium yield is real.
Location & tenants
- Location reads 60/100 on livability (#351 in MD) — a middle-class / working-renter tenant base. Strengths: health & safety A+, cost of living A, housing A; Watch: crime F, amenities F, commute F.
- Wicomico County Public Schools (urban): math 16% / reading 26% proficiency, ranked #19 of 24 in MD (top 79%) — low school quality limits family demand, transient renter base, plan for 1-2y turnover.
- Zoned schools: East Salisbury Elementary (math 6% / reading 8%, grade F, #726 of 860 statewide, top 86%, 421 students, 70% FRL); Wicomico Middle (math 3% / reading 22%, grade F, #200 of 225 statewide, top 89%, 819 students, 68% FRL); Wicomico High (math 30% / reading 45%, grade F, #138 of 222 statewide, top 63%, 1,325 students, 60% FRL).
- Market conditions: Rents rising (+3.8%/yr); 195 active listings in the ZIP; 9 comparable units currently listed for rent nearby; rentals at typical pace (median 21d on market — plan ~3-4 weeks tenant-placement turnaround); 278 units permitted in Wicomico County in 2024 (44 in 5+ unit buildings).
- This rent runs 34% of the median local income ($73k/yr) — at the standard rent-burdened threshold; future hikes will face affordability resistance.
Forward outlook
- Local home prices are declining (-3.0%/yr); year-one equity from $2k of loan paydown is wiped out by about $8k of value loss. Plan a longer hold.
- Wicomico County population projected at +14% by 2050 — modest demand growth; plan on rents tracking national, not racing it.
Negotiation context
- It's been on market 29 days — a 2% lower offer ($246k) is reasonable based on typical stale-listing flexibility.
- 3 sale attempts since 8y ago with the ask held roughly flat each time — persistent listings suggest the price (not the market) is what's stuck; bring a comps-based counter.
- Current owner paid $161k; list at $250k implies a 56% gain — meaningful room to come down on a strong offer.
Questions for the listing agent
- What do current leases actually rent for vs. the listed asking? Can we see a recent rent roll and the last 12 months of T-12 income?
- What does the HOA fee cover, when was the last increase, and are there any pending special assessments or reserve-fund shortfalls?
- Is there a deadline driving the sale (1031 exchange, divorce, estate, relocation)? That informs how much negotiation room exists.
- Schools are D-rated, which usually means shorter tenancies and higher turnover. Who's the typical renter profile here, and what's been the actual vacancy rate?
- Crime grade is F in this area — have there been break-ins, vandalism, or insurance claims at this property in the last 3 years? What carrier currently insures it and at what premium?
- The area grade is low — what's the realistic commute time and amenity access for the typical tenant pool here? Any planned neighborhood developments (good or bad) we should know about?
- What's the average days-on-market for RENTAL listings here right now (not sales)? A rising rental-DOM trend means longer vacancies and softer asking-rent achievability than the comps imply.
- What's the recent tenant-quality profile in this submarket — average credit score on applications, eviction rate, late-payment / NSF rate, and stable-employment percentage? A property-management company in the area should have these aggregated.
- How much new for-sale + rental construction is in the pipeline within 1–3 miles? Heavy new supply typically softens prices + rents 12–24 months out; constrained supply supports both.
Investment metrics
- 1% rule
- 0.82% ✗
- Cap rate
- 6.18%
- Cash-on-cash
- -0.39%
- DSCR
- 0.98
- GRM
- 10.2
CMA / ARV
- ARV (on-the-fly)
- $238,560
- Comps found
- 4
Show comp detail 4 sales within ~0.75 mi
| Address | Dist | Beds/Ba | Sqft | Sold | Price | $/sf | Match |
|---|---|---|---|---|---|---|---|
| 442 Creekbed Cir | 0.00mi | 3/2.5 | 1,420 (0%) | 11mo | $202,500 | $143 | 91 |
| 427 Creekbed Cir | 0.04mi | 3/2.5 | 1,420 (0%) | 17mo | $265,000 | $187 | 84 |
| 417 Stream Valley Ct | 0.15mi | 3/2.5 | 1,530 (+8%) | 12mo | $247,000 | $161 | 70 |
| 304 Stream Valley Ct | 0.23mi | 3/2.5 | 1,530 (+8%) | 9mo | $257,500 | $168 | 69 |
Match score weights: distance 35% · size 25% · config 20% · recency 20%. Top-matched comps best support the ARV.
Projected returns pro-forma
-3.0% appreciation · 3.78% rent growth · sell at horizon
- IRR
- -16.1%
- Equity multiple
- 0.42×
- Total profit
- $-40,359
- Equity at exit
- $37,276
- IRR
- -6.6%
- Equity multiple
- 0.57×
- Total profit
- $-30,353
- Equity at exit
- $21,615
Cash invested: $70,000 (down + closing). Projections, not guarantees.
Landlord ↔ Tenant lean methodology
- Overall (STATE)
- 27 Tenant-Leaning
- State Maryland
- 27 Tenant-Leaning · D+14
- County
- — inherits STATE
- City
- — inherits STATE
ZIP-level market 21804
- Home prices YoY
- -26.7%
- Rents YoY
- 3.8%
- Active inventory
- 195
- Price-to-rent
- 10.2×
Monthly cashflow live
- Estimated rent
- $2,046 high interval (Pro) →
- Mortgage (P&I)
- −$1,311
- Tax from tax record
- −$133 /mo · $1,602/yr
- Insurance
- −$104
- HOA
- −$90
- Vacancy / Maint / Mgmt
- −$430
- Net cashflow
- $-23
Break-even live
UW: 25.0% down · 7.5% · 30yr · 1.5% tax · 5.0% vac · 8.0% maint · 8.0% mgmt
Financing live
Cash to close
- Down payment
- $62,500
- Closing costs
- $7,500
- Reserves months
- —
- Total cash needed
- —
Loan-product check · same deal, 3 products live
Conventional
25% down · 7.5% · 30yr
- Down + closing
- —
- Monthly P&I
- —
- Monthly cashflow
- —
- DSCR
- —
- Eligible?
- —
Personal DTI + credit; lowest rate.
DSCR
20% down · 8.5% · 30yr
- Down + closing
- —
- Monthly P&I
- —
- Monthly cashflow
- —
- DSCR
- —
- Eligible?
- —
No personal income docs; deal must DSCR.
Hard money
10% down · 12.0% · 12mo
- Down + closing
- —
- Monthly P&I
- —
- Monthly cashflow
- —
- DSCR
- —
- Eligible?
- —
Short-term bridge; refi at stabilization.
Rent comps 9 comps
| Address | Beds | Baths | Sqft | Rent | $/sqft | DOM | Units | Dist |
|---|---|---|---|---|---|---|---|---|
| 309 Stream Valley Ct Salisbury, MD | 3.0 | 2.5 | 1530 | $2,295 | $1.50 | 20d | 1 | 0.21mi |
| 130 Ocean Aisle Cir Salisbury, MD | 2.0–3.0 | 2.0 | 1388 | $2,299 | $1.66 | 13d | 16 | 0.91mi |
| 1500 Sharen Dr Salisbury, MD | 1.0–3.0 | 1.0–2.0 | 946 | $1,800 | $1.90 | 13d | 1 | 1.05mi |
| 228 Clement Loop Salisbury, MD | 3.0 | 2.5 | 1600 | $2,350 | $1.47 | 13d | 1 | 1.14mi |
| 929 Johnson St Salisbury, MD | 2.0 | 1.0 | 988 | $1,400 | $1.42 | 20d | 1 | 1.15mi |
| 411 Dover St Salisbury, MD | 3.0 | 2.0 | 984 | $1,600 | $1.63 | 43d | 1 | 1.24mi |
| 604 Liberty St Salisbury, MD | 3.0 | 1.0 | 1110 | $1,500 | $1.35 | 43d | 1 | 1.29mi |
| 906 Johnson St Salisbury, MD | 3.0 | 1.5 | 875 | $1,495 | $1.71 | 43d | 1 | 1.29mi |
| 821 Johnson St Salisbury, MD | 2.0 | 1.0 | 939 | $1,495 | $1.59 | 13d | 1 | 1.34mi |
HOA detail
- Monthly dues
- $90 · $1,080/yr
- Likely covers
- landscaping
Listing history 27 events
-
2026-06-18days on market $250,000 Active 29 DOM
-
2026-06-17days on market $250,000 Active 28 DOM
-
2026-06-16days on market $250,000 Active 27 DOM
-
2026-06-15price $250,000 Active 26 DOM
-
2026-06-15days on market $255,500 Active 26 DOM
-
2026-06-14days on market $255,500 Active 24 DOM
-
2026-06-13days on market $255,500 Active 23 DOM
-
2026-06-10days on market $255,500 Active 21 DOM
-
2026-06-09days on market $255,500 Active 20 DOM
-
2026-06-08days on market $255,500 Active 19 DOM
-
2026-06-07days on market $255,500 Active 18 DOM
-
2026-06-03days on market $255,500 Active 14 DOM
-
2026-06-02days on market $255,500 Active 13 DOM
-
2026-06-01days on market $255,500 Active 12 DOM
-
2026-05-31days on market $255,500 Active 11 DOM
-
2026-05-30days on market $255,500 Active 10 DOM
-
2026-05-21status Active
-
2026-03-23historical
-
2026-03-23$255,500 Active
-
2026-03-11historical $255,500
-
2019-05-14historical 540-char remark
Show marketing remark (540 chars)
The best-selling Jefferson townhome design features 3 bedrooms and 2.5 bathrooms. Offering up to $10,000 in closing costs! You will love this open concept floorplan featuring an over-sized peninsula in the kitchen, 9' ceilings on the main level and stainless steel appliances. These move in ready homes include full lawn care and irrigation, ceiling fan rough ins in master and living room, two parking spaces outside your door, LED lighting and a walk in closet in the owner's suite. Visit us today to see how you can make this home yours.
-
2019-05-14soldstatus $160,705 Closed 540-char remark
Show marketing remark (540 chars)
The best-selling Jefferson townhome design features 3 bedrooms and 2.5 bathrooms. Offering up to $10,000 in closing costs! You will love this open concept floorplan featuring an over-sized peninsula in the kitchen, 9' ceilings on the main level and stainless steel appliances. These move in ready homes include full lawn care and irrigation, ceiling fan rough ins in master and living room, two parking spaces outside your door, LED lighting and a walk in closet in the owner's suite. Visit us today to see how you can make this home yours.
-
2019-04-17status Pending 540-char remark
Show marketing remark (540 chars)
The best-selling Jefferson townhome design features 3 bedrooms and 2.5 bathrooms. Offering up to $10,000 in closing costs! You will love this open concept floorplan featuring an over-sized peninsula in the kitchen, 9' ceilings on the main level and stainless steel appliances. These move in ready homes include full lawn care and irrigation, ceiling fan rough ins in master and living room, two parking spaces outside your door, LED lighting and a walk in closet in the owner's suite. Visit us today to see how you can make this home yours.
-
2019-03-26price $160,705 540-char remark
Show marketing remark (540 chars)
The best-selling Jefferson townhome design features 3 bedrooms and 2.5 bathrooms. Offering up to $10,000 in closing costs! You will love this open concept floorplan featuring an over-sized peninsula in the kitchen, 9' ceilings on the main level and stainless steel appliances. These move in ready homes include full lawn care and irrigation, ceiling fan rough ins in master and living room, two parking spaces outside your door, LED lighting and a walk in closet in the owner's suite. Visit us today to see how you can make this home yours.
-
2018-12-20$162,705 Active 540-char remark
Show marketing remark (540 chars)
The best-selling Jefferson townhome design features 3 bedrooms and 2.5 bathrooms. Offering up to $10,000 in closing costs! You will love this open concept floorplan featuring an over-sized peninsula in the kitchen, 9' ceilings on the main level and stainless steel appliances. These move in ready homes include full lawn care and irrigation, ceiling fan rough ins in master and living room, two parking spaces outside your door, LED lighting and a walk in closet in the owner's suite. Visit us today to see how you can make this home yours.
-
2018-08-24soldstatus $270,000
-
2014-01-31soldstatus $344,962
ⓘ Source: listings_history table (triggers on properties + properties_extension) + one-shot
backfill from property_details.listing_events for pre-trigger history.
Tax reassessment forecast MD · Partial reset (capped growth)
- Current annual tax
- $1,602 · $133/mo
- Projected year-2 tax
- $2,163 · $180/mo
- Expected delta
- +$562/yr (+$47/mo · 35.1%)
ⓘ Screening estimate from a state-policy table — verify with the county assessor before closing.
Nearby sold comps map
Loading sold comps map…
Walkable amenities ~0.75 mi
Loading nearby amenities…
Taxation est. · year 1
- Rental income
- $24,547
- − Mortgage interest
- −$14,004
- − Property taxes
- −$1,602
- − Insurance
- −$1,250
- − Repairs & maintenance
- −$1,964
- − Management
- −$1,964
- − HOA
- −$1,080
- − Depreciation
- −$7,273
- Taxable loss
- −$4,589
- Est. tax savings @ 24.0%
- +$1,101
- After-tax cash flow
- $830/yr
For passive investors: Depreciation is non-cash, so a rental often shows a tax loss while cash-flowing — sheltering income. Rental losses are passive: they offset passive income freely, and up to $25,000/yr can offset ordinary (W-2) income if you actively participate and your MAGI is under $100k (phasing out to $0 by $150k); unused losses carry forward. On sale, claimed depreciation is recaptured at up to 25%, and gains may owe capital-gains tax (a 1031 exchange can defer both). Figures are a year-1 estimate at your 24.0% rate — not tax advice; consult a CPA.
Schools (NCES district)
- District
- Wicomico County Public Schools
- NCES district ID
- 2400690
- Math proficiency
- 16% ▼ -18.00%
- Reading proficiency
- 26% ▼ -13.00%
- Median HH income
- $51,745
- Composite
- 18.87/100
- National rank
- #8860
- State rank
- #19 of 24 in MD
Livability — Salisbury
- Score
- 60/100
- State rank
- #351
- US rank
- #18948
Category grades
Schools grade is shown separately in the Schools card above.
Census & demographics
- Census place
- Salisbury, MD
- County
- Wicomico County · 75,969 people
- City population
- 70,518
- Metro
- Salisbury, MD-DE
- Population (ZIP)
- 40,430
- Household income
- $73,156
- Rent vs Own
- Severe rent burden
- 2096.0
Population outlook (Wicomico County) Hauer SSP2
- Today (2025)
- 108,548 people
- By 2030
- 111,783 · +3.0%
- By 2040
- 118,139 · +8.8%
- By 2050
- 123,641 · +13.9%
- By 2075
- 139,784 · +28.8%
- By 2100
- 145,334 · +33.9%
Race, ethnicity, and origin ACS 2023
- Neighborhood character
- Diverse neighborhood (Simpson 0.61)
- Race & ethnicity
- White 54% Black 30% Two or more races 9% Hispanic / Latino 7% Asian 3%
- Hispanic origin (detail)
- Mexican 4% Dominican 1%
- Common ancestry
- Hispanic 8% Romanian 3% Slovak 1%
- Foreign-born
- 13% · Canada, Vietnam, South Korea
- Languages at home
- 83% English-only · French/Haitian/Cajun 7% Spanish 5% Other Indo-European 2%
Political lean MEDSL · Wicomico
- 2024 margin
- Lean R (+5.5) · D 46.1% · R 51.5% · Other 2.4%
- 2008→2024 swing
- +0.3pp no change · 2008: -5.8pp · 2024: -5.5pp
- All cycles
- 2024: R+5.5 2020: R+1.9 2016: R+11.6 2012: R+6.9 2008: R+5.8
Not yet ingested
- Civics
- —
Market trends
- HPI YoY
- ▼ -84.15%
- Current HPI
- 230.6099
- Rent YoY
- ▲ 3.78%
- Metro
- Salisbury, MD-DE
- State GDP YoY
- ▲ 2.97%
- F500 in state
- 12
Industry mix (Fortune 500 HQ in MD)
| Industry | F500 HQs | Revenue |
|---|---|---|
| Aerospace / Defense | 1 | $71B |
|
||
| Utilities | 1 | $25B |
|
||
| Hotels | 1 | $24B |
|
||
| Consumer Goods | 1 | $7B |
|
||
| Real Estate | 1 | $6B |
|
||
| Chemicals | 1 | $2B |
|
||
Price history
-25.9% since first listed11 events — show timeline
- 2026-05-21 Relisted — BRIGHT MLS
- 2026-03-23 Listing Removed — BRIGHT MLS
- 2026-03-23 Listed $255,500 BRIGHT MLS
- 2026-03-11 Coming Soon $255,500 BRIGHT MLS
- 2019-05-14 Listing Removed — BRIGHT MLS
- 2019-05-14 Sold (MLS) $160,705 BRIGHT MLS
- 2019-04-17 Pending — BRIGHT MLS
- 2019-03-26 Price Changed $160,705 BRIGHT MLS
- 2018-12-20 Listed $162,705 BRIGHT MLS
- 2018-08-24 Sold (Public Records) $270,000 Public Records
- 2014-01-31 Sold (Public Records) $344,962 Public Records
Property tax history
+15.1%/yrLatest (2025): $1,602 · +1.6% YoY. Source: county tax records.
Cash-flow waterfall
monthlySold comps — $/sqft
last 12 mo · ≤1 miLoading sold comps…