63 Grace St · San Francisco, CA
Flood risk 1/10 · Minimal
- FEMA flood zone
- X (unshaded)
- Chance of flooding over 30 yrs
- 0.0%
- Est. flood insurance / yr
- $507 – $1,088
Fire risk 1/10 · Minimal
- Est. fire insurance / yr
- $659 – $1,223
Heat risk 2/10 · Minimal
- Hot days now (above 78°F)
- 8 days/yr
- Hot days in 30 yrs
- 17 days/yr
Wind risk 1/10 · Minimal
- Chance of severe wind over 30 yrs
- —
Air-quality risk 8/10 · Major
- Unhealthy air days now
- 15 days/yr
- Unhealthy air days in 30 yrs
- 15 days/yr
Risk factors via First Street. Map © Google.
Why this score? — see what drove the C- grade
The composite is a weighted blend of 9 inputs, each scored 0–100. Each bar is that input's sub-score; the figure is the points it added to the 100-point composite (weight × sub-score).
- Cash flow +13.2/30.0
- ARV discount +7.5/15.0
- Appreciation +7.5/10.0
- 1% rule +5.4/10.0
- Rent growth +5.0/5.0
- Schools +5.0/10.0
- DSCR +4.0/10.0
- Livability +3.8/5.0
- Condition / age +2.5/5.0
$379,000
🖨 Deal sheet 📄 Offer letter ✓ Due diligence
Listing remarks MLS
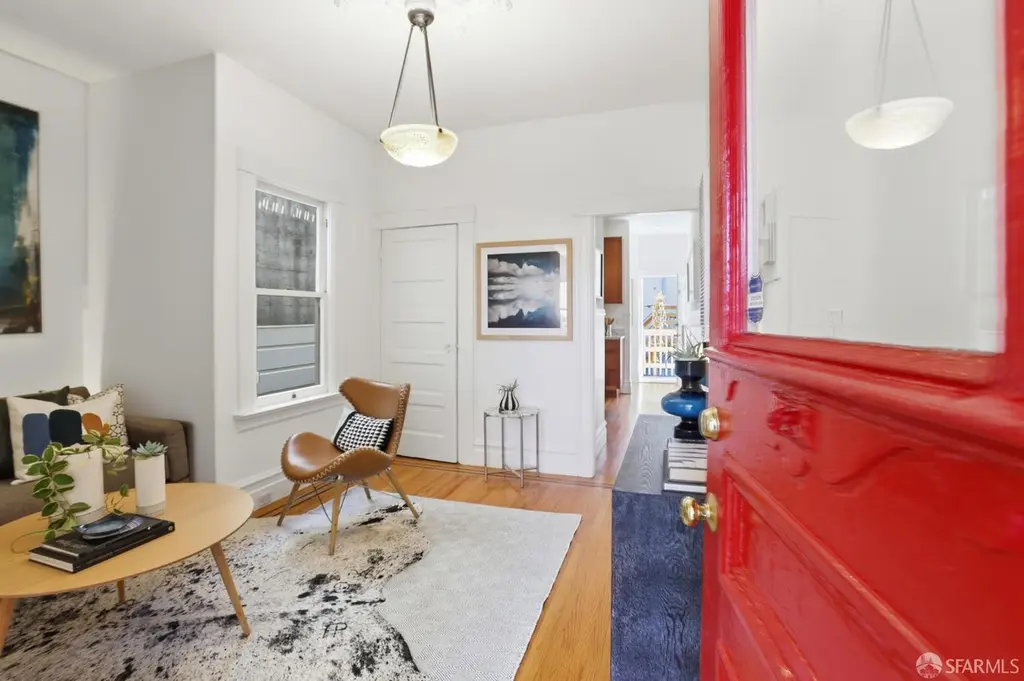
Enjoy all that vibrant SoMa has to offer in this charming, top-floor Edwardian condo. Featuring a remodeled eat-in kitchen with stainless-steel appliances and marble countertops, the unit also has an updated bath with marble flooring and pedestal sink. You'll love the high ceilings and wainscoting throughout. Additional amenities include hardwood floors, in-unit laundry, and city view roof deck. Tucked-away Grace Street is a stone's throw from many popular tech companies, awesome restaurants, markets, theatres, transit lines, tech shuttle stops and easy freeway access. It also boasts a 98 Walk Score, 100 Rider's Paradise transit score and a 98 Biker's Paradise score.
Key facts
- Shared roof deck
- 360-degree views
- $510 HOA
Tags
Neighborhood map
What this means for you Summary
Snapshot
- This is a 1-bed/1.0-bath condo listed at $379k.
Deal economics
- At list price, monthly cash flow is $-7 ($-86/yr) — negative.
- To cash-flow at today's rent, offer at most $378k (0.3% below list).
- Meets the 1% rule at list price ($4k rent vs $379k).
- Recommended offer: $378k (0.3% below list) — sets the bar for cash-flow.
- Cap rate 6.3% vs local median 2.1% in San Francisco — top-decile yield for the area; either an underpriced asset or a hidden risk that comps aren't pricing in. Stress-test before assuming the spread holds.
Location & tenants
- Location reads 76/100 on livability (#90 in CA, #3,143 nationally) — a middle-class / working-renter tenant base. Strengths: amenities A+, commute A+, employment A+; Watch: crime F, cost of living F.
- San Francisco Unified (urban): math 50% / reading 56% proficiency, ranked #322 of 1,400 in CA (top 23%) — acceptable for families but not a draw, mixed tenant base, ~2y average lease.
- Market conditions: Rents rising fast (+15.5%/yr); 108 active listings in the ZIP; 40 comparable units currently listed for rent nearby; rentals leasing fast (median 3d on market — plan ~1-2 weeks tenant-placement turnaround); high-income renter base; 750 units permitted in San Francisco County in 2024 (688 in 5+ unit buildings).
- This rent runs 41% of the median local income ($116k/yr) — at the standard rent-burdened threshold; future hikes will face affordability resistance.
Forward outlook
- In year one you build about $21k of equity ($3k loan paydown + $19k appreciation (5.0% local appreciation)).
- San Francisco County population projected at +39% by 2050 — long-run rental-demand tailwind backs the buy-and-hold thesis.
- At projected returns (5.0% appreciation + 8.0% rent growth), your $106k cash investment doubles in ~4 years — after that, you're playing with house money.
- By year 2, paydown + projected appreciation supports a ~$34k cash-out refi (75% LTV) — recoverable capital for the next deal without selling this one.
Negotiation context
- Only 5 days on market — expect competitive offers; lowballing is unlikely to land.
- 3 sale attempts since 32y ago with the ask held roughly flat each time — persistent listings suggest the price (not the market) is what's stuck; bring a comps-based counter.
Risks & watch-outs
- Watch-outs: built in 1911 — expect roof / HVAC / electrical / plumbing capex.
Questions for the listing agent
- What do current leases actually rent for vs. the listed asking? Can we see a recent rent roll and the last 12 months of T-12 income?
- Built in 1911 — when were the roof, HVAC, electrical panel, plumbing, and water heater last replaced?
- What does the HOA fee cover, when was the last increase, and are there any pending special assessments or reserve-fund shortfalls?
- Any open or pending special assessments — roof, HVAC, plumbing, elevator, façade? What's the per-unit balance and payoff schedule, and is the seller paying it off at close or rolling it to the buyer?
- Is there a deadline driving the sale (1031 exchange, divorce, estate, relocation)? That informs how much negotiation room exists.
- Schools are B-rated — typically a magnet for longer-tenancy family renters. What's the average tenant stay here, and is there a school-zone premium baked into asking?
- Crime grade is F in this area — have there been break-ins, vandalism, or insurance claims at this property in the last 3 years? What carrier currently insures it and at what premium?
- What's the average days-on-market for RENTAL listings here right now (not sales)? A rising rental-DOM trend means longer vacancies and softer asking-rent achievability than the comps imply.
- What's the recent tenant-quality profile in this submarket — average credit score on applications, eviction rate, late-payment / NSF rate, and stable-employment percentage? A property-management company in the area should have these aggregated.
- How much new apartment / multifamily construction is in the pipeline within 1–3 miles? Heavy new supply (>2% of stock underway) typically softens rents 12–24 months out; light construction supports rent growth.
Investment metrics
- 1% rule
- 1.04% ✓
- Cap rate
- 6.27%
- Cash-on-cash
- -0.08%
- DSCR
- 1.00
- GRM
- 8.0
CMA / ARV
No comps found within radius.
Projected returns pro-forma
4.96% appreciation · 8.0% rent growth · sell at horizon
- IRR
- 15.5%
- Equity multiple
- 2.01×
- Total profit
- $107,247
- Equity at exit
- $213,911
- IRR
- 18.4%
- Equity multiple
- 4.54×
- Total profit
- $375,652
- Equity at exit
- $368,470
Cash invested: $106,120 (down + closing). Projections, not guarantees.
Landlord ↔ Tenant lean methodology
- Overall (CITY)
- 0 Strongly Tenant-Friendly
- State California
- 18 Strongly Tenant-Friendly · D+13
- County
- — inherits STATE
- City San Francisco
- 0 Strongly Tenant-Friendly · D+57
ZIP-level market 94103
- Home prices YoY
- 2.9%
- Rents YoY
- 15.5%
- Active inventory
- 108
- Price-to-rent
- 8.0×
Monthly cashflow live
- Estimated rent
- $3,935 high interval (Pro) →
- Mortgage (P&I)
- −$1,988
- Tax from tax record
- −$460 /mo · $5,524/yr
- Insurance
- −$158
- HOA
- −$510
- Vacancy / Maint / Mgmt
- −$826
- Net cashflow
- $-7
Break-even live
UW: 25.0% down · 7.5% · 30yr · 1.5% tax · 5.0% vac · 8.0% maint · 8.0% mgmt
Financing live
Cash to close
- Down payment
- $94,750
- Closing costs
- $11,370
- Reserves months
- —
- Total cash needed
- —
Loan-product check · same deal, 3 products live
Conventional
25% down · 7.5% · 30yr
- Down + closing
- —
- Monthly P&I
- —
- Monthly cashflow
- —
- DSCR
- —
- Eligible?
- —
Personal DTI + credit; lowest rate.
DSCR
20% down · 8.5% · 30yr
- Down + closing
- —
- Monthly P&I
- —
- Monthly cashflow
- —
- DSCR
- —
- Eligible?
- —
No personal income docs; deal must DSCR.
Hard money
10% down · 12.0% · 12mo
- Down + closing
- —
- Monthly P&I
- —
- Monthly cashflow
- —
- DSCR
- —
- Eligible?
- —
Short-term bridge; refi at stabilization.
Rent comps 40 comps
| Address | Beds | Baths | Sqft | Rent | $/sqft | DOM | Units | Dist |
|---|---|---|---|---|---|---|---|---|
| 1288 Howard St #1908 San Francisco, CA | 1.0–2.0 | 1.0–2.0 | 782 | $4,190 | $5.35 | 1d | 2 | 0.06mi |
| 1288 Howard St #604 San Francisco, CA | 1.0 | 1.0 | 431 | $3,400 | $7.89 | 43d | 1 | 0.07mi |
| 55 9th St San Francisco, CA | 2.0 | 1.0–2.0 | 861 | $4,430 | $5.14 | 2d | 1 | 0.15mi |
| 18 10th St #1315 San Francisco, CA | — | 1.0 | 479 | $4,463 | $9.31 | 3d | 2 | 0.18mi |
| 1190 Mission St San Francisco, CA | 1.0 | 1.0 | 508 | $3,136 | $6.17 | 1d | 5 | 0.21mi |
| 8 10th St San Francisco, CA | 2.0 | 1.0–2.0 | 919 | $6,104 | $6.64 | 2d | 28 | 0.21mi |
| 33 8th St San Francisco, CA | 1.0–2.0 | 1.0 | 646 | $3,744 | $5.79 | 2d | 10 | 0.22mi |
| 1188 Mission St San Francisco, CA | 1.0 | 1.0 | 448 | $3,269 | $7.29 | 1d | 17 | 0.24mi |
| 1390 Market St San Francisco, CA | 1.0 | 1.0 | 561 | $4,067 | $7.25 | 1d | 14 | 0.24mi |
| 1 Polk St San Francisco, CA | 1.0 | 1.0 | 773 | $4,644 | $6.00 | 2d | 4 | 0.26mi |
| 1222 Harrison St San Francisco, CA | 2.0 | 1.0–2.5 | 853 | $4,798 | $5.62 | 2d | 34 | 0.28mi |
| 99 Rausch St San Francisco, CA | 1.0 | 1.0 | 655 | $4,250 | $6.49 | 24d | 1 | 0.29mi |
| 101 Polk St San Francisco, CA | 1.0 | 1.0 | 573 | $4,614 | $8.04 | 2d | 7 | 0.30mi |
| 603 Natoma St Apt 406 San Francisco, CA | 1.0 | 1.0 | 556 | $2,950 | $5.31 | 43d | 1 | 0.30mi |
| 100 Van Ness Ave #1477 San Francisco, CA | 1.0–2.0 | 1.0–2.0 | 893 | $5,940 | $6.65 | 1d | 2 | 0.30mi |
| 30 Otis St San Francisco, CA | 2.0 | 1.0–2.0 | 874 | $6,956 | $7.95 | 2d | 13 | 0.31mi |
| 150 Van Ness Ave #1475 San Francisco, CA | 1.0 | 1.0 | 615 | $5,510 | $8.96 | 20d | 1 | 0.32mi |
| 1532 Harrison St San Francisco, CA | 2.0 | 1.0–2.0 | 617 | $3,984 | $6.46 | 2d | 11 | 0.32mi |
| 1 Brady St San Francisco, CA | 2.0 | 1.0–2.0 | 889 | $5,557 | $6.25 | 1d | 29 | 0.38mi |
| 1075 Market St San Francisco, CA | 1.0 | 1.0 | 546 | $3,500 | $6.40 | 24d | 2 | 0.41mi |
| 1075 Market St #461 San Francisco, CA | 1.0 | 1.0 | 648 | $3,460 | $5.34 | 20d | 1 | 0.42mi |
| 225 Fell St San Francisco, CA | 1.0 | 1.0 | 512 | $4,495 | $8.77 | 7d | 3 | 0.42mi |
| 1075 Market St #603 San Francisco, CA | — | 1.0 | 445 | $3,300 | $7.42 | 7d | 1 | 0.42mi |
| 179 Oak St Apt F San Francisco, CA | — | 1.0 | 500 | $2,495 | $4.99 | 7d | 1 | 0.44mi |
| 305 Franklin St Unit 21 San Francisco, CA | — | 1.0 | 450 | $2,795 | $6.21 | 7d | 1 | 0.45mi |
| 570 Jessie St San Francisco, CA | — | 1.0 | 430 | $2,495 | $5.80 | 2d | 1 | 0.45mi |
| 975 Bryant St San Francisco, CA | 2.0 | 1.0–2.0 | 697 | $4,814 | $6.91 | 1d | 10 | 0.46mi |
| 84 Harriet St Unit A San Francisco, CA | 1.0 | 1.0 | 718 | $3,295 | $4.59 | 20d | 1 | 0.46mi |
| 1699 Market St San Francisco, CA | 1.0 | 1.0 | 561 | $4,817 | $8.59 | 2d | 5 | 0.47mi |
| 50 Jones St San Francisco, CA | 1.0 | 1.0 | 471 | $3,397 | $7.21 | 3d | 9 | 0.48mi |
| 68 McCoppin St San Francisco, CA | 1.0 | 1.0 | 734 | $3,825 | $5.21 | 16d | 2 | 0.49mi |
| 1028 Market St San Francisco, CA | 2.0 | 1.0 | 526 | $4,090 | $7.77 | 1d | 6 | 0.50mi |
| 285 Turk St Apt 507 San Francisco, CA | 1.0 | 1.0 | 462 | $1,795 | $3.89 | 43d | 1 | 0.53mi |
| 855 Brannan St San Francisco, CA | 3.0 | 1.0–2.0 | 958 | $5,133 | $5.36 | 1d | 5 | 0.57mi |
| 325 Octavia St San Francisco, CA | 2.0 | 1.0–2.0 | 811 | $6,909 | $8.52 | 2d | 1 | 0.57mi |
| 1801 Mission St San Francisco, CA | 1.0 | 1.0 | 446 | $10,000 | $22.42 | 43d | 1 | 0.57mi |
| 601 Van Ness Ave San Francisco, CA | 1.0 | 1.0 | 653 | $3,795 | $5.81 | 10d | 2 | 0.58mi |
| 434 Minna St San Francisco, CA | 2.0 | 1.0–2.0 | 719 | $5,246 | $7.29 | 1d | 15 | 0.60mi |
| 960 Market St San Francisco, CA | 1.0 | 1.0 | 613 | $4,295 | $7.01 | 21d | 1 | 0.61mi |
| 155 Haight St San Francisco, CA | — | 1.0 | 425 | $2,295 | $5.40 | 23d | 1 | 0.61mi |
HOA detail condo
- Monthly dues
- $510 · $6,120/yr
- Assessments
- None detected in remarks — confirm with the listing agent.
Listing history 7 events
-
2026-04-16status Pending
-
2026-04-11$379,000 Active
-
2017-10-16soldstatus $600,000 Closed 675-char remark
Show marketing remark (675 chars)
Enjoy all that vibrant SoMa has to offer in this charming, top-floor Edwardian condo. Featuring a remodeled eat-in kitchen with stainless-steel appliances and marble countertops, the unit also has an updated bath with marble flooring and pedestal sink. You'll love the high ceilings and wainscoting throughout. Additional amenities include hardwood floors, in-unit laundry, and city view roof deck. Tucked-away Grace Street is a stone's throw from many popular tech companies, awesome restaurants, markets, theatres, transit lines, tech shuttle stops and easy freeway access. It also boasts a 98 Walk Score, 100 Rider's Paradise transit score and a 98 Biker's Paradise score.
-
2017-10-05status Pending 675-char remark
Show marketing remark (675 chars)
Enjoy all that vibrant SoMa has to offer in this charming, top-floor Edwardian condo. Featuring a remodeled eat-in kitchen with stainless-steel appliances and marble countertops, the unit also has an updated bath with marble flooring and pedestal sink. You'll love the high ceilings and wainscoting throughout. Additional amenities include hardwood floors, in-unit laundry, and city view roof deck. Tucked-away Grace Street is a stone's throw from many popular tech companies, awesome restaurants, markets, theatres, transit lines, tech shuttle stops and easy freeway access. It also boasts a 98 Walk Score, 100 Rider's Paradise transit score and a 98 Biker's Paradise score.
-
2017-10-04historical Contingent - Show 675-char remark
Show marketing remark (675 chars)
Enjoy all that vibrant SoMa has to offer in this charming, top-floor Edwardian condo. Featuring a remodeled eat-in kitchen with stainless-steel appliances and marble countertops, the unit also has an updated bath with marble flooring and pedestal sink. You'll love the high ceilings and wainscoting throughout. Additional amenities include hardwood floors, in-unit laundry, and city view roof deck. Tucked-away Grace Street is a stone's throw from many popular tech companies, awesome restaurants, markets, theatres, transit lines, tech shuttle stops and easy freeway access. It also boasts a 98 Walk Score, 100 Rider's Paradise transit score and a 98 Biker's Paradise score.
-
2017-09-22$579,000 Active 675-char remark
Show marketing remark (675 chars)
Enjoy all that vibrant SoMa has to offer in this charming, top-floor Edwardian condo. Featuring a remodeled eat-in kitchen with stainless-steel appliances and marble countertops, the unit also has an updated bath with marble flooring and pedestal sink. You'll love the high ceilings and wainscoting throughout. Additional amenities include hardwood floors, in-unit laundry, and city view roof deck. Tucked-away Grace Street is a stone's throw from many popular tech companies, awesome restaurants, markets, theatres, transit lines, tech shuttle stops and easy freeway access. It also boasts a 98 Walk Score, 100 Rider's Paradise transit score and a 98 Biker's Paradise score.
-
1994-01-15$279,500
ⓘ Source: listings_history table (triggers on properties + properties_extension) + one-shot
backfill from property_details.listing_events for pre-trigger history.
Tax reassessment forecast CA · Resets to sale price
- Current annual tax
- $5,524 · $460/mo
- Projected year-2 tax
- $5,524 · $460/mo
- Expected delta
- $0/yr ($0/mo · 0.0%)
ⓘ Screening estimate from a state-policy table — verify with the county assessor before closing.
Climate risk First Street
- Flood 1/10 Low FEMA zone X (unshaded) · 0% chance over 30 yrs
- Wildfire 1/10 Low
- Heat 2/10 Low 8 d/yr ≥78°F today · 17 d/yr by 30 yrs out
- Wind 1/10 Low
- Air quality 8/10 Severe 15 unhealthy d/yr today · 15 by 30 yrs out
Nearby sold comps map
Loading sold comps map…
Walkable amenities ~0.75 mi
Loading nearby amenities…
Taxation est. · year 1
- Rental income
- $47,219
- − Mortgage interest
- −$21,230
- − Property taxes
- −$5,524
- − Insurance
- −$1,895
- − Repairs & maintenance
- −$3,778
- − Management
- −$3,778
- − HOA
- −$6,120
- − Depreciation
- −$11,025
- Taxable loss
- −$6,130
- Est. tax savings @ 24.0%
- +$1,471
- After-tax cash flow
- $1,385/yr
For passive investors: Depreciation is non-cash, so a rental often shows a tax loss while cash-flowing — sheltering income. Rental losses are passive: they offset passive income freely, and up to $25,000/yr can offset ordinary (W-2) income if you actively participate and your MAGI is under $100k (phasing out to $0 by $150k); unused losses carry forward. On sale, claimed depreciation is recaptured at up to 25%, and gains may owe capital-gains tax (a 1031 exchange can defer both). Figures are a year-1 estimate at your 24.0% rate — not tax advice; consult a CPA.
Schools (NCES district)
- District
- San Francisco Unified
- NCES district ID
- 0634410
- Math proficiency
- 50% ▬ 0.00%
- Reading proficiency
- 56% ▲ 1.00%
- Median HH income
- $81,249
- Composite
- 50.14/100
- National rank
- #4088
- State rank
- #322 of 1400 in CA
Livability — San Francisco
- Score
- 76/100
- State rank
- #90
- US rank
- #3143
Category grades
Schools grade is shown separately in the Schools card above.
Census & demographics
- Census place
- San Francisco, CA
- County
- San Francisco County · 827,552 people
- City population
- 827,552
- Metro
- San Francisco-Oakland-Berkeley, CA
- Population (ZIP)
- 34,964
- Household income
- $116,438
- Rent vs Own
- Severe rent burden
- 2666.0
Population outlook (San Francisco County) Hauer SSP2
- Today (2025)
- 1,030,936 people
- By 2030
- 1,110,409 · +7.7%
- By 2040
- 1,270,010 · +23.2%
- By 2050
- 1,435,001 · +39.2%
- By 2075
- 1,779,074 · +72.6%
- By 2100
- 1,966,767 · +90.8%
Race, ethnicity, and origin ACS 2023
- Neighborhood character
- Highly diverse neighborhood (Simpson 0.75)
- Race & ethnicity
- White 32% Asian 31% Hispanic / Latino 20% Two or more races 11% Black 10% Native American 2%
- Hispanic origin (detail)
- Mexican 11%
- Common ancestry
- Lithuanian 2% Slovak 2% Romanian 2%
- Foreign-born
- 36% · Canada, China, Vietnam
- Languages at home
- 56% English-only · Spanish 16% Chinese 9% Tagalog/Filipino 6%
Political lean MEDSL · San Francisco
- 2024 margin
- Solid D (+64.8) · D 80.3% · R 15.5% · Other 4.1%
- 2008→2024 swing
- -5.7pp toward R · 2008: 70.5pp · 2024: 64.8pp
- All cycles
- 2024: D+64.8 2020: D+72.5 2016: D+76.1 2012: D+70.2 2008: D+70.5
Not yet ingested
- Civics
- —
Market trends
- HPI YoY
- ▲ 4.96%
- Current HPI
- 175.4945
- Rent YoY
- ▲ 15.50%
- Metro
- San Francisco-Oakland-Berkeley, CA
- State GDP YoY
- ▲ 3.21%
- F500 in state
- 116
Industry mix (Fortune 500 HQ in CA)
| Industry | F500 HQs | Revenue |
|---|---|---|
| Technology | 27 | $1,492B |
|
||
| Financial Services | 3 | $174B |
|
||
| Retail | 3 | $44B |
|
||
| Insurance | 3 | $26B |
|
||
| Media / Entertainment | 2 | $115B |
|
||
| Pharmaceuticals / Biotech | 2 | $62B |
|
||
Price history
+35.6% since first listed7 events — show timeline
- 2026-04-16 Pending — San Francisco MLS
- 2026-04-11 Listed $379,000 San Francisco MLS
- 2017-10-16 Sold (MLS) $600,000 San Francisco MLS
- 2017-10-05 Pending — San Francisco MLS
- 2017-10-04 Contingent — San Francisco MLS
- 2017-09-22 Listed $579,000 San Francisco MLS
- 1994-01-15 Listed $279,500 San Francisco MLS
Property tax history
+0.9%/yrLatest (2025): $5,524 · +2.9% YoY. Source: county tax records.
Cash-flow waterfall
monthlySold comps — $/sqft
last 12 mo · ≤1 miLoading sold comps…