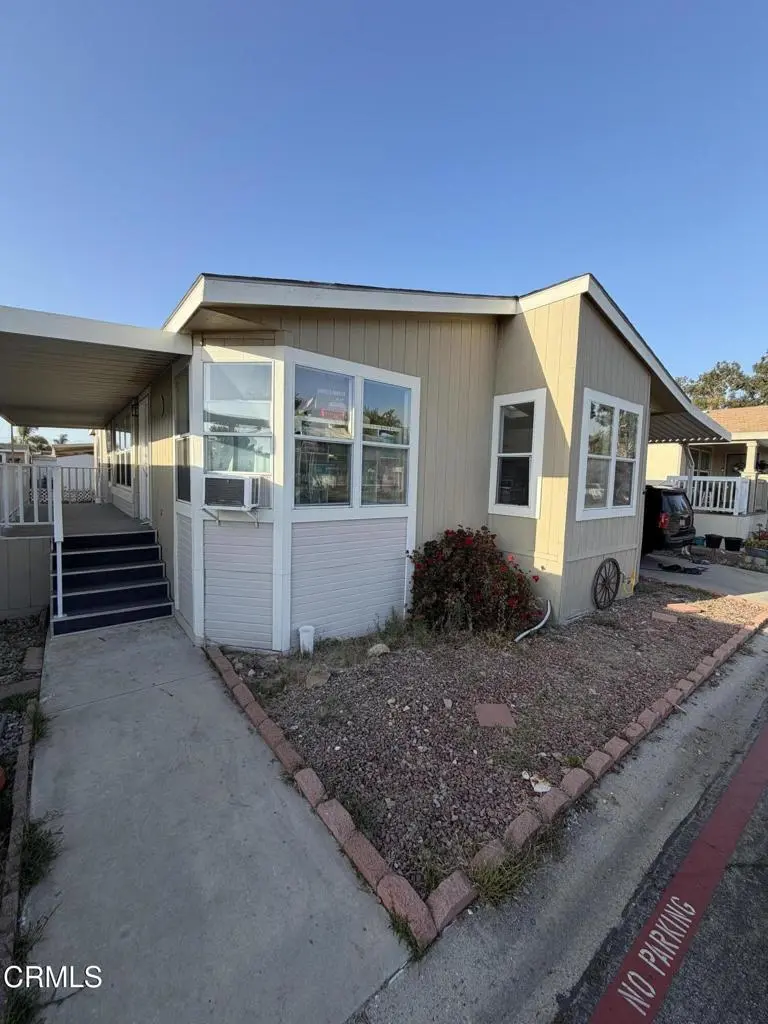
117 Calle Viejo #117 · Camarillo, CA
Flood risk 1/10 · Minimal
- FEMA flood zone
- X (unshaded)
- Chance of flooding over 30 yrs
- 0.0%
- Est. flood insurance / yr
- $507 – $1,088
Fire risk 4/10 · Minor
- Est. fire insurance / yr
- $659 – $1,223
Heat risk 4/10 · Minor
- Hot days now (above 94°F)
- 7 days/yr
- Hot days in 30 yrs
- 18 days/yr
Wind risk 1/10 · Minimal
- Chance of severe wind over 30 yrs
- —
Air-quality risk 3/10 · Minor
- Unhealthy air days now
- 4 days/yr
- Unhealthy air days in 30 yrs
- 4 days/yr
Risk factors via First Street. Map © Google.
Why this score? — see what drove the B grade
The composite is a weighted blend of 9 inputs, each scored 0–100. Each bar is that input's sub-score; the figure is the points it added to the 100-point composite (weight × sub-score).
- Cash flow +30.0/30.0
- 1% rule +10.0/10.0
- DSCR +10.0/10.0
- ARV discount +6.4/15.0
- Schools +4.6/10.0
- Livability +3.9/5.0
- Condition / age +3.8/5.0
- Rent growth +2.8/5.0
- Appreciation +0.0/10.0
$260,000
🖨 Deal sheet 📄 Offer letter ✓ Due diligence
Listing remarks
Beautifully remodeled home with open living area. All rooms painted, new tub in Master Bath. Large living room with fireplace. Excellent location in the park right across from the clubhouse, walk to pool and fitness center
Key facts
- Open living area
- Large living room
- Excellent location
Tags
Property features AI
Finance
- Other: Manager approval required for residency; Pets allowed with size limits; Community features include mountainous setting and park
- Financial info: Land lease: $2,075 per month (park)
- HOA & community: Park land lease in effect
Exterior
- Parking: Carport
- Utilities: Public sewer; District/public water
- Home design: Single-story; Mobile home (model SEP357B2) — mobile home remains; Located in Lamplighter MHP community
- Construction: Double body type (multi-unit/mobile home); Listed year built source: public records
- Exterior features: Partial fencing; Community pool; Sprinklers none
Interior
- Kitchen: Refrigerator included
- Flooring: Carpet; Laminate
- Bathrooms: 2 full bathrooms
- Heating & cooling: Forced air heating
- Interior features: High ceilings (9 feet or more); Open floor plan; Community spa access
- Laundry & utility: Washer included; Dryer included; On-site laundry available
Neighborhood map
What this means for you Summary
Snapshot
- This is a 3-bed/2.0-bath manufactured listed at $260k. Condition is rated good.
Deal economics
- At list price, monthly cash flow is $1k ($16k/yr) — positive.
- The deal already cash-flows at list — no discount required.
- Meets the 1% rule at list price ($4k rent vs $260k).
- Recommended offer: $256k (1.5% below list) — sets the bar for market timing.
- Cap rate 12.4% vs local median 2.5% in Camarillo — top-decile yield for the area; either an underpriced asset or a hidden risk that comps aren't pricing in. Stress-test before assuming the spread holds.
Location & tenants
- Location reads 78/100 on livability (#72 in CA, #2,776 nationally) — a middle-class / working-renter tenant base. Strengths: amenities A+, commute A+, employment A+; Watch: cost of living F.
- Pleasant Valley (urban): math 43% / reading 57% proficiency, ranked #119 of 517 in CA (top 23%) — acceptable for families but not a draw, mixed tenant base, ~2y average lease; only 20% free/reduced lunch — higher-income household profile.
- Market conditions: Rents rising (+1.2%/yr); 160 active listings in the ZIP; 11 comparable units currently listed for rent nearby; rentals leasing fast (median 2d on market — plan ~1-2 weeks tenant-placement turnaround); high-income renter base; 1,759 units permitted in Ventura County in 2024 (1,196 in 5+ unit buildings).
- This rent runs 35% of the median local income ($135k/yr) — at the standard rent-burdened threshold; future hikes will face affordability resistance.
Forward outlook
- Local home prices are declining (-3.0%/yr); year-one equity from $2k of loan paydown is wiped out by about $8k of value loss. Plan a longer hold.
- Ventura County population projected at +4% by 2050 — modest demand growth; plan on rents tracking national, not racing it.
- At projected returns (-3.0% appreciation + 1.2% rent growth), your $73k cash investment doubles in ~7 years — after that, you're playing with house money.
Negotiation context
- It's been on market 29 days — a 2% lower offer ($256k) is reasonable based on typical stale-listing flexibility.
Questions for the listing agent
- Is there a deadline driving the sale (1031 exchange, divorce, estate, relocation)? That informs how much negotiation room exists.
- Schools are B-rated — typically a magnet for longer-tenancy family renters. What's the average tenant stay here, and is there a school-zone premium baked into asking?
- What's the average days-on-market for RENTAL listings here right now (not sales)? A rising rental-DOM trend means longer vacancies and softer asking-rent achievability than the comps imply.
- What's the recent tenant-quality profile in this submarket — average credit score on applications, eviction rate, late-payment / NSF rate, and stable-employment percentage? A property-management company in the area should have these aggregated.
- How much new for-sale + rental construction is in the pipeline within 1–3 miles? Heavy new supply typically softens prices + rents 12–24 months out; constrained supply supports both.
Investment metrics
- 1% rule
- 1.51% ✓
- Cap rate
- 12.36%
- Cash-on-cash
- 21.67%
- DSCR
- 1.96
- GRM
- 5.5
CMA / ARV
- ARV (on-the-fly)
- $253,692
- Comps found
- 12
Show comp detail 12 sales within ~0.75 mi
| Address | Dist | Beds/Ba | Sqft | Sold | Price | $/sf | Match |
|---|---|---|---|---|---|---|---|
| 184 Calle De La Rosa | 0.11mi | 3/2.0 | 1,568 (+0%) | 1mo | $240,000 | $153 | 94 |
| 201 Calle de la Rosa Unit . | 0.06mi | 3/2.0 | 1,575 (+1%) | 10mo | $249,000 | $158 | 88 |
| 31 Via Paloma #31 | 0.26mi | 3/2.0 | 1,620 (+3%) | 4mo | $230,000 | $142 | 79 |
| 94 Camino Algarve #94 | 0.06mi | 3/2.0 | 1,440 (-8%) | 8mo | $229,792 | $160 | 77 |
| 65 Via Sintra #65 | 0.17mi | 2/2.0 (-1) | 1,440 (-8%) | 1mo | $205,000 | $142 | 73 |
| 89 Via Gabilan | 0.08mi | 2/2.0 (-1) | 1,392 (-11%) | 4mo | $220,000 | $158 | 69 |
| 113 Camino Valverde #113 | 0.04mi | 2/2.5 (-1) | 1,392 (-11%) | 6mo | $229,000 | $165 | 68 |
| 91 Via Gabilan #91 | 0.08mi | 4/2.0 (+1) | 1,344 (-14%) | 4mo | $249,999 | $186 | 65 |
| 57 Via Sintra | 0.16mi | 3/2.0 | 1,458 (-7%) | 20mo | $245,000 | $168 | 64 |
| 30 Via Paloma #30 | 0.24mi | 3/2.0 | 1,416 (-10%) | 10mo | $235,000 | $166 | 64 |
| 95 Camino Algarve #95 | 0.07mi | 2/2.0 (-1) | 1,344 (-14%) | 8mo | $218,000 | $162 | 62 |
| 79 Via Marisma #79 | 0.14mi | 3/2.0 | 1,404 (-10%) | 21mo | $249,900 | $178 | 59 |
Match score weights: distance 35% · size 25% · config 20% · recency 20%. Top-matched comps best support the ARV.
Projected returns pro-forma
-3.0% appreciation · 1.22% rent growth · sell at horizon
- IRR
- 12.3%
- Equity multiple
- 1.48×
- Total profit
- $34,740
- Equity at exit
- $38,767
- IRR
- 19.8%
- Equity multiple
- 2.52×
- Total profit
- $110,881
- Equity at exit
- $22,480
Cash invested: $72,800 (down + closing). Projections, not guarantees.
Landlord ↔ Tenant lean methodology
- Overall (STATE)
- 18 Strongly Tenant-Friendly
- State California
- 18 Strongly Tenant-Friendly · D+13
- County
- — inherits STATE
- City
- — inherits STATE
ZIP-level market 93012
- Rents YoY
- 1.2%
- Active inventory
- 160
- Price-to-rent
- 5.5×
Monthly cashflow live
- Estimated rent
- $3,939 high interval (Pro) →
- Mortgage (P&I)
- −$1,363
- Tax est. 1.5%
- −$325 /mo · $3,900/yr
- Insurance
- −$108
- HOA
- −$0
- Vacancy / Maint / Mgmt
- −$827
- Net cashflow
- $1,315
Break-even live
UW: 25.0% down · 7.5% · 30yr · 1.5% tax · 5.0% vac · 8.0% maint · 8.0% mgmt
Financing live
Cash to close
- Down payment
- $65,000
- Closing costs
- $7,800
- Reserves months
- —
- Total cash needed
- —
Loan-product check · same deal, 3 products live
Conventional
25% down · 7.5% · 30yr
- Down + closing
- —
- Monthly P&I
- —
- Monthly cashflow
- —
- DSCR
- —
- Eligible?
- —
Personal DTI + credit; lowest rate.
DSCR
20% down · 8.5% · 30yr
- Down + closing
- —
- Monthly P&I
- —
- Monthly cashflow
- —
- DSCR
- —
- Eligible?
- —
No personal income docs; deal must DSCR.
Hard money
10% down · 12.0% · 12mo
- Down + closing
- —
- Monthly P&I
- —
- Monthly cashflow
- —
- DSCR
- —
- Eligible?
- —
Short-term bridge; refi at stabilization.
Rent comps 11 comps
| Address | Beds | Baths | Sqft | Rent | $/sqft | DOM | Units | Dist |
|---|---|---|---|---|---|---|---|---|
| 3314 Rockhampton Dr Camarillo, CA | 4.0 | 3.5 | 1920 | $4,100 | $2.14 | 1d | 1 | 0.40mi |
| 313 Westpark Ct Camarillo, CA | 2.0 | 1.0–1.5 | 838 | $3,225 | $3.85 | 1d | 2 | 0.71mi |
| 4597 El Capitan Pl Camarillo, CA | 4.0 | 3.0 | 2026 | $4,900 | $2.42 | 11d | 1 | 0.78mi |
| 389 Castiano St Camarillo, CA | 2.0 | 2.5 | 1365 | $3,500 | $2.56 | 1d | 1 | 0.78mi |
| 5176 Verdugo Way Camarillo, CA | 2.0 | 1.0–2.0 | 844 | $4,077 | $4.83 | 1d | 221 | 1.00mi |
| 197 La Veta Dr Camarillo, CA | 3.0 | 2.0 | 1443 | $4,000 | $2.77 | 1d | 1 | 1.05mi |
| 4708 Via Cupertino Camarillo, CA | 4.0 | 3.0 | 2213 | $4,650 | $2.10 | 10d | 1 | 1.08mi |
| 60 Margarita Ave Camarillo, CA | 2.0 | 2.0 | 1440 | $3,000 | $2.08 | 2d | 1 | 1.25mi |
| 4915 Paseo Montelena Camarillo, CA | 4.0 | 3.0 | 2213 | $4,650 | $2.10 | 10d | 1 | 1.31mi |
| 1157 Via Montoya Camarillo, CA | 2.0 | 2.0 | 1111 | $2,950 | $2.66 | 1d | 1 | 1.43mi |
| 1571 Flynn Rd Camarillo, CA | 3.0 | 1.0–2.0 | 1081 | $3,920 | $3.63 | 1d | 1 | 1.46mi |
Listing history 15 events
-
2026-06-18days on market $260,000 Active 29 DOM
-
2026-06-17days on market $260,000 Active 28 DOM
-
2026-06-16days on market $260,000 Active 27 DOM
-
2026-06-15days on market $260,000 Active 26 DOM
-
2026-06-13days on market $260,000 Active 24 DOM
-
2026-06-10days on market $260,000 Active 21 DOM
-
2026-06-09days on market $260,000 Active 20 DOM
-
2026-06-08days on market $260,000 Active 19 DOM
-
2026-06-07days on market $260,000 Active 18 DOM
-
2026-06-05days on market $260,000 Active 15 DOM
-
2026-06-03days on market $260,000 Active 14 DOM
-
2026-06-02days on market $260,000 Active 13 DOM
-
2026-06-01days on market $260,000 Active 12 DOM
-
2026-05-31days on market $260,000 Active 11 DOM
-
2026-05-20$260,000 Active
ⓘ Source: listings_history table (triggers on properties + properties_extension) + one-shot
backfill from property_details.listing_events for pre-trigger history.
Climate risk First Street
- Flood 1/10 Low FEMA zone X (unshaded) · 0% chance over 30 yrs
- Wildfire 4/10 Moderate
- Heat 4/10 Moderate 7 d/yr ≥94°F today · 18 d/yr by 30 yrs out
- Wind 1/10 Low
- Air quality 3/10 Moderate 4 unhealthy d/yr today · 4 by 30 yrs out
Nearby sold comps map
Loading sold comps map…
Walkable amenities ~0.75 mi
Loading nearby amenities…
Taxation est. · year 1
- Rental income
- $47,265
- − Mortgage interest
- −$14,564
- − Property taxes
- −$3,900
- − Insurance
- −$1,300
- − Repairs & maintenance
- −$3,781
- − Management
- −$3,781
- − Depreciation
- −$7,564
- Taxable income
- $12,375
- Est. tax owed @ 24.0%
- −$2,970
- After-tax cash flow
- $12,808/yr
For passive investors: Depreciation is non-cash, so a rental often shows a tax loss while cash-flowing — sheltering income. Rental losses are passive: they offset passive income freely, and up to $25,000/yr can offset ordinary (W-2) income if you actively participate and your MAGI is under $100k (phasing out to $0 by $150k); unused losses carry forward. On sale, claimed depreciation is recaptured at up to 25%, and gains may owe capital-gains tax (a 1031 exchange can defer both). Figures are a year-1 estimate at your 24.0% rate — not tax advice; consult a CPA.
Condition & rehab AI · 19 photos
This remodeled home offers a good condition with updated kitchen and bathrooms, and is located in a desirable park setting with easy access to amenities.
Value-add opportunities
- Both paint exterior — enhances curb appeal and resale value
- Both replace carpet — improves comfort and aesthetics
Renovation cost estimate screening
Value-add ROI direction
- Both paint exterior — enhances curb appeal and resale value ↑
- Both replace carpet — improves comfort and aesthetics ↑
ⓘ Cost ranges are severity-bucket heuristics (US national rule-of-thumb). Get contractor quotes + a written scope before underwriting a rehab budget.
Schools (NCES district)
- District
- Pleasant Valley
- NCES district ID
- 0630990
- Math proficiency
- 43% ▼ -10.00%
- Reading proficiency
- 57% ▼ -8.00%
- Median HH income
- $87,342
- Composite
- 46.3/100
- National rank
- #2476
- State rank
- #119 of 517 in CA
Livability — Camarillo
- Score
- 78/100
- State rank
- #72
- US rank
- #2776
Category grades
Schools grade is shown separately in the Schools card above.
Census & demographics
- Census place
- Camarillo, CA
- County
- Ventura County · 829,955 people
- City population
- 82,539
- Metro
- Oxnard-Thousand Oaks-Ventura, CA
- Population (ZIP)
- 35,791
- Household income
- $135,217
- Rent vs Own
- Severe rent burden
- 1204.0
Population outlook (Ventura County) Hauer SSP2
- Today (2025)
- 895,754 people
- By 2030
- 912,134 · +1.8%
- By 2040
- 931,454 · +4.0%
- By 2050
- 934,609 · +4.3%
- By 2075
- 924,899 · +3.3%
- By 2100
- 864,712 · -3.5%
Race, ethnicity, and origin ACS 2023
- Neighborhood character
- Diverse neighborhood (Simpson 0.63)
- Race & ethnicity
- White 54% Hispanic / Latino 25% Two or more races 16% Asian 13% Black 3%
- Hispanic origin (detail)
- Mexican 19% Puerto Rican 2%
- Common ancestry
- Italian 2% Romanian 2% Lithuanian 2%
- Foreign-born
- 17% · Canada, China, South Korea
- Languages at home
- 73% English-only · Spanish 13% Other Indo-European 3% Tagalog/Filipino 2%
Political lean MEDSL · Ventura
- 2024 margin
- D (+15.1) · D 56.1% · R 41.0% · Other 2.9%
- 2008→2024 swing
- +2.8pp toward D · 2008: 12.3pp · 2024: 15.1pp
- All cycles
- 2024: D+15.1 2020: D+21.1 2016: D+16.8 2012: D+5.3 2008: D+12.3
Not yet ingested
- Civics
- —
Market trends
- HPI YoY
- ▼ -517.29%
- Current HPI
- 276.7695
- Rent YoY
- ▲ 1.22%
- Metro
- Oxnard-Thousand Oaks-Ventura, CA
- State GDP YoY
- ▲ 3.21%
- F500 in state
- 116
Industry mix (Fortune 500 HQ in CA)
| Industry | F500 HQs | Revenue |
|---|---|---|
| Technology | 27 | $1,492B |
|
||
| Financial Services | 3 | $174B |
|
||
| Retail | 3 | $44B |
|
||
| Insurance | 3 | $26B |
|
||
| Media / Entertainment | 2 | $115B |
|
||
| Pharmaceuticals / Biotech | 2 | $62B |
|
||
Price history
1 event — show timeline
- 2026-05-20 Listed $260,000 CRMLS
Cash-flow waterfall
monthlySold comps — $/sqft
last 12 mo · ≤1 miLoading sold comps…