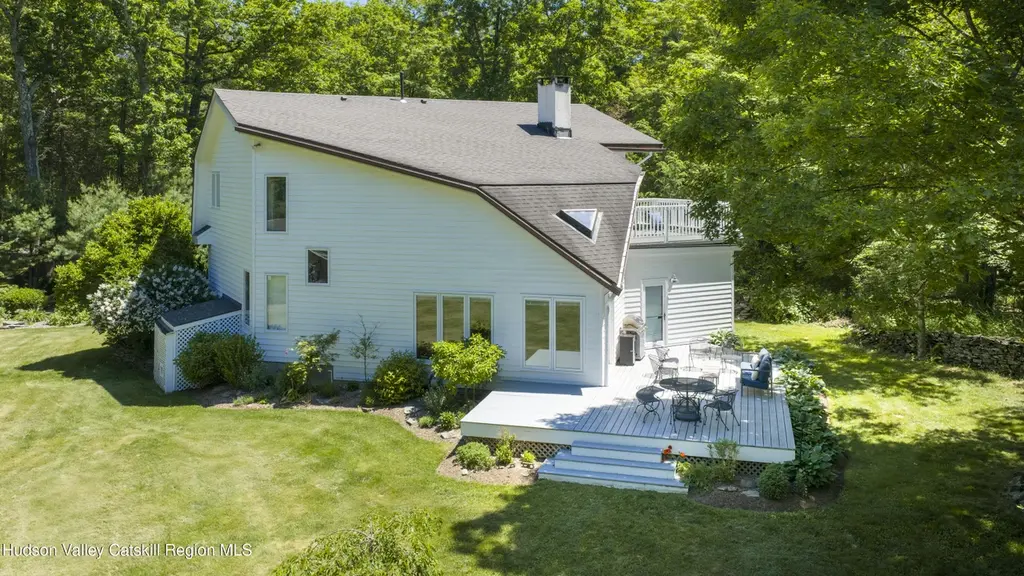
19 Blues Quarry Rd · Woodstock, NY
Flood risk 1/10 · Minimal
- FEMA flood zone
- X (unshaded)
- Chance of flooding over 30 yrs
- 0.0%
- Est. flood insurance / yr
- $507 – $1,088
Fire risk 4/10 · Minor
- Est. fire insurance / yr
- $691 – $1,283
Heat risk 3/10 · Minor
- Hot days now (above 97°F)
- 7 days/yr
- Hot days in 30 yrs
- 16 days/yr
Wind risk 3/10 · Minor
- Chance of severe wind over 30 yrs
- 6.0%
Air-quality risk 2/10 · Minimal
- Unhealthy air days now
- 0 days/yr
- Unhealthy air days in 30 yrs
- 1 days/yr
Risk factors via First Street. Map © Google.
Why this score? — see what drove the D grade
The composite is a weighted blend of 9 inputs, each scored 0–100. Each bar is that input's sub-score; the figure is the points it added to the 100-point composite (weight × sub-score).
- Cash flow +12.8/30.0
- ARV discount +7.5/15.0
- Schools +4.1/10.0
- Livability +3.9/5.0
- DSCR +3.8/10.0
- Condition / age +3.8/5.0
- 1% rule +3.6/10.0
- Rent growth +2.5/5.0
- Appreciation +0.0/10.0
$1,450,000
🖨 Deal sheet 📄 Offer letter ✓ Due diligence
Listing remarks MLS
This perfectly private retreat awaits you, a hundred miles from NYC, minutes from the village, and a million miles from your cares. Built by a sea captain, this modern “vessel” has a country barn house front, and a unique ship’s prow facing the forest. The home is graced with soaring spaces and rich timbers, on 17 wooded acres. The two-story great room is light-filled, with stone fireplace and lush forest views. The spacious country kitchen/dining area has beamed ceilings and expansive windows.
Key facts
- 17 acre lot
- 2 garage spots
- Built 1986
Neighborhood map
What this means for you Summary
Snapshot
- This is a 3-bed/2.5-bath single-family listed at $1.45M. Condition is rated good.
Deal economics
- At list price, monthly cash flow is $-146 ($-2k/yr) — negative.
- To cash-flow at today's rent, offer at most $1.43M (1.5% below list).
- To meet the 1% rule (rent ≥ 1% of price), the offer needs to be $1.25M (13.8% below list).
- Recommended offer: $1.25M (13.8% below list) — sets the bar for 1% rule.
- Cap rate 6.2% vs local median 2.6% in Woodstock — top-decile yield for the area; either an underpriced asset or a hidden risk that comps aren't pricing in. Stress-test before assuming the spread holds.
Location & tenants
- Location reads 77/100 on livability (#205 in NY, #3,176 nationally) — a middle-class / working-renter tenant base. Strengths: crime A+, amenities A+, health & safety A+; Watch: employment D, commute F, cost of living F.
- Saugerties Central School District (suburban): math 38% / reading 57% proficiency, ranked #419 of 590 in NY (top 71%) — families likely to look elsewhere, expect single-tenant / working-renter base with shorter leases.
- Market conditions: 72 active listings in the ZIP; 1 comparable units currently listed for rent nearby; 464 units permitted in Ulster County in 2024 (170 in 5+ unit buildings).
Forward outlook
- Local home prices are declining (-3.0%/yr); year-one equity from $10k of loan paydown is wiped out by about $44k of value loss. Plan a longer hold.
- Ulster County population projected at -14% by 2050 — secular population decline; favor cash flow + early exit over multi-decade hold.
Negotiation context
- Only 2 days on market — expect competitive offers; lowballing is unlikely to land.
- Current owner paid $575k; list at $1.45M implies a 152% gain — meaningful room to come down on a strong offer.
Questions for the listing agent
- What do current leases actually rent for vs. the listed asking? Can we see a recent rent roll and the last 12 months of T-12 income?
- Is there a deadline driving the sale (1031 exchange, divorce, estate, relocation)? That informs how much negotiation room exists.
- Schools are B-rated — typically a magnet for longer-tenancy family renters. What's the average tenant stay here, and is there a school-zone premium baked into asking?
- The area grade is low — what's the realistic commute time and amenity access for the typical tenant pool here? Any planned neighborhood developments (good or bad) we should know about?
- What's the average days-on-market for RENTAL listings here right now (not sales)? A rising rental-DOM trend means longer vacancies and softer asking-rent achievability than the comps imply.
- What's the recent tenant-quality profile in this submarket — average credit score on applications, eviction rate, late-payment / NSF rate, and stable-employment percentage? A property-management company in the area should have these aggregated.
- How much new for-sale + rental construction is in the pipeline within 1–3 miles? Heavy new supply typically softens prices + rents 12–24 months out; constrained supply supports both.
Investment metrics
- 1% rule
- 0.86% ✗
- Cap rate
- 6.17%
- Cash-on-cash
- -0.43%
- DSCR
- 0.98
- GRM
- 9.7
CMA / ARV
- ARV (on-the-fly)
- $841,386
- Comps found
- 2
Show comp detail 2 sales within ~0.75 mi
| Address | Dist | Beds/Ba | Sqft | Sold | Price | $/sf | Match |
|---|---|---|---|---|---|---|---|
| 86 Baumgarten Rd | 0.20mi | 2/2.0 (-1) | 2,280 (-13%) | 11mo | $735,000 | $322 | 54 |
| 1807 Glasco Tpke | 0.61mi | 3/1.5 | 2,290 (-12%) | 9mo | $737,000 | $322 | 40 |
Match score weights: distance 35% · size 25% · config 20% · recency 20%. Top-matched comps best support the ARV.
Projected returns pro-forma
-3.0% appreciation · 3.0% rent growth · sell at horizon
- IRR
- -17.0%
- Equity multiple
- 0.40×
- Total profit
- $-244,049
- Equity at exit
- $216,200
- IRR
- -8.9%
- Equity multiple
- 0.45×
- Total profit
- $-223,690
- Equity at exit
- $125,369
Cash invested: $406,000 (down + closing). Projections, not guarantees.
Landlord ↔ Tenant lean methodology
- Overall (STATE)
- 15 Strongly Tenant-Friendly
- State New York
- 15 Strongly Tenant-Friendly · D+10
- County
- — inherits STATE
- City
- — inherits STATE
ZIP-level market 12498
- Home prices YoY
- -21.8%
- Active inventory
- 72
- Price-to-rent
- 9.7×
Monthly cashflow live
- Estimated rent
- $12,500 medium interval (Pro) →
- Mortgage (P&I)
- −$7,604
- Tax est. 1.5%
- −$1,812 /mo · $21,750/yr
- Insurance
- −$604
- HOA
- −$0
- Vacancy / Maint / Mgmt
- −$2,625
- Net cashflow
- $-146
Break-even live
UW: 25.0% down · 7.5% · 30yr · 1.5% tax · 5.0% vac · 8.0% maint · 8.0% mgmt
Financing live
Cash to close
- Down payment
- $362,500
- Closing costs
- $43,500
- Reserves months
- —
- Total cash needed
- —
Loan-product check · same deal, 3 products live
Conventional
25% down · 7.5% · 30yr
- Down + closing
- —
- Monthly P&I
- —
- Monthly cashflow
- —
- DSCR
- —
- Eligible?
- —
Personal DTI + credit; lowest rate.
DSCR
20% down · 8.5% · 30yr
- Down + closing
- —
- Monthly P&I
- —
- Monthly cashflow
- —
- DSCR
- —
- Eligible?
- —
No personal income docs; deal must DSCR.
Hard money
10% down · 12.0% · 12mo
- Down + closing
- —
- Monthly P&I
- —
- Monthly cashflow
- —
- DSCR
- —
- Eligible?
- —
Short-term bridge; refi at stabilization.
Rent comps 1 comps
| Address | Beds | Baths | Sqft | Rent | $/sqft | DOM | Units | Dist |
|---|---|---|---|---|---|---|---|---|
| 64 Meher Cir Woodstock, NY | 4.0 | 3.0 | 2714 | $12,500 | $4.61 | 43d | 1 | 1.17mi |
Listing history 3 events
-
2026-06-08days on market $1,450,000 Coming Soon 2 DOM
-
2026-06-07remarks 699-char remark
-
2026-06-07$1,450,000 Coming Soon 1 DOM
ⓘ Source: listings_history table (triggers on properties + properties_extension) + one-shot
backfill from property_details.listing_events for pre-trigger history.
Climate risk First Street
- Flood 1/10 Low FEMA zone X (unshaded) · 0% chance over 30 yrs
- Wildfire 4/10 Moderate
- Heat 3/10 Moderate 7 d/yr ≥97°F today · 16 d/yr by 30 yrs out
- Wind 3/10 Moderate 6% chance of damaging wind over 30 yrs
- Air quality 2/10 Low 0 unhealthy d/yr today · 1 by 30 yrs out
Nearby sold comps map
Loading sold comps map…
Walkable amenities ~0.75 mi
Loading nearby amenities…
Taxation est. · year 1
- Rental income
- $150,000
- − Mortgage interest
- −$81,223
- − Property taxes
- −$21,750
- − Insurance
- −$7,250
- − Repairs & maintenance
- −$12,000
- − Management
- −$12,000
- − Depreciation
- −$42,182
- Taxable loss
- −$26,404
- Est. tax savings @ 24.0%
- +$6,337
- After-tax cash flow
- $4,590/yr
For passive investors: Depreciation is non-cash, so a rental often shows a tax loss while cash-flowing — sheltering income. Rental losses are passive: they offset passive income freely, and up to $25,000/yr can offset ordinary (W-2) income if you actively participate and your MAGI is under $100k (phasing out to $0 by $150k); unused losses carry forward. On sale, claimed depreciation is recaptured at up to 25%, and gains may owe capital-gains tax (a 1031 exchange can defer both). Figures are a year-1 estimate at your 24.0% rate — not tax advice; consult a CPA.
Condition & rehab AI · 12 photos
This well-maintained single-family home offers a serene setting with modern amenities and a spacious layout, making it an attractive option for both resale and rental.
Value-add opportunities
- Resale Paint exterior — Fresh paint can enhance curb appeal and home value
- Rental Clean gutters — Clean gutters improve property maintenance and reduce potential water damage
Renovation cost estimate screening
Value-add ROI direction
- Resale Paint exterior — Fresh paint can enhance curb appeal and home value ↑
- Rental Clean gutters — Clean gutters improve property maintenance and reduce potential water damage ↑
ⓘ Cost ranges are severity-bucket heuristics (US national rule-of-thumb). Get contractor quotes + a written scope before underwriting a rehab budget.
Schools (NCES district)
- District
- Saugerties Central School District
- NCES district ID
- 3625800
- Math proficiency
- 38% ▼ -16.00%
- Reading proficiency
- 57% ▲ 8.00%
- Median HH income
- $56,897
- Composite
- 41.3/100
- National rank
- #3515
- State rank
- #419 of 590 in NY
Livability — Woodstock
- Score
- 77/100
- State rank
- #205
- US rank
- #3176
Category grades
Schools grade is shown separately in the Schools card above.
Census & demographics
- Census place
- Woodstock, NY
- City population
- 4,530
- Population (ZIP)
- 4,530
Population outlook (Ulster County) Hauer SSP2
- Today (2025)
- 175,887 people
- By 2030
- 171,876 · -2.3%
- By 2040
- 161,771 · -8.0%
- By 2050
- 151,470 · -13.9%
- By 2075
- 133,023 · -24.4%
- By 2100
- 113,504 · -35.5%
Race, ethnicity, and origin ACS 2023
- Neighborhood character
- Predominantly White (84%)
- Race & ethnicity
- White 84% Hispanic / Latino 6% Two or more races 5% Asian 3% Black 2%
- Hispanic origin (detail)
- Common ancestry
- Scotch-Irish 8% Italian 7% Romanian 5%
- Foreign-born
- 12% · Canada, China, Jamaica
- Languages at home
- 90% English-only · Spanish 3% French/Haitian/Cajun 2% German/W. Germanic 1%
Political lean MEDSL · Ulster
- 2024 margin
- D (+18.7) · D 59.3% · R 40.7%
- 2008→2024 swing
- -4.9pp toward R · 2008: 23.6pp · 2024: 18.7pp
- All cycles
- 2024: D+18.7 2020: D+20.9 2016: D+9.1 2012: D+21.9 2008: D+23.6
Not yet ingested
- Civics
- —
Market trends
- HPI YoY
- ▼ -96.28%
- Current HPI
- 344.8651
- Rent YoY
- —
- Metro
- —
- State GDP YoY
- ▲ 2.60%
- F500 in state
- 92
Industry mix (Fortune 500 HQ in NY)
| Industry | F500 HQs | Revenue |
|---|---|---|
| Financial Services | 10 | $950B |
|
||
| Consumer Goods | 9 | $162B |
|
||
| Insurance | 4 | $225B |
|
||
| Telecommunications | 2 | $144B |
|
||
| Pharmaceuticals | 2 | $112B |
|
||
| Media / Entertainment | 2 | $69B |
|
||
Price history
+145.8% since first listed3 events — show timeline
- 2026-06-06 Coming Soon $1,450,000 HVCRMLS
- 2009-04-30 Sold (MLS) $575,000 HVCRMLS
- 2008-08-21 Listed $590,000 HVCRMLS
Cash-flow waterfall
monthlySold comps — $/sqft
last 12 mo · ≤1 miLoading sold comps…