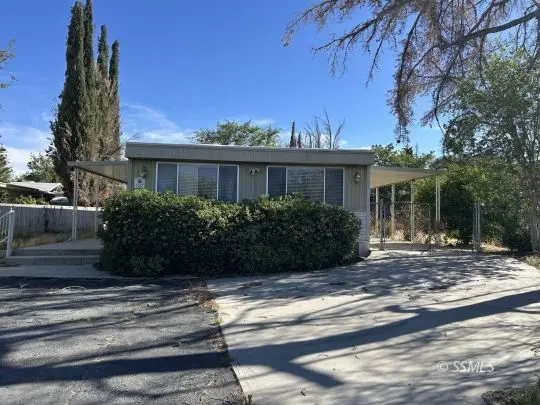
5217 Chaparral Dr · China Lake Acres, CA
Flood risk 1/10 · Minimal
- FEMA flood zone
- A
- Chance of flooding over 30 yrs
- 0.0%
- Est. flood insurance / yr
- $1,009 – $1,996
Fire risk 3/10 · Minor
- Est. fire insurance / yr
- $659 – $1,223
Heat risk 8/10 · Major
- Hot days now (above threshold)
- —
- Hot days in 30 yrs
- —
Wind risk 1/10 · Minimal
- Chance of severe wind over 30 yrs
- —
Air-quality risk 5/10 · Moderate
- Unhealthy air days now
- 7 days/yr
- Unhealthy air days in 30 yrs
- 9 days/yr
Risk factors via First Street. Map © Google.
Why this score? — see what drove the B+ grade
The composite is a weighted blend of 9 inputs, each scored 0–100. Each bar is that input's sub-score; the figure is the points it added to the 100-point composite (weight × sub-score).
- Cash flow +30.0/30.0
- ARV discount +15.0/15.0
- 1% rule +10.0/10.0
- DSCR +10.0/10.0
- Rent growth +3.4/5.0
- Livability +3.0/5.0
- Schools +2.9/10.0
- Condition / age +2.5/5.0
- Appreciation +0.0/10.0
$84,900
🖨 Deal sheet 📄 Offer letter ✓ Due diligence
Listing remarks
Move-in ready home offering a spacious living room, separate family room, and dedicated dining area. The well-designed kitchen includes a pantry for extra storage. Generous guest bedroom and an expansive primary suite featuring double sinks in the en-suite bath. Enjoy outdoor living under the huge covered patio, perfect for relaxing or entertaining. Additional features include a covered carport, fully fenced yard, and a 6x8 storage shed. Water is paid through HOA. "The property is under the Owner Occupant program. Buyer(s) occupying the property as primary residence are eligible to submit.
Key facts
- Separate family room
- Spacious living room
- Community pool
Tags
Property features AI
Finance
- HOA & community: Homeowners association with monthly fee of $128; Community pool; Community basketball court; Management provided; Curbs in the community
Exterior
- Utilities: Natural gas connected; Septic tank
- Home design: Mobile home (double-wide); Residential property
- Construction: Metal siding; Foam roof
- Exterior features: Covered patio; Patio; Shed(s); RV/Boat storage; Landscaped lot
Interior
- Kitchen: Dishwasher; Disposal; Microwave; Range / Oven; Refrigerator
- Flooring: Carpet; Linoleum
- Bathrooms: 1 full bathroom; 1 three-quarter bathroom
- Heating & cooling: Natural gas heating; Central air; Ceiling fans; Evaporative cooling
- Interior features: Window coverings; Dishwasher; Disposal; Microwave; Range / Oven; Refrigerator; Gas water heater
- Laundry & utility: Gas water heater
Neighborhood map
What this means for you Summary
Snapshot
- This is a 3-bed/2.0-bath manufactured listed at $85k.
Deal economics
- At list price, monthly cash flow is $438 ($5k/yr) — positive.
- The deal already cash-flows at list — no discount required.
- Meets the 1% rule at list price ($2k rent vs $85k).
- Recommended offer: $82k (3.0% below list) — sets the bar for market timing.
Location & tenants
- Location reads 59/100 on livability (#642 in CA) — a working-class tenant base; expect higher turnover. Strengths: housing A+, crime B+; Watch: commute D, schools F, amenities F.
- Sierra Sands Unified (town): math 25% / reading 39% proficiency, ranked #294 of 517 in CA (top 57%) — families likely to look elsewhere, expect single-tenant / working-renter base with shorter leases.
- Market conditions: Rents rising (+3.6%/yr); 328 active listings in the ZIP; 2 comparable units currently listed for rent nearby; solid renter incomes; 3,244 units permitted in Kern County in 2024 (73 in 5+ unit buildings).
Forward outlook
- Local home prices are declining (-3.0%/yr); year-one equity from $587 of loan paydown is wiped out by about $3k of value loss. Plan a longer hold.
- Kern County population projected at +17% by 2050 — long-run rental-demand tailwind backs the buy-and-hold thesis.
- At projected returns (-3.0% appreciation + 3.6% rent growth), your $24k cash investment doubles in ~6 years — after that, you're playing with house money.
Negotiation context
- It's been on market 45 days — a 3% lower offer ($82k) is reasonable based on typical stale-listing flexibility.
- Current owner paid $41k; list at $85k implies a 107% gain — meaningful room to come down on a strong offer.
Risks & watch-outs
- Watch-outs: flood insurance adds $125/mo.
- Climate carrying-cost: in FEMA flood zone A (mandatory federal flood insurance) — expect insurance premiums to compound above CPI over the hold.
Questions for the listing agent
- It's been on market 45 days. Have you received any prior offers? Is the seller open to a 3% concession, seller financing, or rate buy-down credit?
- Built in 1971 — when were the roof, HVAC, electrical panel, plumbing, and water heater last replaced?
- What's the actual annual flood-insurance premium (NFIP or private), and is the property in a SFHA with mandatory coverage?
- What does the HOA fee cover, when was the last increase, and are there any pending special assessments or reserve-fund shortfalls?
- Is there a deadline driving the sale (1031 exchange, divorce, estate, relocation)? That informs how much negotiation room exists.
- Schools are F-rated, which usually means shorter tenancies and higher turnover. Who's the typical renter profile here, and what's been the actual vacancy rate?
- What's the average days-on-market for RENTAL listings here right now (not sales)? A rising rental-DOM trend means longer vacancies and softer asking-rent achievability than the comps imply.
- What's the recent tenant-quality profile in this submarket — average credit score on applications, eviction rate, late-payment / NSF rate, and stable-employment percentage? A property-management company in the area should have these aggregated.
- How much new for-sale + rental construction is in the pipeline within 1–3 miles? Heavy new supply typically softens prices + rents 12–24 months out; constrained supply supports both.
Investment metrics
- 1% rule
- 1.85% ✓
- Cap rate
- 14.25%
- Cash-on-cash
- 28.41%
- DSCR
- 2.26
- GRM
- 4.5
CMA / ARV
- ARV (median comp)
- $148,028
- List price
- $84,900
- Delta
- -42.65%
- Verdict
- UNDERPRICED
- Comps
- 8 within 1.0 mi
Show comp detail 9 sales within ~0.75 mi
| Address | Dist | Beds/Ba | Sqft | Sold | Price | $/sf | Match |
|---|---|---|---|---|---|---|---|
| 5237 Ocotillo Ave | 0.08mi | 3/2.0 | 1,536 (+7%) | 1mo | $100,000 | $65 | 84 |
| 5221 Ocotillo Ave | 0.05mi | 3/2.0 | 1,344 (-7%) | 7mo | $81,000 | $60 | 81 |
| 1631 N Chaparral Dr | 0.13mi | 2/2.0 (-1) | 1,344 (-7%) | 9mo | $59,000 | $44 | 70 |
| 5234 Cholla Way | 0.06mi | 2/2.0 (-1) | 1,536 (+7%) | 16mo | $87,000 | $57 | 67 |
| 5229 Agave Ave | 0.09mi | 2/2.0 (-1) | 1,248 (-13%) | 5mo | $95,000 | $76 | 65 |
| 1536 Saguaro St | 0.04mi | 2/2.0 (-1) | 1,344 (-7%) | 22mo | $71,000 | $53 | 64 |
| 1617 N Everett | 0.66mi | 3/2.0 | 1,440 (0%) | 7mo | $199,000 | $138 | 64 |
| 1544 N Charles St | 0.58mi | 3/2.0 | 1,344 (-7%) | 6mo | $287,000 | $214 | 56 |
| 1445 Everett St | 0.68mi | 3/2.0 | 1,392 (-3%) | 22mo | $170,500 | $122 | 44 |
Match score weights: distance 35% · size 25% · config 20% · recency 20%. Top-matched comps best support the ARV.
Projected returns pro-forma
-3.0% appreciation · 3.58% rent growth · sell at horizon
- IRR
- 15.7%
- Equity multiple
- 1.64×
- Total profit
- $15,186
- Equity at exit
- $12,659
- IRR
- 25.0%
- Equity multiple
- 3.25×
- Total profit
- $53,560
- Equity at exit
- $7,341
Cash invested: $23,772 (down + closing). Projections, not guarantees.
Landlord ↔ Tenant lean methodology
- Overall (STATE)
- 18 Strongly Tenant-Friendly
- State California
- 18 Strongly Tenant-Friendly · D+13
- County
- — inherits STATE
- City
- — inherits STATE
ZIP-level market 93555
- Home prices YoY
- -24.0%
- Rents YoY
- 3.6%
- Active inventory
- 328
- Price-to-rent
- 4.5×
Monthly cashflow live
- Estimated rent
- $1,568 medium interval (Pro) →
- Mortgage (P&I)
- −$445
- Tax from tax record
- −$67 /mo · $805/yr
- Insurance
- −$35
- Flood insurance flood zone
- −$125 /mo · $1,502/yr
- HOA
- −$128
- Vacancy / Maint / Mgmt
- −$329
- Net cashflow
- $438
Break-even live
UW: 25.0% down · 7.5% · 30yr · 1.5% tax · 5.0% vac · 8.0% maint · 8.0% mgmt
Financing live
Cash to close
- Down payment
- $21,225
- Closing costs
- $2,547
- Reserves months
- —
- Total cash needed
- —
Loan-product check · same deal, 3 products live
Conventional
25% down · 7.5% · 30yr
- Down + closing
- —
- Monthly P&I
- —
- Monthly cashflow
- —
- DSCR
- —
- Eligible?
- —
Personal DTI + credit; lowest rate.
DSCR
20% down · 8.5% · 30yr
- Down + closing
- —
- Monthly P&I
- —
- Monthly cashflow
- —
- DSCR
- —
- Eligible?
- —
No personal income docs; deal must DSCR.
Hard money
10% down · 12.0% · 12mo
- Down + closing
- —
- Monthly P&I
- —
- Monthly cashflow
- —
- DSCR
- —
- Eligible?
- —
Short-term bridge; refi at stabilization.
Rent comps 2 comps
| Address | Beds | Baths | Sqft | Rent | $/sqft | DOM | Units | Dist |
|---|---|---|---|---|---|---|---|---|
| 1631 Chaparral Dr Unit PLACECHA1631 Ridgecrest, CA | 2.0 | 2.0 | 1344 | $1,400 | $1.04 | 3d | 1 | 0.12mi |
| 4423 Johnston Ave Unit D Ridgecrest, CA | 2.0 | 1.0 | 968 | $1,100 | $1.14 | 3d | 1 | 0.89mi |
HOA detail
- Monthly dues
- $128 · $1,536/yr
- Likely covers
- water
Listing history 18 events
-
2026-06-18days on market $84,900 Active 45 DOM
-
2026-06-17days on market $84,900 Active 44 DOM
-
2026-06-16days on market $84,900 Active 43 DOM
-
2026-06-15price $84,900 Active 42 DOM
-
2026-06-15days on market $89,900 Active 42 DOM
-
2026-06-14days on market $89,900 Active 40 DOM
-
2026-06-13days on market $89,900 Active 39 DOM
-
2026-06-10days on market $89,900 Active 37 DOM
-
2026-06-09days on market $89,900 Active 36 DOM
-
2026-06-08days on market $89,900 Active 35 DOM
-
2026-06-07days on market $89,900 Active 34 DOM
-
2026-06-05days on market $89,900 Active 31 DOM
-
2026-06-03days on market $89,900 Active 30 DOM
-
2026-06-03days on market $89,900 Active 29 DOM
-
2026-06-01days on market $89,900 Active 28 DOM
-
2026-05-31days on market $89,900 Active 27 DOM
-
2026-05-04$89,900 Active 601-char remark
-
2002-02-08soldstatus $41,000
ⓘ Source: listings_history table (triggers on properties + properties_extension) + one-shot
backfill from property_details.listing_events for pre-trigger history.
Tax reassessment forecast CA · Resets to sale price
- Current annual tax
- $805 · $67/mo
- Projected year-2 tax
- $805 · $67/mo
- Expected delta
- $0/yr ($0/mo · 0.0%)
ⓘ Screening estimate from a state-policy table — verify with the county assessor before closing.
Climate risk First Street
- Flood 1/10 Low FEMA zone A · 0% chance over 30 yrs
- Wildfire 3/10 Moderate
- Heat 8/10 Severe
- Wind 1/10 Low
- Air quality 5/10 Major 7 unhealthy d/yr today · 9 by 30 yrs out
Nearby sold comps map
Loading sold comps map…
Walkable amenities ~0.75 mi
Loading nearby amenities…
Taxation est. · year 1
- Rental income
- $18,812
- − Mortgage interest
- −$4,756
- − Property taxes
- −$805
- − Insurance
- −$1,927
- − Repairs & maintenance
- −$1,505
- − Management
- −$1,505
- − HOA
- −$1,536
- − Depreciation
- −$2,470
- Taxable income
- $4,308
- Est. tax owed @ 24.0%
- −$1,034
- After-tax cash flow
- $4,217/yr
For passive investors: Depreciation is non-cash, so a rental often shows a tax loss while cash-flowing — sheltering income. Rental losses are passive: they offset passive income freely, and up to $25,000/yr can offset ordinary (W-2) income if you actively participate and your MAGI is under $100k (phasing out to $0 by $150k); unused losses carry forward. On sale, claimed depreciation is recaptured at up to 25%, and gains may owe capital-gains tax (a 1031 exchange can defer both). Figures are a year-1 estimate at your 24.0% rate — not tax advice; consult a CPA.
Schools (NCES district)
- District
- Sierra Sands Unified
- NCES district ID
- 0636800
- Math proficiency
- 25% ▼ -11.00%
- Reading proficiency
- 39% ▼ -11.00%
- Median HH income
- $58,937
- Composite
- 28.66/100
- National rank
- #6699
- State rank
- #294 of 517 in CA
Livability — China Lake Acres
- Score
- 59/100
- State rank
- #642
- US rank
- #20115
Category grades
Schools grade is shown separately in the Schools card above.
Census & demographics
- Census place
- China Lake Acres, CA
- County
- Kern County · 710,371 people
- Metro
- Bakersfield, CA
- Population (ZIP)
- 33,845
- Household income
- $86,700
- Rent vs Own
- Severe rent burden
- 975.0
Population outlook (Kern County) Hauer SSP2
- Today (2025)
- 947,286 people
- By 2030
- 978,984 · +3.3%
- By 2040
- 1,045,018 · +10.3%
- By 2050
- 1,105,232 · +16.7%
- By 2075
- 1,229,538 · +29.8%
- By 2100
- 1,238,059 · +30.7%
Race, ethnicity, and origin ACS 2023
- Neighborhood character
- Majority White (65%)
- Race & ethnicity
- White 65% Hispanic / Latino 20% Two or more races 12% Black 4% Asian 4% Native American 1%
- Hispanic origin (detail)
- Mexican 15%
- Common ancestry
- Italian 4% Lithuanian 2% Slovak 2%
- Foreign-born
- 7% · Canada
- Languages at home
- 84% English-only · Spanish 11% Other Indo-European 1% Other Asian/Pacific 1%
Political lean MEDSL · Kern
- 2024 margin
- Strong R (+21.1) · D 38.2% · R 59.3% · Other 2.5%
- 2008→2024 swing
- -3.3pp toward R · 2008: -17.8pp · 2024: -21.1pp
- All cycles
- 2024: R+21.1 2020: R+10.2 2016: R+15.0 2012: R+20.9 2008: R+17.8
Not yet ingested
- Civics
- —
Market trends
- HPI YoY
- ▼ -120.17%
- Current HPI
- 380.5208
- Rent YoY
- ▲ 3.58%
- Metro
- Bakersfield, CA
- State GDP YoY
- ▲ 3.21%
- F500 in state
- 116
Industry mix (Fortune 500 HQ in CA)
| Industry | F500 HQs | Revenue |
|---|---|---|
| Technology | 27 | $1,492B |
|
||
| Financial Services | 3 | $174B |
|
||
| Retail | 3 | $44B |
|
||
| Insurance | 3 | $26B |
|
||
| Media / Entertainment | 2 | $115B |
|
||
| Pharmaceuticals / Biotech | 2 | $62B |
|
||
Price history
+107.1% since first listed3 events — show timeline
- 2026-06-15 Price Changed $84,900 SSMLS
- 2026-05-04 Listed $89,900 SSMLS
- 2002-02-08 Sold (Public Records) $41,000 Public Records
Property tax history
+3.7%/yrLatest (2025): $805 · +6.5% YoY. Source: county tax records.
Cash-flow waterfall
monthlySold comps — $/sqft
last 12 mo · ≤1 miLoading sold comps…