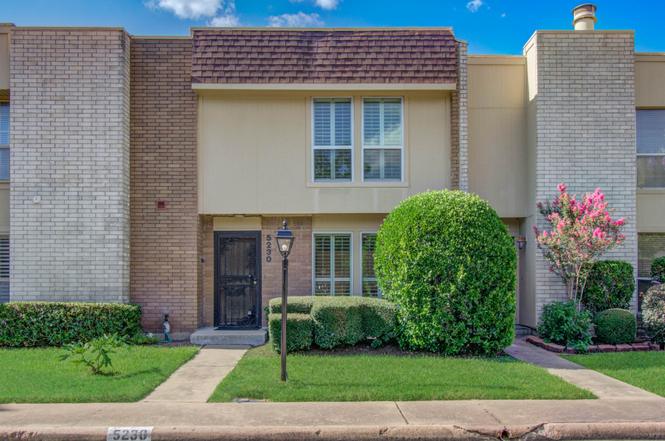
5230 Woodlawn Pl · Bellaire, TX
Flood risk 1/10 · Minimal
- FEMA flood zone
- X (shaded)
- Chance of flooding over 30 yrs
- 0.0%
- Est. flood insurance / yr
- $507 – $1,088
Fire risk 1/10 · Minimal
- Est. fire insurance / yr
- $1,222 – $2,270
Heat risk 9/10 · Severe
- Hot days now (above 109°F)
- 7 days/yr
- Hot days in 30 yrs
- 23 days/yr
Wind risk 9/10 · Severe
- Chance of severe wind over 30 yrs
- 99.0%
Air-quality risk 2/10 · Minimal
- Unhealthy air days now
- 2 days/yr
- Unhealthy air days in 30 yrs
- 2 days/yr
Risk factors via First Street. Map © Google.
Why this score? — see what drove the D+ grade
The composite is a weighted blend of 9 inputs, each scored 0–100. Each bar is that input's sub-score; the figure is the points it added to the 100-point composite (weight × sub-score).
- ARV discount +13.3/15.0
- Cash flow +12.5/30.0
- 1% rule +4.2/10.0
- Livability +4.0/5.0
- DSCR +3.7/10.0
- Schools +2.7/10.0
- Rent growth +2.5/5.0
- Condition / age +2.5/5.0
- Appreciation +0.0/10.0
$299,000
🖨 Deal sheet 📄 Offer letter ✓ Due diligence
Listing remarks
Wonderful townhome in the heart of Bellaire. Zoned to Condit, Pershing and Bellaire High School. Downstairs: living room with fireplace, dining room, kitchen with granite counters and abundant storage. Central atrium provides natural light and another living space. Direct entry from garage. Grage features Tesla charger and bonus storage closet. Upstairs: 2 secondary bedrooms and hall bath. Primary bedroom with walk-in closets and work from home study or office. Community pool and gazebo. Low HOA fee includes yard care and community pool. Convenient to HEB, City of Bellaire recreational facilities, Galleria, Greenway Plaza, Downtown, Texas Medical Center. Take a virtual tour.
Key facts
- Community pool
- Work from home study
- Central atrium
Tags
Neighborhood map
What this means for you Summary
Snapshot
- This is a 3-bed/2.5-bath townhouse listed at $299k.
Deal economics
- At list price, monthly cash flow is $-43 ($-514/yr) — negative.
- To cash-flow at today's rent, offer at most $293k (2.1% below list).
- To meet the 1% rule (rent ≥ 1% of price), the offer needs to be $275k (8.0% below list).
- Recommended offer: $275k (8.0% below list) — sets the bar for 1% rule.
Location & tenants
- Location reads 80/100 on livability (#32 in TX, #1,639 nationally) — a professional / high-income tenant draw. Strengths: employment A+, housing A+, commute A-; Watch: cost of living F.
- Houston ISD (urban): math 27% / reading 35% proficiency, ranked #593 of 826 in TX (top 72%) — families likely to look elsewhere, expect single-tenant / working-renter base with shorter leases; 71% free/reduced lunch — lower-income household profile, screen leases tightly.
- Zoned schools: Pershing Middle (math 36% / reading 49%, grade D-, #553 of 1,662 statewide, top 34%, 1,390 students, 60% FRL); Bellaire H S (math 45% / reading 62%, grade C-, #428 of 1,632 statewide, top 27%, 3,170 students, 48% FRL) — zoned schools average 54% FRL vs 71% district-wide (17 pts lower); this property's tenant base skews higher-income than the district average.
- Zoned-school proficiency averages 48% at this address vs 31% district-wide (+17 pts) — the actual schools serving this property are materially stronger than the Houston ISD average implies; a family-tenant draw the district grade alone would hide.
- Market conditions: 109 active listings in the ZIP; 9 comparable units currently listed for rent nearby; rentals lingering (median 44d on market — plan ~5-8 weeks vacancy on turnover, expect pricing pressure); 67% of comp listings sitting > 30 days — soft ceiling on asking rent; high-income renter base; 29,883 units permitted in Harris County in 2024 (8,621 in 5+ unit buildings).
- This rent is only 14% of the median local income ($244k/yr) — well below the 30% rent-burden line; pricing power to push rent on renewal without tenant pushback.
Forward outlook
- Local home prices are declining (-3.0%/yr); year-one equity from $2k of loan paydown is wiped out by about $9k of value loss. Plan a longer hold.
- Harris County population projected at +47% by 2050 — long-run rental-demand tailwind backs the buy-and-hold thesis.
Negotiation context
- It's been on market 53 days — a 3% lower offer ($290k) is reasonable based on typical stale-listing flexibility.
- 2 sale attempts; this cycle's ask has dropped $16k (5%) from the opening price — seller is motivated, your offer sets the floor, not the list.
Risks & watch-outs
- Climate carrying-cost: severe wind risk, 99% chance of damaging wind over 30y; extreme-heat days projected 7→23/yr by 2055 (HVAC capex compounding) — expect insurance premiums to compound above CPI over the hold.
Questions for the listing agent
- What do current leases actually rent for vs. the listed asking? Can we see a recent rent roll and the last 12 months of T-12 income?
- It's been on market 53 days. Have you received any prior offers? Is the seller open to a 8% concession, seller financing, or rate buy-down credit?
- Built in 1978 — when were the roof, HVAC, electrical panel, plumbing, and water heater last replaced?
- What does the HOA fee cover, when was the last increase, and are there any pending special assessments or reserve-fund shortfalls?
- Is there a deadline driving the sale (1031 exchange, divorce, estate, relocation)? That informs how much negotiation room exists.
- Schools are A-rated — typically a magnet for longer-tenancy family renters. What's the average tenant stay here, and is there a school-zone premium baked into asking?
- The area grade is low — what's the realistic commute time and amenity access for the typical tenant pool here? Any planned neighborhood developments (good or bad) we should know about?
- What's the average days-on-market for RENTAL listings here right now (not sales)? A rising rental-DOM trend means longer vacancies and softer asking-rent achievability than the comps imply.
- What's the recent tenant-quality profile in this submarket — average credit score on applications, eviction rate, late-payment / NSF rate, and stable-employment percentage? A property-management company in the area should have these aggregated.
- How much new for-sale + rental construction is in the pipeline within 1–3 miles? Heavy new supply typically softens prices + rents 12–24 months out; constrained supply supports both.
Investment metrics
- 1% rule
- 0.92% ✗
- Cap rate
- 6.12%
- Cash-on-cash
- -0.61%
- DSCR
- 0.97
- GRM
- 9.1
CMA / ARV
- ARV (on-the-fly)
- $343,060
- Comps found
- 8
Show comp detail 8 sales within ~0.75 mi
| Address | Dist | Beds/Ba | Sqft | Sold | Price | $/sf | Match |
|---|---|---|---|---|---|---|---|
| 5230 Woodlawn Pl | 0.00mi | 3/2.5 | 2,018 (0%) | 1mo | $299,000 | $148 | 99 |
| 6308 Meredith Dr | 0.05mi | 3/2.5 | 1,846 (-8%) | 4mo | $349,900 | $190 | 80 |
| 21 Townhouse Ct | 0.18mi | 3/2.5 | 2,018 (0%) | 17mo | $350,000 | $173 | 77 |
| 5210 Woodlawn Pl | 0.04mi | 3/2.5 | 1,871 (-7%) | 11mo | $359,000 | $192 | 77 |
| 6302 1st St | 0.55mi | 3/2.5 | 1,928 (-4%) | 4mo | $320,000 | $166 | 63 |
| 5212 Woodlawn Pl | 0.04mi | 2/2.5 (-1) | 1,722 (-15%) | 12mo | $289,000 | $168 | 58 |
| 6314 1st St | 0.55mi | 3/2.0 | 1,930 (-4%) | 12mo | $329,000 | $170 | 55 |
| 5206 Palmetto St | 0.06mi | 3/2.5 | 2,320 (+15%) | 23mo | $395,000 | $170 | 53 |
Match score weights: distance 35% · size 25% · config 20% · recency 20%. Top-matched comps best support the ARV.
Projected returns pro-forma
-3.0% appreciation · 3.0% rent growth · sell at horizon
- IRR
- -17.3%
- Equity multiple
- 0.39×
- Total profit
- $-51,045
- Equity at exit
- $44,582
- IRR
- -9.1%
- Equity multiple
- 0.43×
- Total profit
- $-47,418
- Equity at exit
- $25,852
Cash invested: $83,720 (down + closing). Projections, not guarantees.
Landlord ↔ Tenant lean methodology
- Overall (STATE)
- 87 Strongly Landlord-Friendly
- State Texas
- 87 Strongly Landlord-Friendly · R+5
- County
- — inherits STATE
- City
- — inherits STATE
ZIP-level market 77401
- Active inventory
- 109
- Price-to-rent
- 9.1×
Monthly cashflow live
- Estimated rent
- $2,751 high interval (Pro) →
- Mortgage (P&I)
- −$1,568
- Tax est. 1.5%
- −$374 /mo · $4,485/yr
- Insurance
- −$125
- HOA
- −$150
- Vacancy / Maint / Mgmt
- −$578
- Net cashflow
- $-43
Break-even live
UW: 25.0% down · 7.5% · 30yr · 1.5% tax · 5.0% vac · 8.0% maint · 8.0% mgmt
Financing live
Cash to close
- Down payment
- $74,750
- Closing costs
- $8,970
- Reserves months
- —
- Total cash needed
- —
Loan-product check · same deal, 3 products live
Conventional
25% down · 7.5% · 30yr
- Down + closing
- —
- Monthly P&I
- —
- Monthly cashflow
- —
- DSCR
- —
- Eligible?
- —
Personal DTI + credit; lowest rate.
DSCR
20% down · 8.5% · 30yr
- Down + closing
- —
- Monthly P&I
- —
- Monthly cashflow
- —
- DSCR
- —
- Eligible?
- —
No personal income docs; deal must DSCR.
Hard money
10% down · 12.0% · 12mo
- Down + closing
- —
- Monthly P&I
- —
- Monthly cashflow
- —
- DSCR
- —
- Eligible?
- —
Short-term bridge; refi at stabilization.
Rent comps 9 comps
| Address | Beds | Baths | Sqft | Rent | $/sqft | DOM | Units | Dist |
|---|---|---|---|---|---|---|---|---|
| 6666 Chimney Rock Rd Houston, TX | 1.0–2.0 | 1.0–2.0 | 1025 | $1,800 | $1.76 | 44d | 1 | 0.43mi |
| 5421 Judalon Ln Houston, TX | 3.0 | 2.0 | 1740 | $3,600 | $2.07 | 44d | 1 | 1.04mi |
| 5331 Beverly Hill St Houston, TX | 1.0–4.0 | 1.0–2.5 | 1370 | $1,688 | $1.23 | 2d | 84 | 1.17mi |
| 3319 Bingham Manor Ln Houston, TX | 3.0 | 4.0 | 2866 | $2,900 | $1.01 | 44d | 1 | 1.22mi |
| 4507 Medinah Pl Bellaire, TX | 2.0 | 3.0 | 1627 | $2,299 | $1.41 | 44d | 1 | 1.24mi |
| 809 Woodstock St Bellaire, TX | 3.0 | 2.0 | 2000 | $2,600 | $1.30 | 8d | 1 | 1.25mi |
| 5815 Fairdale Ln Houston, TX | 3.0 | 4.0 | 2047 | $2,800 | $1.37 | 44d | 1 | 1.47mi |
| 6130 Southwest Fwy Houston, TX | 4.0 | 1.0–2.0 | 1170 | $1,875 | $1.60 | 14d | 20 | 1.47mi |
| 5625 Dolores St Houston, TX | 4.0 | 4.0 | 2935 | $4,500 | $1.53 | 44d | 1 | 1.49mi |
HOA detail
- Monthly dues
- $150 · $1,800/yr
- Likely covers
- pool
Listing history 8 events
-
2026-03-24status Pending
-
2026-03-16status Pending
-
2026-02-23price $299,000
-
2026-01-29$315,000 Active
-
2026-01-28historical
-
2025-10-27price $329,000
-
2025-08-21price $349,000
-
2025-07-27$364,000 Active
ⓘ Source: listings_history table (triggers on properties + properties_extension) + one-shot
backfill from property_details.listing_events for pre-trigger history.
Climate risk First Street
- Flood 1/10 Low FEMA zone X (shaded) · 0% chance over 30 yrs
- Wildfire 1/10 Low
- Heat 9/10 Extreme 7 d/yr ≥109°F today · 23 d/yr by 30 yrs out
- Wind 9/10 Extreme 99% chance of damaging wind over 30 yrs
- Air quality 2/10 Low 2 unhealthy d/yr today · 2 by 30 yrs out
Nearby sold comps map
Loading sold comps map…
Walkable amenities ~0.75 mi
Loading nearby amenities…
Taxation est. · year 1
- Rental income
- $33,015
- − Mortgage interest
- −$16,749
- − Property taxes
- −$4,485
- − Insurance
- −$1,495
- − Repairs & maintenance
- −$2,641
- − Management
- −$2,641
- − HOA
- −$1,800
- − Depreciation
- −$8,698
- Taxable loss
- −$5,494
- Est. tax savings @ 24.0%
- +$1,319
- After-tax cash flow
- $805/yr
For passive investors: Depreciation is non-cash, so a rental often shows a tax loss while cash-flowing — sheltering income. Rental losses are passive: they offset passive income freely, and up to $25,000/yr can offset ordinary (W-2) income if you actively participate and your MAGI is under $100k (phasing out to $0 by $150k); unused losses carry forward. On sale, claimed depreciation is recaptured at up to 25%, and gains may owe capital-gains tax (a 1031 exchange can defer both). Figures are a year-1 estimate at your 24.0% rate — not tax advice; consult a CPA.
Schools (NCES district)
- District
- Houston ISD
- NCES district ID
- 4823640
- Math proficiency
- 27% ▼ -18.00%
- Reading proficiency
- 35% ▼ -6.00%
- Median HH income
- $46,054
- Composite
- 26.63/100
- National rank
- #7173
- State rank
- #593 of 826 in TX
Livability — Bellaire
- Score
- 80/100
- State rank
- #32
- US rank
- #1639
Category grades
Schools grade is shown separately in the Schools card above.
Census & demographics
- Census place
- Bellaire, TX
- County
- Harris County · 4,702,590 people
- City population
- 17,213
- Metro
- Houston-The Woodlands-Sugar Land, TX
- Population (ZIP)
- 17,213
- Household income
- $243,750
- Rent vs Own
- Severe rent burden
- 229.0
Population outlook (Harris County) Hauer SSP2
- Today (2025)
- 5,571,493 people
- By 2030
- 6,089,821 · +9.3%
- By 2040
- 7,142,806 · +28.2%
- By 2050
- 8,185,864 · +46.9%
- By 2075
- 10,574,329 · +89.8%
- By 2100
- 12,109,958 · +117.4%
Race, ethnicity, and origin ACS 2023
- Neighborhood character
- Diverse neighborhood (Simpson 0.55)
- Race & ethnicity
- White 63% Asian 20% Hispanic / Latino 11% Two or more races 9%
- Hispanic origin (detail)
- Mexican 5%
- Common ancestry
- Scotch-Irish 5% Romanian 3% Lithuanian 3%
- Foreign-born
- 23% · China, Canada, Vietnam
- Languages at home
- 72% English-only · Chinese 9% Spanish 6% Arabic 4%
Political lean MEDSL · Harris
- 2024 margin
- Lean D (+5.5) · D 52.0% · R 46.4% · Other 1.6%
- 2008→2024 swing
- +3.9pp toward D · 2008: 1.6pp · 2024: 5.5pp
- All cycles
- 2024: D+5.5 2020: D+13.3 2016: D+12.4 2012: D+0.1 2008: D+1.6
Not yet ingested
- Civics
- —
Market trends
- HPI YoY
- ▼ -928.23%
- Current HPI
- 201.8362
- Rent YoY
- —
- Metro
- Houston-The Woodlands-Sugar Land, TX
- State GDP YoY
- ▲ 3.95%
- F500 in state
- 110
Industry mix (Fortune 500 HQ in TX)
| Industry | F500 HQs | Revenue |
|---|---|---|
| Energy | 16 | $1,198B |
|
||
| Technology | 5 | $198B |
|
||
| Engineering / Construction | 4 | $72B |
|
||
| Energy Services | 3 | $60B |
|
||
| Utilities | 3 | $41B |
|
||
| Healthcare | 2 | $330B |
|
||
Price history
-17.9% since first listed8 events — show timeline
- 2026-03-24 Pending — HARMLS
- 2026-03-16 Pending — HARMLS
- 2026-02-23 Price Changed $299,000 HARMLS
- 2026-01-29 Listed $315,000 HARMLS
- 2026-01-28 Listing Removed — HARMLS
- 2025-10-27 Price Changed $329,000 HARMLS
- 2025-08-21 Price Changed $349,000 HARMLS
- 2025-07-27 Listed $364,000 HARMLS
Cash-flow waterfall
monthlySold comps — $/sqft
last 12 mo · ≤1 miLoading sold comps…