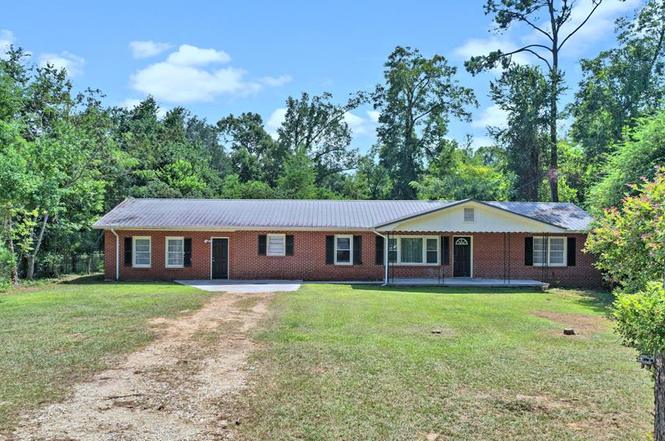
100 Honeysuckle Dr · Putney, GA
Flood risk 1/10 · Minimal
- FEMA flood zone
- X (unshaded)
- Chance of flooding over 30 yrs
- 0.0%
- Est. flood insurance / yr
- $507 – $1,088
Fire risk 5/10 · Moderate
- Est. fire insurance / yr
- $963 – $1,789
Heat risk 8/10 · Major
- Hot days now (above 110°F)
- 7 days/yr
- Hot days in 30 yrs
- 19 days/yr
Wind risk 8/10 · Major
- Chance of severe wind over 30 yrs
- 98.0%
Air-quality risk 4/10 · Minor
- Unhealthy air days now
- 5 days/yr
- Unhealthy air days in 30 yrs
- 5 days/yr
Risk factors via First Street. Map © Google.
Why this score? — see what drove the D- grade
The composite is a weighted blend of 9 inputs, each scored 0–100. Each bar is that input's sub-score; the figure is the points it added to the 100-point composite (weight × sub-score).
- Cash flow +10.7/30.0
- ARV discount +7.5/15.0
- Rent growth +4.5/5.0
- Livability +3.2/5.0
- DSCR +3.1/10.0
- 1% rule +2.7/10.0
- Condition / age +2.5/5.0
- Schools +1.1/10.0
- Appreciation +0.0/10.0
$169,900
🖨 Deal sheet (PDF) 📄 Offer letter ✓ Due diligence
Listing remarks
A lot of livin' to do and this home has LOTS of room with 4 BRS. Previous owners were using two added rooms for bedrooms. (Neither has a closet) Lots of potential for a new homeowner who needs space for family. 3,000 SF! What a deal!!
Key facts
- 0.86 acre lot
- 2 parking spots
- Built 1970
Neighborhood map
What this means for you Summary
Snapshot
- This is a 3-bed/1.5-bath single-family listed at $170k.
Deal economics
- At list price, monthly cash flow is $-79 ($-952/yr) — negative.
- To cash-flow at today's rent, offer at most $156k (8.3% below list).
- To meet the 1% rule (rent ≥ 1% of price), the offer needs to be $132k (22.6% below list).
- Recommended offer: $132k (22.6% below list) — sets the bar for 1% rule.
Location & tenants
- Location reads 65/100 on livability (#234 in GA) — a middle-class / working-renter tenant base. Strengths: crime A+, cost of living A+, housing A+; Watch: employment D+, amenities F, commute F.
- Dougherty County (urban): math 12% / reading 16% proficiency, ranked #163 of 174 in GA (top 94%) — low school quality limits family demand, transient renter base, plan for 1-2y turnover; 79% free/reduced lunch — lower-income household profile, screen leases tightly.
- Zoned schools: Radium Springs Elementary School (math 12% / reading 12%, grade F, #1,041 of 1,228 statewide, top 87%, 423 students, 100% FRL); Radium Springs Middle School (math 2% / reading 8%, grade F, #462 of 470 statewide, top 99%, 919 students, 100% FRL); Dougherty Comprehensive High School (math 2% / reading 5%, grade F, #413 of 424 statewide, top 99%, 1,204 students, 100% FRL) — zoned schools average 100% FRL vs 79% district-wide (21 pts higher); higher-poverty schools than district average — tighter screening recommended.
- Market conditions: Rents rising fast (+8.1%/yr); 128 active listings in the ZIP; lower-income renter base — watch delinquency; 45 units permitted in Dougherty County in 2024 (20 in 5+ unit buildings).
- This rent runs 37% of the median local income ($43k/yr) — at the standard rent-burdened threshold; future hikes will face affordability resistance.
Forward outlook
- Local home prices are declining (-3.0%/yr); year-one equity from $1k of loan paydown is wiped out by about $5k of value loss. Plan a longer hold.
- Dougherty County population projected at -24% by 2050 — secular population decline; favor cash flow + early exit over multi-decade hold.
Negotiation context
- It's been on market 41 days — a 3% lower offer ($165k) is reasonable based on typical stale-listing flexibility.
- 2 sale attempts with the ask held roughly flat each time — persistent listings suggest the price (not the market) is what's stuck; bring a comps-based counter.
- Current owner paid $98k; list at $170k implies a 73% gain — meaningful room to come down on a strong offer.
Risks & watch-outs
- Climate carrying-cost: severe wind risk, 98% chance of damaging wind over 30y; moderate wildfire risk; extreme-heat days projected 7→19/yr by 2055 (HVAC capex compounding) — expect insurance premiums to compound above CPI over the hold.
Questions for the listing agent
- What do current leases actually rent for vs. the listed asking? Can we see a recent rent roll and the last 12 months of T-12 income?
- It's been on market 41 days. Have you received any prior offers? Is the seller open to a 23% concession, seller financing, or rate buy-down credit?
- Built in 1970 — when were the roof, HVAC, electrical panel, plumbing, and water heater last replaced?
- Is there a deadline driving the sale (1031 exchange, divorce, estate, relocation)? That informs how much negotiation room exists.
- Schools are F-rated, which usually means shorter tenancies and higher turnover. Who's the typical renter profile here, and what's been the actual vacancy rate?
- The area grade is low — what's the realistic commute time and amenity access for the typical tenant pool here? Any planned neighborhood developments (good or bad) we should know about?
- What's the average days-on-market for RENTAL listings here right now (not sales)? A rising rental-DOM trend means longer vacancies and softer asking-rent achievability than the comps imply.
- What's the recent tenant-quality profile in this submarket — average credit score on applications, eviction rate, late-payment / NSF rate, and stable-employment percentage? A property-management company in the area should have these aggregated.
- How much new for-sale + rental construction is in the pipeline within 1–3 miles? Heavy new supply typically softens prices + rents 12–24 months out; constrained supply supports both.
Investment metrics
- 1% rule
- 0.77% ✗
- Cap rate
- 5.73%
- Cash-on-cash
- -2.00%
- DSCR
- 0.91
- GRM
- 10.8
CMA / ARV
No comps found within radius.
Projected returns pro-forma
-3.0% appreciation · 8.0% rent growth · sell at horizon
- IRR
- -14.4%
- Equity multiple
- 0.46×
- Total profit
- $-25,648
- Equity at exit
- $25,333
- IRR
- 0.7%
- Equity multiple
- 1.06×
- Total profit
- $2,741
- Equity at exit
- $14,690
Cash invested: $47,572 (down + closing). Projections, not guarantees.
Landlord ↔ Tenant lean methodology
- Overall (STATE)
- 90 Strongly Landlord-Friendly
- State Georgia
- 90 Strongly Landlord-Friendly · R+3
- County
- — inherits STATE
- City
- — inherits STATE
ZIP-level market 31705
- Home prices YoY
- -20.1%
- Rents YoY
- 8.1%
- Active inventory
- 128
- Price-to-rent
- 10.8×
Monthly cashflow live
- Estimated rent
- $1,316 medium interval (Pro) →
- Mortgage (P&I)
- −$891
- Tax from tax record
- −$157 /mo · $1,882/yr
- Insurance
- −$71
- HOA
- −$0
- Vacancy / Maint / Mgmt
- −$276
- Net cashflow
- $-79
Break-even live
Sensitivity live
| Price | -10% $17 | -5% $-31 | +0% $-79 | +5% $-127 | +10% $-176 |
|---|---|---|---|---|---|
| Rent | -10% $-183 | -5% $-131 | +0% $-79 | +5% $-27 | +10% $25 |
| Rate | -1.0pp $6 | -0.5pp $-36 | base $-79 | +0.5pp $-123 | +1.0pp $-168 |
UW: 25.0% down · 7.5% · 30yr · 1.5% tax · 5.0% vac · 8.0% maint · 8.0% mgmt
Financing live
Cash to close
- Down payment
- $42,475
- Closing costs
- $5,097
- Reserves months
- —
- Total cash needed
- —
Loan-product check · same deal, 3 products live
Conventional
25% down · 7.5% · 30yr
- Down + closing
- —
- Monthly P&I
- —
- Monthly cashflow
- —
- DSCR
- —
- Eligible?
- —
Personal DTI + credit; lowest rate.
DSCR
20% down · 8.5% · 30yr
- Down + closing
- —
- Monthly P&I
- —
- Monthly cashflow
- —
- DSCR
- —
- Eligible?
- —
No personal income docs; deal must DSCR.
Hard money
10% down · 12.0% · 12mo
- Down + closing
- —
- Monthly P&I
- —
- Monthly cashflow
- —
- DSCR
- —
- Eligible?
- —
Short-term bridge; refi at stabilization.
Listing history 22 events
-
2026-06-22status $169,900 Pending 41 DOM
-
2026-06-19days on market $169,900 Active 41 DOM
-
2026-06-18days on market $169,900 Active 40 DOM
-
2026-06-17days on market $169,900 Active 39 DOM
-
2026-06-16days on market $169,900 Active 38 DOM
-
2026-06-15days on market $169,900 Active 37 DOM
-
2026-06-14days on market $169,900 Active 35 DOM
-
2026-06-13days on market $169,900 Active 34 DOM
-
2026-06-10days on market $169,900 Active 32 DOM
-
2026-06-09days on market $169,900 Active 31 DOM
-
2026-06-08days on market $169,900 Active 30 DOM
-
2026-06-07days on market $169,900 Active 29 DOM
-
2026-06-05days on market $169,900 Active 26 DOM
-
2026-06-02days on market $169,900 Active 24 DOM
-
2026-06-01days on market $169,900 Active 23 DOM
-
2026-05-31days on market $169,900 Active 22 DOM
-
2026-05-30days on market $169,900 Active 21 DOM
-
2026-03-18status Pending
-
2026-03-14status Active
-
2026-03-10status Pending
-
2025-09-01$169,900 Active
-
2013-02-11soldstatus $98,200
ⓘ Source: listings_history table (triggers on properties + properties_extension) + one-shot
backfill from property_details.listing_events for pre-trigger history.
Tax reassessment forecast GA · Resets to sale price
- Current annual tax
- $1,882 · $157/mo
- Projected year-2 tax
- $1,882 · $157/mo
- Expected delta
- $0/yr ($0/mo · 0.0%)
ⓘ Screening estimate from a state-policy table — verify with the county assessor before closing.
Climate risk First Street
- Flood 1/10 Low FEMA zone X (unshaded) · 0% chance over 30 yrs
- Wildfire 5/10 Major
- Heat 8/10 Severe 7 d/yr ≥110°F today · 19 d/yr by 30 yrs out
- Wind 8/10 Severe 98% chance of damaging wind over 30 yrs
- Air quality 4/10 Moderate 5 unhealthy d/yr today · 5 by 30 yrs out
Nearby sold comps map
Loading sold comps map…
Walkable amenities ~0.75 mi
Loading nearby amenities…
Taxation est. · year 1
- Rental income
- $15,786
- − Mortgage interest
- −$9,517
- − Property taxes
- −$1,882
- − Insurance
- −$850
- − Repairs & maintenance
- −$1,263
- − Management
- −$1,263
- − Depreciation
- −$4,943
- Taxable loss
- −$3,931
- Est. tax savings @ 24.0%
- +$943
- After-tax cash flow
- $-9/yr
For passive investors: Depreciation is non-cash, so a rental often shows a tax loss while cash-flowing — sheltering income. Rental losses are passive: they offset passive income freely, and up to $25,000/yr can offset ordinary (W-2) income if you actively participate and your MAGI is under $100k (phasing out to $0 by $150k); unused losses carry forward. On sale, claimed depreciation is recaptured at up to 25%, and gains may owe capital-gains tax (a 1031 exchange can defer both). Figures are a year-1 estimate at your 24.0% rate — not tax advice; consult a CPA.
Schools (NCES district)
- District
- Dougherty County
- NCES district ID
- 1301830
- Math proficiency
- 12% ▼ -15.00%
- Reading proficiency
- 16% ▼ -9.00%
- Median HH income
- $33,105
- Composite
- 11.31/100
- National rank
- #9716
- State rank
- #163 of 174 in GA
Livability — Putney
- Score
- 65/100
- State rank
- #234
- US rank
- #13458
Category grades
Schools grade is shown separately in the Schools card above.
Census & demographics
- County
- Dougherty County · 89,040 people
- Metro
- Albany, GA
- Population (ZIP)
- 30,791
- Household income
- $42,972
- Rent vs Own
- Severe rent burden
- 1933.0
Population outlook (Dougherty County) Hauer SSP2
- Today (2025)
- 84,551 people
- By 2030
- 80,637 · -4.6%
- By 2040
- 72,090 · -14.7%
- By 2050
- 64,056 · -24.2%
- By 2075
- 46,332 · -45.2%
- By 2100
- 33,127 · -60.8%
Race, ethnicity, and origin ACS 2023
- Neighborhood character
- Predominantly Black (68%)
- Race & ethnicity
- Black 68% White 23% Hispanic / Latino 6% Two or more races 4%
- Hispanic origin (detail)
- Mexican 2% Puerto Rican 1%
- Common ancestry
- Lithuanian 1%
- Foreign-born
- 3% · Canada
- Languages at home
- 94% English-only · Spanish 5% Other Asian/Pacific 1%
Political lean MEDSL · Dougherty
- 2024 margin
- Solid D (+41.1) · D 70.4% · R 29.3%
- 2008→2024 swing
- +6.2pp toward D · 2008: 35.0pp · 2024: 41.1pp
- All cycles
- 2024: D+41.1 2020: D+40.0 2016: D+38.3 2012: D+39.0 2008: D+35.0
Not yet ingested
- Civics
- —
Market trends
- HPI YoY
- ▼ -38.46%
- Current HPI
- 152.4574
- Rent YoY
- ▲ 8.10%
- Metro
- Albany, GA
- State GDP YoY
- ▲ 2.66%
- F500 in state
- 28
Industry mix (Fortune 500 HQ in GA)
| Industry | F500 HQs | Revenue |
|---|---|---|
| Paper / Packaging | 2 | $29B |
|
||
| Retail | 1 | $160B |
|
||
| Transportation / Logistics | 1 | $91B |
|
||
| Airlines | 1 | $62B |
|
||
| Consumer Goods | 1 | $47B |
|
||
| Utilities | 1 | $25B |
|
||
Price history
+73.0% since first listed5 events — show timeline
- 2026-03-18 Pending — SWGABOR
- 2026-03-14 Relisted — SWGABOR
- 2026-03-10 Pending — SWGABOR
- 2025-09-01 Listed $169,900 SWGABOR
- 2013-02-11 Sold (Public Records) $98,200 Public Records
Property tax history
+2.0%/yrLatest (2025): $1,882 · +6.4% YoY. Source: county tax records.
Cash-flow waterfall
monthlySold comps — $/sqft
last 12 mo · ≤1 miLoading sold comps…