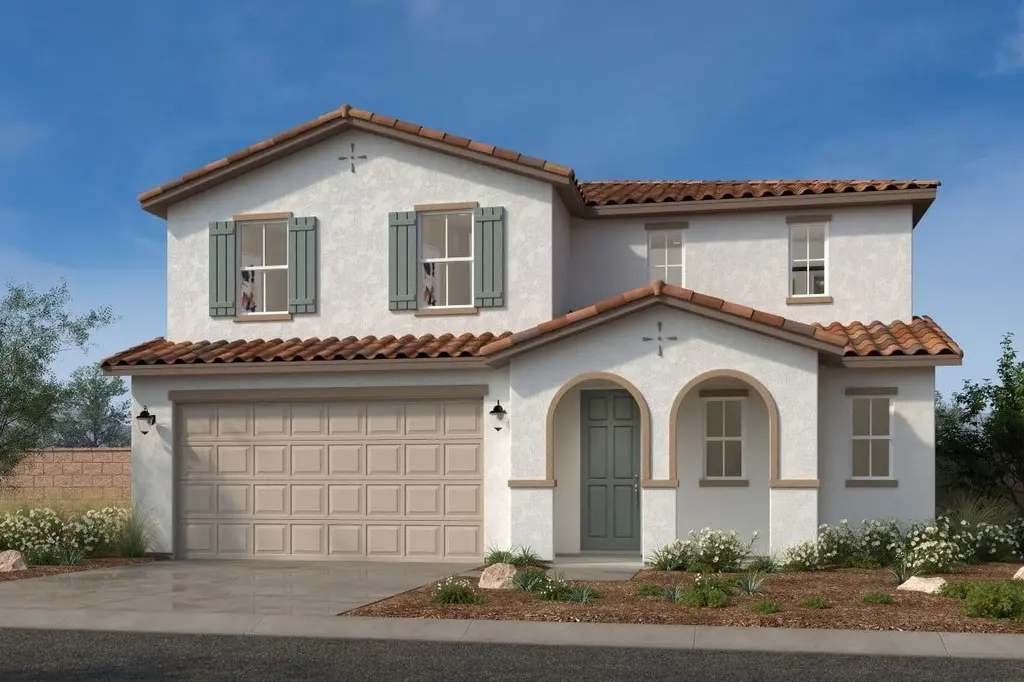
31289 Pine Oak Rd · Menifee, CA
Flood risk No data
- FEMA flood zone
- —
- Chance of flooding over 30 yrs
- —
- Est. flood insurance / yr
- —
Fire risk No data
- Est. fire insurance / yr
- —
Heat risk No data
- Hot days now (above threshold)
- —
- Hot days in 30 yrs
- —
Wind risk No data
- Chance of severe wind over 30 yrs
- —
Air-quality risk No data
- Unhealthy air days now
- —
- Unhealthy air days in 30 yrs
- —
Risk factors via First Street. Map © Google.
Why this score? — see what drove the D+ grade
The composite is a weighted blend of 9 inputs, each scored 0–100. Each bar is that input's sub-score; the figure is the points it added to the 100-point composite (weight × sub-score).
- ARV discount +12.5/15.0
- Appreciation +10.0/10.0
- Cash flow +7.3/30.0
- Schools +4.5/10.0
- Livability +3.2/5.0
- Condition / age +2.5/5.0
- Rent growth +2.3/5.0
- 1% rule +2.1/10.0
- DSCR +1.5/10.0
$677,248
🖨 Deal sheet (PDF) 📄 Offer letter ✓ Due diligence
Listing remarks
This stunning, two-story home showcases a welcoming front porch. Inside, discover an open floor plan with 9-ft. ceilings and durable luxury vinyl plank flooring at main living areas. The kitchen boasts an island, white thermofoil cabinets, quartz countertops, Whirlpool® stainless steel appliances and single-basin sink. Upstairs, a versatile loft awaits. The primary suite includes a spacious walk-in closet, plush carpeting and connecting bath with cultured marble countertops, oval undermount sinks, a linen closet and walk-in shower. Additional highlights include a solar energy system (purchase or lease required), LED lighting, electric charging station pre-wiring, smart thermostat and al
Key facts
- Open floor plan
- Quartz countertops
- Front porch
Tags
Property features AI
Finance
- Other: Address: 31289 Pine Oak Rd, Winchester CA 92596; Listing modified May 23, 2026
- Financial info: List price $677,248
Exterior
- Parking: 2 garage spaces (2 total parking spaces)
- Home design: Single-family home; Active listing
- Exterior features: Living area approximately 2,763
Interior
- Bedrooms: 5 bedrooms
- Bathrooms: 3 full bathrooms and 1 half bathroom (3.5 total)
- Interior features: Spec new-construction home (Plan 2763 Modeled)
Neighborhood map
What this means for you Summary
Snapshot
- This is a 5-bed/3.5-bath single-family listed at $677k.
Deal economics
- At list price, monthly cash flow is $-888 ($-11k/yr) — negative.
- To cash-flow at today's rent, offer at most $549k (19.0% below list).
- To meet the 1% rule (rent ≥ 1% of price), the offer needs to be $480k (29.1% below list).
- Recommended offer: $480k (29.1% below list) — sets the bar for 1% rule.
- Cap rate 4.7% vs local median 3.6% in Menifee — top-decile yield for the area; either an underpriced asset or a hidden risk that comps aren't pricing in. Stress-test before assuming the spread holds.
Location & tenants
- Location reads 64/100 on livability (#407 in CA) — a middle-class / working-renter tenant base. Strengths: housing A+, crime A, employment A-; Watch: health & safety D+, amenities D, commute F.
- Menifee Union Elementary (suburban): math 43% / reading 56% proficiency, ranked #434 of 1,400 in CA (top 31%) — families likely to look elsewhere, expect single-tenant / working-renter base with shorter leases.
- Zoned schools: Southshore Elementary (874 students, 52% FRL); Bell Mountain Middle (math 24% / reading 24%, grade F, #277 of 498 statewide, top 73%, 1,097 students, 57% FRL) — zoned schools average 54% FRL vs 32% district-wide (22 pts higher); higher-poverty schools than district average — tighter screening recommended.
- Zoned-school proficiency averages 24% at this address vs 50% district-wide (-25 pts) — the specific schools serving this property underperform the Menifee Union Elementary average; the district grade overstates school quality for this exact location.
- Market conditions: Rents soft (-0.8%/yr); 353 active listings in the ZIP; 2 comparable units currently listed for rent nearby; high-income renter base; 9,195 units permitted in Riverside County in 2024 (1,512 in 5+ unit buildings).
- This rent runs 43% of the median local income ($133k/yr) — at the standard rent-burdened threshold; future hikes will face affordability resistance.
Forward outlook
- In year one you build about $72k of equity ($5k loan paydown + $68k appreciation (10.0% local appreciation)).
- Riverside County population projected at +22% by 2050 — long-run rental-demand tailwind backs the buy-and-hold thesis.
- By year 2, paydown + projected appreciation supports a ~$116k cash-out refi (75% LTV) — recoverable capital for the next deal without selling this one.
Negotiation context
- Only 11 days on market — expect competitive offers; lowballing is unlikely to land.
Questions for the listing agent
- What do current leases actually rent for vs. the listed asking? Can we see a recent rent roll and the last 12 months of T-12 income?
- Is there a deadline driving the sale (1031 exchange, divorce, estate, relocation)? That informs how much negotiation room exists.
- Schools are D-rated, which usually means shorter tenancies and higher turnover. Who's the typical renter profile here, and what's been the actual vacancy rate?
- The area grade is low — what's the realistic commute time and amenity access for the typical tenant pool here? Any planned neighborhood developments (good or bad) we should know about?
- What's the average days-on-market for RENTAL listings here right now (not sales)? A rising rental-DOM trend means longer vacancies and softer asking-rent achievability than the comps imply.
- What's the recent tenant-quality profile in this submarket — average credit score on applications, eviction rate, late-payment / NSF rate, and stable-employment percentage? A property-management company in the area should have these aggregated.
- How much new for-sale + rental construction is in the pipeline within 1–3 miles? Heavy new supply typically softens prices + rents 12–24 months out; constrained supply supports both.
Investment metrics
- 1% rule
- 0.71% ✗
- Cap rate
- 4.72%
- Cash-on-cash
- -5.62%
- DSCR
- 0.75
- GRM
- 11.8
CMA / ARV
- ARV (on-the-fly)
- $762,588
- Comps found
- 2
Show comp detail 2 sales within ~0.75 mi
| Address | Dist | Beds/Ba | Sqft | Sold | Price | $/sf | Match |
|---|---|---|---|---|---|---|---|
| 31264 Pine Oak Rd | 0.04mi | 4/3.5 (-1) | 2,763 (0%) | 1mo | $657,990 | $238 | 92 |
| 31372 Pine Oak Rd | 0.07mi | 4/3.0 (-1) | 2,453 (-11%) | 1mo | $677,095 | $276 | 70 |
Match score weights: distance 35% · size 25% · config 20% · recency 20%. Top-matched comps best support the ARV.
Projected returns pro-forma
10.0% appreciation · 0.0% rent growth · sell at horizon
- IRR
- 19.5%
- Equity multiple
- 2.57×
- Total profit
- $298,280
- Equity at exit
- $610,119
- IRR
- 17.4%
- Equity multiple
- 5.73×
- Total profit
- $897,829
- Equity at exit
- $1,315,744
Cash invested: $189,629 (down + closing). Projections, not guarantees.
Landlord ↔ Tenant lean methodology
- Overall (STATE)
- 18 Strongly Tenant-Friendly
- State California
- 18 Strongly Tenant-Friendly · D+13
- County
- — inherits STATE
- City
- — inherits STATE
ZIP-level market 92596
- Home prices YoY
- 3.9%
- Rents YoY
- -0.8%
- Active inventory
- 353
- Price-to-rent
- 11.8×
Monthly cashflow live
- Estimated rent
- $4,800 medium interval (Pro) →
- Mortgage (P&I)
- −$3,552
- Tax est. 1.5%
- −$847 /mo · $10,159/yr
- Insurance
- −$282
- HOA
- −$0
- Vacancy / Maint / Mgmt
- −$1,008
- Net cashflow
- $-888
Break-even live
Sensitivity live
| Price | -10% $-420 | -5% $-654 | +0% $-888 | +5% $-1,122 | +10% $-1,356 |
|---|---|---|---|---|---|
| Rent | -10% $-1,267 | -5% $-1,078 | +0% $-888 | +5% $-699 | +10% $-509 |
| Rate | -1.0pp $-547 | -0.5pp $-716 | base $-888 | +0.5pp $-1,064 | +1.0pp $-1,242 |
UW: 25.0% down · 7.5% · 30yr · 1.5% tax · 5.0% vac · 8.0% maint · 8.0% mgmt
Financing live
Cash to close
- Down payment
- $169,312
- Closing costs
- $20,317
- Reserves months
- —
- Total cash needed
- —
Loan-product check · same deal, 3 products live
Conventional
25% down · 7.5% · 30yr
- Down + closing
- —
- Monthly P&I
- —
- Monthly cashflow
- —
- DSCR
- —
- Eligible?
- —
Personal DTI + credit; lowest rate.
DSCR
20% down · 8.5% · 30yr
- Down + closing
- —
- Monthly P&I
- —
- Monthly cashflow
- —
- DSCR
- —
- Eligible?
- —
No personal income docs; deal must DSCR.
Hard money
10% down · 12.0% · 12mo
- Down + closing
- —
- Monthly P&I
- —
- Monthly cashflow
- —
- DSCR
- —
- Eligible?
- —
Short-term bridge; refi at stabilization.
Rent comps 2 comps
| Address | Beds | Baths | Sqft | Rent | $/sqft | DOM | Units | Dist |
|---|---|---|---|---|---|---|---|---|
| 32257 Jeter Ln Menifee, CA | 4.0 | 3.0 | 2497 | $4,200 | $1.68 | 6d | 1 | 0.99mi |
| 30449 Pipkin Ct Menifee, CA | 4.0 | 3.5 | 2653 | $3,800 | $1.43 | 14d | 1 | 1.22mi |
Listing history 4 events
-
2026-06-03days on market $677,248 Active 11 DOM
-
2026-06-02days on market $677,248 Active 10 DOM
-
2026-06-01days on market $677,248 Active 9 DOM
-
2026-05-31days on market $677,248 Active 8 DOM
ⓘ Source: listings_history table (triggers on properties + properties_extension) + one-shot
backfill from property_details.listing_events for pre-trigger history.
Nearby sold comps map
Loading sold comps map…
Walkable amenities ~0.75 mi
Loading nearby amenities…
Taxation est. · year 1
- Rental income
- $57,601
- − Mortgage interest
- −$37,936
- − Property taxes
- −$10,159
- − Insurance
- −$3,386
- − Repairs & maintenance
- −$4,608
- − Management
- −$4,608
- − Depreciation
- −$19,702
- Taxable loss
- −$22,798
- Est. tax savings @ 24.0%
- +$5,472
- After-tax cash flow
- $-5,187/yr
For passive investors: Depreciation is non-cash, so a rental often shows a tax loss while cash-flowing — sheltering income. Rental losses are passive: they offset passive income freely, and up to $25,000/yr can offset ordinary (W-2) income if you actively participate and your MAGI is under $100k (phasing out to $0 by $150k); unused losses carry forward. On sale, claimed depreciation is recaptured at up to 25%, and gains may owe capital-gains tax (a 1031 exchange can defer both). Figures are a year-1 estimate at your 24.0% rate — not tax advice; consult a CPA.
Schools (NCES district)
- District
- Menifee Union Elementary
- NCES district ID
- 0624540
- Math proficiency
- 43% ▬ 0.00%
- Reading proficiency
- 56% ▲ 3.00%
- Median HH income
- $58,228
- Composite
- 45.17/100
- National rank
- #5790
- State rank
- #434 of 1400 in CA
Livability — Menifee
- Score
- 64/100
- State rank
- #407
- US rank
- #13882
Category grades
Schools grade is shown separately in the Schools card above.
Census & demographics
- County
- Riverside County · 2,287,001 people
- City population
- 111,667
- Metro
- Riverside-San Bernardino-Ontario, CA
- Population (ZIP)
- 38,981
- Household income
- $132,538
- Rent vs Own
- Severe rent burden
- 591.0
Population outlook (Riverside County) Hauer SSP2
- Today (2025)
- 2,664,475 people
- By 2030
- 2,802,692 · +5.2%
- By 2040
- 3,050,904 · +14.5%
- By 2050
- 3,256,783 · +22.2%
- By 2075
- 3,655,058 · +37.2%
- By 2100
- 3,766,594 · +41.4%
Race, ethnicity, and origin ACS 2023
- Neighborhood character
- Highly diverse neighborhood (Simpson 0.72)
- Race & ethnicity
- White 38% Hispanic / Latino 34% Two or more races 16% Asian 12% Black 6% Pacific Islander 2%
- Hispanic origin (detail)
- Mexican 29%
- Common ancestry
- Slovak 3% Italian 2% Portuguese 1%
- Foreign-born
- 14% · Canada, Vietnam
- Languages at home
- 76% English-only · Spanish 16% Tagalog/Filipino 4% Vietnamese 1%
Political lean MEDSL · Riverside
- 2024 margin
- Toss-up / Even · D 48.0% · R 49.3% · Other 2.6%
- 2008→2024 swing
- -3.6pp toward R · 2008: 2.3pp · 2024: -1.3pp
- All cycles
- 2024: R+1.3 2020: D+8.0 2016: D+4.3 2012: R+0.4 2008: D+2.3
Not yet ingested
- Civics
- —
Market trends
- HPI YoY
- ▲ 12.43%
- Current HPI
- 332.169
- Rent YoY
- ▼ -0.79%
- Metro
- Riverside-San Bernardino-Ontario, CA
- State GDP YoY
- ▲ 3.21%
- F500 in state
- 116
Industry mix (Fortune 500 HQ in CA)
| Industry | F500 HQs | Revenue |
|---|---|---|
| Technology | 27 | $1,492B |
|
||
| Financial Services | 3 | $174B |
|
||
| Retail | 3 | $44B |
|
||
| Insurance | 3 | $26B |
|
||
| Media / Entertainment | 2 | $115B |
|
||
| Pharmaceuticals / Biotech | 2 | $62B |
|
||
Cash-flow waterfall
monthlySold comps — $/sqft
last 12 mo · ≤1 miLoading sold comps…