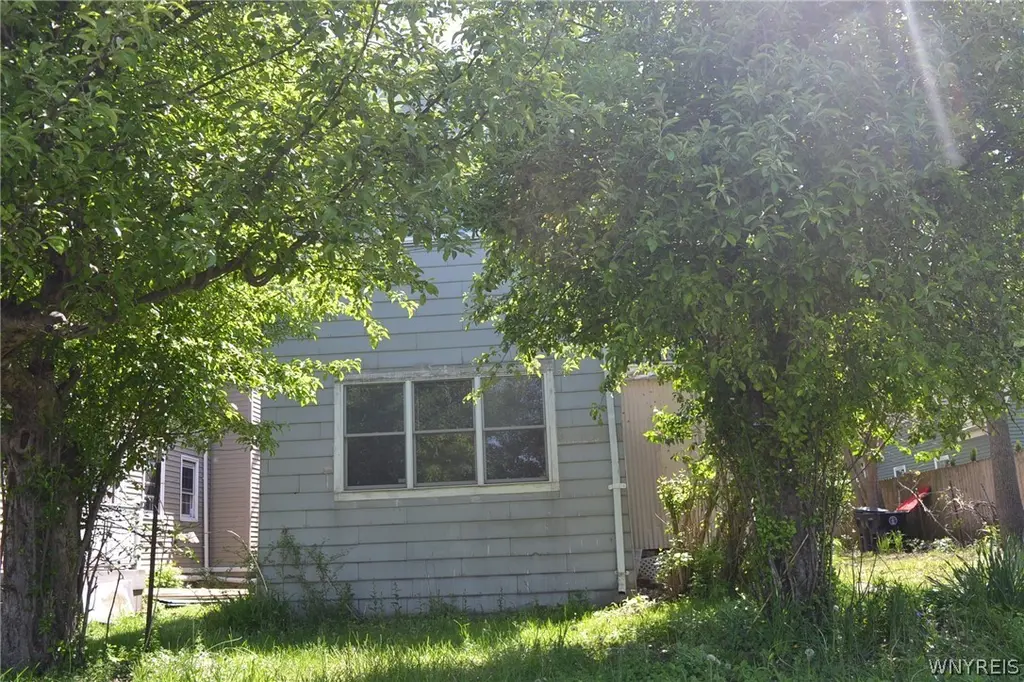
68 Pleasant Ave · Lancaster, NY
Flood risk 1/10 · Minimal
- FEMA flood zone
- X (unshaded)
- Chance of flooding over 30 yrs
- 0.0%
- Est. flood insurance / yr
- $473 – $860
Fire risk 2/10 · Minimal
- Est. fire insurance / yr
- $691 – $1,283
Heat risk 2/10 · Minimal
- Hot days now (above 92°F)
- 7 days/yr
- Hot days in 30 yrs
- 15 days/yr
Wind risk 1/10 · Minimal
- Chance of severe wind over 30 yrs
- —
Air-quality risk 3/10 · Minor
- Unhealthy air days now
- 2 days/yr
- Unhealthy air days in 30 yrs
- 3 days/yr
Risk factors via First Street. Map © Google.
Why this score? — see what drove the B grade
The composite is a weighted blend of 9 inputs, each scored 0–100. Each bar is that input's sub-score; the figure is the points it added to the 100-point composite (weight × sub-score).
- Cash flow +30.0/30.0
- 1% rule +10.0/10.0
- DSCR +10.0/10.0
- ARV discount +7.5/15.0
- Schools +5.2/10.0
- Livability +3.9/5.0
- Rent growth +2.5/5.0
- Condition / age +2.5/5.0
- Appreciation +0.0/10.0
$49,900
🖨 Deal sheet 📄 Offer letter ✓ Due diligence
Listing remarks
Looking for that summer project?? Here you go! This 3 bedroom, 2 full bathroom single family home could be turned into a two-unit for extra income. Located in the Village of Lancaster - within walking distance to all the village amenities. Check this one out today!
Key facts
- Walking distance
- Two-unit
- Village amenities
Tags
Property features AI
Exterior
- Parking: Detached garage; One garage space
- Utilities: Public water connected; Sewer connected
- Home design: Two-story house; Existing construction
- Construction: Aluminum siding; Fiber cement siding; Asphalt roof; Stone foundation
- Exterior features: Gravel driveway; Rectangular lot (approx. 107 x 41)
Interior
- Bedrooms: One main-level bedroom
- Flooring: Hardwood; Laminate; Varies
- Bathrooms: Two full bathrooms; One bathroom on the main level
- Heating & cooling: Gas forced-air heating
- Interior features: Separate/formal dining room; Bedroom on main level; Partial basement
- Laundry & utility: Gas water heater
Neighborhood map
What this means for you Summary
Snapshot
- This is a 3-bed/1.0-bath single-family listed at $50k.
Deal economics
- At list price, monthly cash flow is $1k ($14k/yr) — positive.
- The deal already cash-flows at list — no discount required.
- Meets the 1% rule at list price ($2k rent vs $50k).
- Recommended offer: $49k (1.5% below list) — sets the bar for market timing.
- Cap rate 34.0% vs local median 2.9% in Lancaster — top-decile yield for the area; either an underpriced asset or a hidden risk that comps aren't pricing in. Stress-test before assuming the spread holds.
Location & tenants
- Location reads 78/100 on livability (#164 in NY, #2,566 nationally) — a middle-class / working-renter tenant base. Strengths: crime A+, housing A+, health & safety A+; Watch: amenities F, commute F.
- Lancaster Central School District (suburban): math 57% / reading 61% proficiency, ranked #234 of 590 in NY (top 40%) — acceptable for families but not a draw, mixed tenant base, ~2y average lease; only 14% free/reduced lunch — higher-income household profile.
- Market conditions: 152 active listings in the ZIP; 4 comparable units currently listed for rent nearby; rentals lingering (median 44d on market — plan ~5-8 weeks vacancy on turnover, expect pricing pressure); 50% of comp listings sitting > 30 days — soft ceiling on asking rent; solid renter incomes; 1,244 units permitted in Erie County in 2024 (563 in 5+ unit buildings).
Forward outlook
- Local home prices are declining (-3.0%/yr); year-one equity from $345 of loan paydown is wiped out by about $1k of value loss. Plan a longer hold.
- At projected returns (-3.0% appreciation + 3.0% rent growth), your $14k cash investment doubles in ~2 years — after that, you're playing with house money.
Negotiation context
- It's been on market 18 days — a 2% lower offer ($49k) is reasonable based on typical stale-listing flexibility.
Risks & watch-outs
- Watch-outs: built in 1860 — expect roof / HVAC / electrical / plumbing capex.
Questions for the listing agent
- Built in 1860 — when were the roof, HVAC, electrical panel, plumbing, and water heater last replaced?
- Is there a deadline driving the sale (1031 exchange, divorce, estate, relocation)? That informs how much negotiation room exists.
- Schools are A-rated — typically a magnet for longer-tenancy family renters. What's the average tenant stay here, and is there a school-zone premium baked into asking?
- What's the average days-on-market for RENTAL listings here right now (not sales)? A rising rental-DOM trend means longer vacancies and softer asking-rent achievability than the comps imply.
- What's the recent tenant-quality profile in this submarket — average credit score on applications, eviction rate, late-payment / NSF rate, and stable-employment percentage? A property-management company in the area should have these aggregated.
- How much new for-sale + rental construction is in the pipeline within 1–3 miles? Heavy new supply typically softens prices + rents 12–24 months out; constrained supply supports both.
Investment metrics
- 1% rule
- 3.80% ✓
- Cap rate
- 34.04%
- Cash-on-cash
- 99.09%
- DSCR
- 5.41
- GRM
- 2.2
CMA / ARV
- ARV (on-the-fly)
- $307,395
- Comps found
- 12
Show comp detail 12 sales within ~0.75 mi
| Address | Dist | Beds/Ba | Sqft | Sold | Price | $/sf | Match |
|---|---|---|---|---|---|---|---|
| 41 School St | 0.14mi | 3/1.5 | 1,824 (-2%) | 2mo | $280,000 | $154 | 86 |
| 60 Court St | 0.29mi | 4/2.0 (+1) | 1,820 (-2%) | 6mo | $300,000 | $165 | 69 |
| 50 Cambria St | 0.30mi | 3/2.0 | 1,800 (-3%) | 10mo | $330,000 | $183 | 68 |
| 27 Saint Joseph St | 0.33mi | 4/1.0 (+1) | 1,738 (-7%) | 6mo | $300,000 | $173 | 64 |
| 27 Lombardy St | 0.47mi | 3/1.5 | 1,712 (-8%) | 2mo | $242,500 | $142 | 61 |
| 23 N Aurora St | 0.33mi | 3/2.0 | 1,760 (-6%) | 16mo | $238,000 | $135 | 58 |
| 15 Holland Ave | 0.28mi | 3/2.5 | 1,658 (-11%) | 7mo | $310,000 | $187 | 57 |
| 23 Saint John St | 0.46mi | 3/1.5 | 1,656 (-11%) | 8mo | $210,000 | $127 | 52 |
| 17 Court St | 0.40mi | 3/1.0 | 1,610 (-14%) | 10mo | $311,000 | $193 | 51 |
| 9 Kurtz Ave | 0.60mi | 3/1.5 | 1,731 (-7%) | 10mo | $275,000 | $159 | 50 |
| 59 W Drullard Ave | 0.70mi | 4/2.5 (+1) | 1,968 (+6%) | 2mo | $310,000 | $158 | 45 |
| 5 Rose St | 0.65mi | 4/3.0 (+1) | 2,052 (+10%) | 10mo | $500,000 | $244 | 31 |
Match score weights: distance 35% · size 25% · config 20% · recency 20%. Top-matched comps best support the ARV.
Projected returns pro-forma
-3.0% appreciation · 3.0% rent growth · sell at horizon
- IRR
- —
- Equity multiple
- 5.68×
- Total profit
- $65,422
- Equity at exit
- $7,440
- IRR
- —
- Equity multiple
- 11.86×
- Total profit
- $151,700
- Equity at exit
- $4,314
Cash invested: $13,972 (down + closing). Projections, not guarantees.
Landlord ↔ Tenant lean methodology
- Overall (STATE)
- 15 Strongly Tenant-Friendly
- State New York
- 15 Strongly Tenant-Friendly · D+10
- County
- — inherits STATE
- City
- — inherits STATE
ZIP-level market 14086
- Home prices YoY
- -30.5%
- Active inventory
- 152
- Price-to-rent
- 2.2×
Monthly cashflow live
- Estimated rent
- $1,897 medium interval (Pro) →
- Mortgage (P&I)
- −$262
- Tax est. 1.5%
- −$62 /mo · $748/yr
- Insurance
- −$21
- HOA
- −$0
- Vacancy / Maint / Mgmt
- −$398
- Net cashflow
- $1,154
Break-even live
UW: 25.0% down · 7.5% · 30yr · 1.5% tax · 5.0% vac · 8.0% maint · 8.0% mgmt
Financing live
Cash to close
- Down payment
- $12,475
- Closing costs
- $1,497
- Reserves months
- —
- Total cash needed
- —
Loan-product check · same deal, 3 products live
Conventional
25% down · 7.5% · 30yr
- Down + closing
- —
- Monthly P&I
- —
- Monthly cashflow
- —
- DSCR
- —
- Eligible?
- —
Personal DTI + credit; lowest rate.
DSCR
20% down · 8.5% · 30yr
- Down + closing
- —
- Monthly P&I
- —
- Monthly cashflow
- —
- DSCR
- —
- Eligible?
- —
No personal income docs; deal must DSCR.
Hard money
10% down · 12.0% · 12mo
- Down + closing
- —
- Monthly P&I
- —
- Monthly cashflow
- —
- DSCR
- —
- Eligible?
- —
Short-term bridge; refi at stabilization.
Rent comps 4 comps
| Address | Beds | Baths | Sqft | Rent | $/sqft | DOM | Units | Dist |
|---|---|---|---|---|---|---|---|---|
| Cowing St Lancaster, NY | 3.0 | 1.0 | 1450 | $1,400 | $0.97 | 43d | 1 | 0.79mi |
| 3 Steinfeldt Rd Lancaster, NY | 3.0 | 1.5 | 1241 | $1,750 | $1.41 | 44d | 1 | 0.99mi |
| 5828 Broadway St Lancaster, NY | 1.0–3.0 | 1.0–2.0 | 1102 | $2,126 | $1.93 | 1d | 1 | 1.30mi |
| 5849 Broadway Unit 8 Lancaster, NY | 3.0 | 3.0 | 2300 | $2,495 | $1.08 | 1d | 1 | 1.43mi |
Listing history 9 events
-
2026-06-18days on market $49,900 Active 18 DOM
-
2026-06-17days on market $49,900 Active 17 DOM
-
2026-06-16days on market $49,900 Active 16 DOM
-
2026-06-15days on market $49,900 Active 15 DOM
-
2026-06-13days on market $49,900 Active 13 DOM
-
2026-06-13statusdays on market $49,900 Active 12 DOM
-
2026-05-31status $49,900 Pending 10 DOM
-
2026-05-31days on market $49,900 Active 10 DOM
-
2026-05-21$49,900 Active
ⓘ Source: listings_history table (triggers on properties + properties_extension) + one-shot
backfill from property_details.listing_events for pre-trigger history.
Climate risk First Street
- Flood 1/10 Low FEMA zone X (unshaded) · 0% chance over 30 yrs
- Wildfire 2/10 Low
- Heat 2/10 Low 7 d/yr ≥92°F today · 15 d/yr by 30 yrs out
- Wind 1/10 Low
- Air quality 3/10 Moderate 2 unhealthy d/yr today · 3 by 30 yrs out
Nearby sold comps map
Loading sold comps map…
Walkable amenities ~0.75 mi
Loading nearby amenities…
Taxation est. · year 1
- Rental income
- $22,763
- − Mortgage interest
- −$2,795
- − Property taxes
- −$748
- − Insurance
- −$250
- − Repairs & maintenance
- −$1,821
- − Management
- −$1,821
- − Depreciation
- −$1,452
- Taxable income
- $13,876
- Est. tax owed @ 24.0%
- −$3,330
- After-tax cash flow
- $10,514/yr
For passive investors: Depreciation is non-cash, so a rental often shows a tax loss while cash-flowing — sheltering income. Rental losses are passive: they offset passive income freely, and up to $25,000/yr can offset ordinary (W-2) income if you actively participate and your MAGI is under $100k (phasing out to $0 by $150k); unused losses carry forward. On sale, claimed depreciation is recaptured at up to 25%, and gains may owe capital-gains tax (a 1031 exchange can defer both). Figures are a year-1 estimate at your 24.0% rate — not tax advice; consult a CPA.
Schools (NCES district)
- District
- Lancaster Central School District
- NCES district ID
- 3616680
- Math proficiency
- 57% ▼ -13.00%
- Reading proficiency
- 61% ▲ 2.00%
- Median HH income
- $64,668
- Composite
- 51.64/100
- National rank
- #1700
- State rank
- #234 of 590 in NY
Livability — Lancaster
- Score
- 78/100
- State rank
- #164
- US rank
- #2566
Category grades
Schools grade is shown separately in the Schools card above.
Census & demographics
- Census place
- Lancaster, NY
- County
- Erie County · 714,559 people
- City population
- 35,635
- Metro
- Buffalo-Cheektowaga, NY
- Population (ZIP)
- 35,635
- Household income
- $99,499
- Rent vs Own
- Severe rent burden
- 513.0
Population outlook (Erie County) Hauer SSP2
- Today (2025)
- 933,037 people
- By 2030
- 935,181 · +0.2%
- By 2040
- 928,531 · -0.5%
- By 2050
- 905,725 · -2.9%
- By 2075
- 834,037 · -10.6%
- By 2100
- 708,033 · -24.1%
Race, ethnicity, and origin ACS 2023
- Neighborhood character
- Predominantly White (95%)
- Race & ethnicity
- White 95% Two or more races 2% Black 1% Hispanic / Latino 1%
- Common ancestry
- Romanian 28% Lithuanian 2% Slovak 2%
- Foreign-born
- 3% · Canada
- Languages at home
- 96% English-only · Russian/Polish/Slavic 1% Other Indo-European 1% Arabic 1%
Political lean MEDSL · Erie
- 2024 margin
- Lean D (+9.7) · D 54.8% · R 45.2%
- 2008→2024 swing
- -7.9pp toward R · 2008: 17.5pp · 2024: 9.7pp
- All cycles
- 2024: D+9.7 2020: D+14.7 2016: D+4.8 2012: D+15.6 2008: D+17.5
Not yet ingested
- Civics
- —
Market trends
- HPI YoY
- ▼ -133.14%
- Current HPI
- 302.7484
- Rent YoY
- —
- Metro
- Buffalo-Cheektowaga, NY
- State GDP YoY
- ▲ 2.60%
- F500 in state
- 92
Industry mix (Fortune 500 HQ in NY)
| Industry | F500 HQs | Revenue |
|---|---|---|
| Financial Services | 10 | $950B |
|
||
| Consumer Goods | 9 | $162B |
|
||
| Insurance | 4 | $225B |
|
||
| Telecommunications | 2 | $144B |
|
||
| Pharmaceuticals | 2 | $112B |
|
||
| Media / Entertainment | 2 | $69B |
|
||
Price history
1 event — show timeline
- 2026-05-21 Listed $49,900 WNYREIS
Property tax history
+4.6%/yrLatest (2025): $2,812 · +0.6% YoY. Source: county tax records.
Cash-flow waterfall
monthlySold comps — $/sqft
last 12 mo · ≤1 miLoading sold comps…