300 Robin Dr · Ocean City, MD
Flood risk 9/10 · Severe
- FEMA flood zone
- X (unshaded)
- Chance of flooding over 30 yrs
- 0.99%
- Est. flood insurance / yr
- $507 – $1,088
Fire risk 1/10 · Minimal
- Est. fire insurance / yr
- $755 – $1,403
Heat risk 9/10 · Severe
- Hot days now (above 101°F)
- 7 days/yr
- Hot days in 30 yrs
- 17 days/yr
Wind risk 8/10 · Major
- Chance of severe wind over 30 yrs
- 80.0%
Air-quality risk 2/10 · Minimal
- Unhealthy air days now
- 2 days/yr
- Unhealthy air days in 30 yrs
- 2 days/yr
Risk factors via First Street. Map © Google.
Why this score? — see what drove the D+ grade
The composite is a weighted blend of 9 inputs, each scored 0–100. Each bar is that input's sub-score; the figure is the points it added to the 100-point composite (weight × sub-score).
- Cash flow +14.1/30.0
- ARV discount +11.7/15.0
- DSCR +4.3/10.0
- 1% rule +3.9/10.0
- Livability +3.7/5.0
- Schools +3.3/10.0
- Rent growth +2.5/5.0
- Condition / age +2.2/5.0
- Appreciation +0.0/10.0
$230,000
🖨 Deal sheet 📄 Offer letter ✓ Due diligence
Listing remarks
For Sale Upgrades New A/C and Heat unit New Stove New Refrigerator $220,000 if prices trend downward $200,000 if downward trend is 3 months
Key facts
- New stove
- New refrigerator
- Built 1973
Tags
Neighborhood map
What this means for you Summary
Snapshot
- This is a ?-bed/1.0-bath townhouse listed at $230k. Condition is rated fair.
Deal economics
- At list price, monthly cash flow is $-34 ($-411/yr) — negative.
- To cash-flow at today's rent, offer at most $225k (2.2% below list).
- To meet the 1% rule (rent ≥ 1% of price), the offer needs to be $205k (10.7% below list).
- Recommended offer: $205k (10.7% below list) — sets the bar for 1% rule.
- Cap rate 6.5% vs local median 1.4% in Ocean City — top-decile yield for the area; either an underpriced asset or a hidden risk that comps aren't pricing in. Stress-test before assuming the spread holds.
Location & tenants
- Location reads 73/100 on livability (#125 in MD) — a middle-class / working-renter tenant base. Strengths: commute A+, health & safety A+, schools B+; Watch: cost of living C-, crime F.
- Worcester County Public Schools (town): math 30% / reading 44% proficiency, ranked #6 of 24 in MD (top 25%) — families likely to look elsewhere, expect single-tenant / working-renter base with shorter leases.
- Market conditions: 673 active listings in the ZIP; solid renter incomes; 354 units permitted in Worcester County in 2024 (6 in 5+ unit buildings).
- This rent runs 31% of the median local income ($80k/yr) — at the standard rent-burdened threshold; future hikes will face affordability resistance.
Forward outlook
- Local home prices are declining (-3.0%/yr); year-one equity from $2k of loan paydown is wiped out by about $7k of value loss. Plan a longer hold.
- Worcester County population projected to shrink 4% by 2050 — rents likely to lag national; underwrite the cash flow, not the appreciation.
Negotiation context
- Only 14 days on market — expect competitive offers; lowballing is unlikely to land.
- 2 sale attempts with the ask held roughly flat each time — persistent listings suggest the price (not the market) is what's stuck; bring a comps-based counter.
Risks & watch-outs
- Watch-outs: flood insurance adds $66/mo.
- Climate carrying-cost: severe flood risk; severe wind risk, 80% chance of damaging wind over 30y; extreme-heat days projected 7→17/yr by 2055 (HVAC capex compounding) — expect insurance premiums to compound above CPI over the hold.
Questions for the listing agent
- What do current leases actually rent for vs. the listed asking? Can we see a recent rent roll and the last 12 months of T-12 income?
- Have any recent inspections been done? Can we get a copy of the seller's disclosures and any deferred-maintenance estimates?
- Built in 1973 — when were the roof, HVAC, electrical panel, plumbing, and water heater last replaced?
- What's the actual annual flood-insurance premium (NFIP or private), and is the property in a SFHA with mandatory coverage?
- Is there a deadline driving the sale (1031 exchange, divorce, estate, relocation)? That informs how much negotiation room exists.
- Schools are B-rated — typically a magnet for longer-tenancy family renters. What's the average tenant stay here, and is there a school-zone premium baked into asking?
- Crime grade is F in this area — have there been break-ins, vandalism, or insurance claims at this property in the last 3 years? What carrier currently insures it and at what premium?
- The area grade is low — what's the realistic commute time and amenity access for the typical tenant pool here? Any planned neighborhood developments (good or bad) we should know about?
- What's the average days-on-market for RENTAL listings here right now (not sales)? A rising rental-DOM trend means longer vacancies and softer asking-rent achievability than the comps imply.
- What's the recent tenant-quality profile in this submarket — average credit score on applications, eviction rate, late-payment / NSF rate, and stable-employment percentage? A property-management company in the area should have these aggregated.
- How much new for-sale + rental construction is in the pipeline within 1–3 miles? Heavy new supply typically softens prices + rents 12–24 months out; constrained supply supports both.
Investment metrics
- 1% rule
- 0.89% ✗
- Cap rate
- 6.46%
- Cash-on-cash
- 0.60%
- DSCR
- 1.03
- GRM
- 9.3
CMA / ARV
- ARV (on-the-fly)
- $253,368
- Comps found
- 12
Show comp detail 12 sales within ~0.75 mi
| Address | Dist | Beds/Ba | Sqft | Sold | Price | $/sf | Match |
|---|---|---|---|---|---|---|---|
| 2707 Judlee Ave #202 | 0.03mi | 1/1.0 | 445 (-3%) | 6mo | $205,000 | $461 | 88 |
| 300 Robin Dr #212 | 0.00mi | —/1.0 | 496 (+8%) | 8mo | $183,500 | $370 | 80 |
| 6 34th St #153 | 0.43mi | —/1.0 | 464 (+1%) | 4mo | $275,000 | $593 | 75 |
| 2301 Philadelphia Ave #510 | 0.31mi | —/1.0 | 408 (-11%) | 2mo | $208,000 | $510 | 66 |
| 2301 Philadelphia Ave #405 | 0.31mi | —/1.0 | 408 (-11%) | 2mo | $165,000 | $404 | 65 |
| 508 Robin Dr #47 | 0.42mi | 1/1.0 | 500 (+9%) | 6mo | $245,000 | $490 | 61 |
| 2301 Philadelphia Ave #403 | 0.31mi | 1/1.0 | 408 (-11%) | 10mo | $200,000 | $490 | 59 |
| 504 Robin Dr #69 | 0.39mi | 1/1.0 | 396 (-14%) | 1mo | $235,000 | $593 | 58 |
| 504 Robin Dr #50 | 0.39mi | 1/1.0 | 396 (-14%) | 8mo | $264,900 | $669 | 53 |
| 3609 N Canal St #6 | 0.53mi | 1/1.0 | 408 (-11%) | 7mo | $279,000 | $684 | 51 |
| 512 Robin Dr #14 | 0.45mi | 1/1.0 | 396 (-14%) | 8mo | $226,900 | $573 | 49 |
| 8 36th St #207 | 0.52mi | 1/1.0 | 525 (+14%) | 4mo | $290,000 | $552 | 49 |
Match score weights: distance 35% · size 25% · config 20% · recency 20%. Top-matched comps best support the ARV.
Projected returns pro-forma
-3.0% appreciation · 3.0% rent growth · sell at horizon
- IRR
- -17.3%
- Equity multiple
- 0.39×
- Total profit
- $-39,379
- Equity at exit
- $34,294
- IRR
- -9.2%
- Equity multiple
- 0.43×
- Total profit
- $-36,807
- Equity at exit
- $19,886
Cash invested: $64,400 (down + closing). Projections, not guarantees.
Landlord ↔ Tenant lean methodology
- Overall (STATE)
- 27 Tenant-Leaning
- State Maryland
- 27 Tenant-Leaning · D+14
- County
- — inherits STATE
- City
- — inherits STATE
ZIP-level market 21842
- Home prices YoY
- -5.0%
- Active inventory
- 673
- Price-to-rent
- 9.3×
Monthly cashflow live
- Estimated rent
- $2,053 medium interval (Pro) →
- Mortgage (P&I)
- −$1,206
- Tax est. 1.5%
- −$288 /mo · $3,450/yr
- Insurance
- −$96
- Flood insurance flood zone
- −$66 /mo · $798/yr
- HOA
- −$0
- Vacancy / Maint / Mgmt
- −$431
- Net cashflow
- $-34
Break-even live
UW: 25.0% down · 7.5% · 30yr · 1.5% tax · 5.0% vac · 8.0% maint · 8.0% mgmt
Financing live
Cash to close
- Down payment
- $57,500
- Closing costs
- $6,900
- Reserves months
- —
- Total cash needed
- —
Loan-product check · same deal, 3 products live
Conventional
25% down · 7.5% · 30yr
- Down + closing
- —
- Monthly P&I
- —
- Monthly cashflow
- —
- DSCR
- —
- Eligible?
- —
Personal DTI + credit; lowest rate.
DSCR
20% down · 8.5% · 30yr
- Down + closing
- —
- Monthly P&I
- —
- Monthly cashflow
- —
- DSCR
- —
- Eligible?
- —
No personal income docs; deal must DSCR.
Hard money
10% down · 12.0% · 12mo
- Down + closing
- —
- Monthly P&I
- —
- Monthly cashflow
- —
- DSCR
- —
- Eligible?
- —
Short-term bridge; refi at stabilization.
Listing history 11 events
-
2026-06-18days on market $230,000 Active 14 DOM
-
2026-06-17days on market $230,000 Active 13 DOM
-
2026-06-16days on market $230,000 Active 12 DOM
-
2026-06-15days on market $230,000 Active 11 DOM
-
2026-06-14days on market $230,000 Active 9 DOM
-
2026-06-13days on market $230,000 Active 8 DOM
-
2026-06-10days on market $230,000 Active 6 DOM
-
2026-06-09days on market $230,000 Active 5 DOM
-
2026-06-08days on market $230,000 Active 4 DOM
-
2026-06-07remarks 141-char remark
-
2026-06-07$230,000 Active 3 DOM
ⓘ Source: listings_history table (triggers on properties + properties_extension) + one-shot
backfill from property_details.listing_events for pre-trigger history.
Climate risk First Street
- Flood 9/10 Extreme FEMA zone X (unshaded) · 99% chance over 30 yrs
- Wildfire 1/10 Low
- Heat 9/10 Extreme 7 d/yr ≥101°F today · 17 d/yr by 30 yrs out
- Wind 8/10 Severe 80% chance of damaging wind over 30 yrs
- Air quality 2/10 Low 2 unhealthy d/yr today · 2 by 30 yrs out
Nearby sold comps map
Loading sold comps map…
Walkable amenities ~0.75 mi
Loading nearby amenities…
Taxation est. · year 1
- Rental income
- $24,633
- − Mortgage interest
- −$12,884
- − Property taxes
- −$3,450
- − Insurance
- −$1,948
- − Repairs & maintenance
- −$1,971
- − Management
- −$1,971
- − Depreciation
- −$6,691
- Taxable loss
- −$4,280
- Est. tax savings @ 24.0%
- +$1,027
- After-tax cash flow
- $616/yr
For passive investors: Depreciation is non-cash, so a rental often shows a tax loss while cash-flowing — sheltering income. Rental losses are passive: they offset passive income freely, and up to $25,000/yr can offset ordinary (W-2) income if you actively participate and your MAGI is under $100k (phasing out to $0 by $150k); unused losses carry forward. On sale, claimed depreciation is recaptured at up to 25%, and gains may owe capital-gains tax (a 1031 exchange can defer both). Figures are a year-1 estimate at your 24.0% rate — not tax advice; consult a CPA.
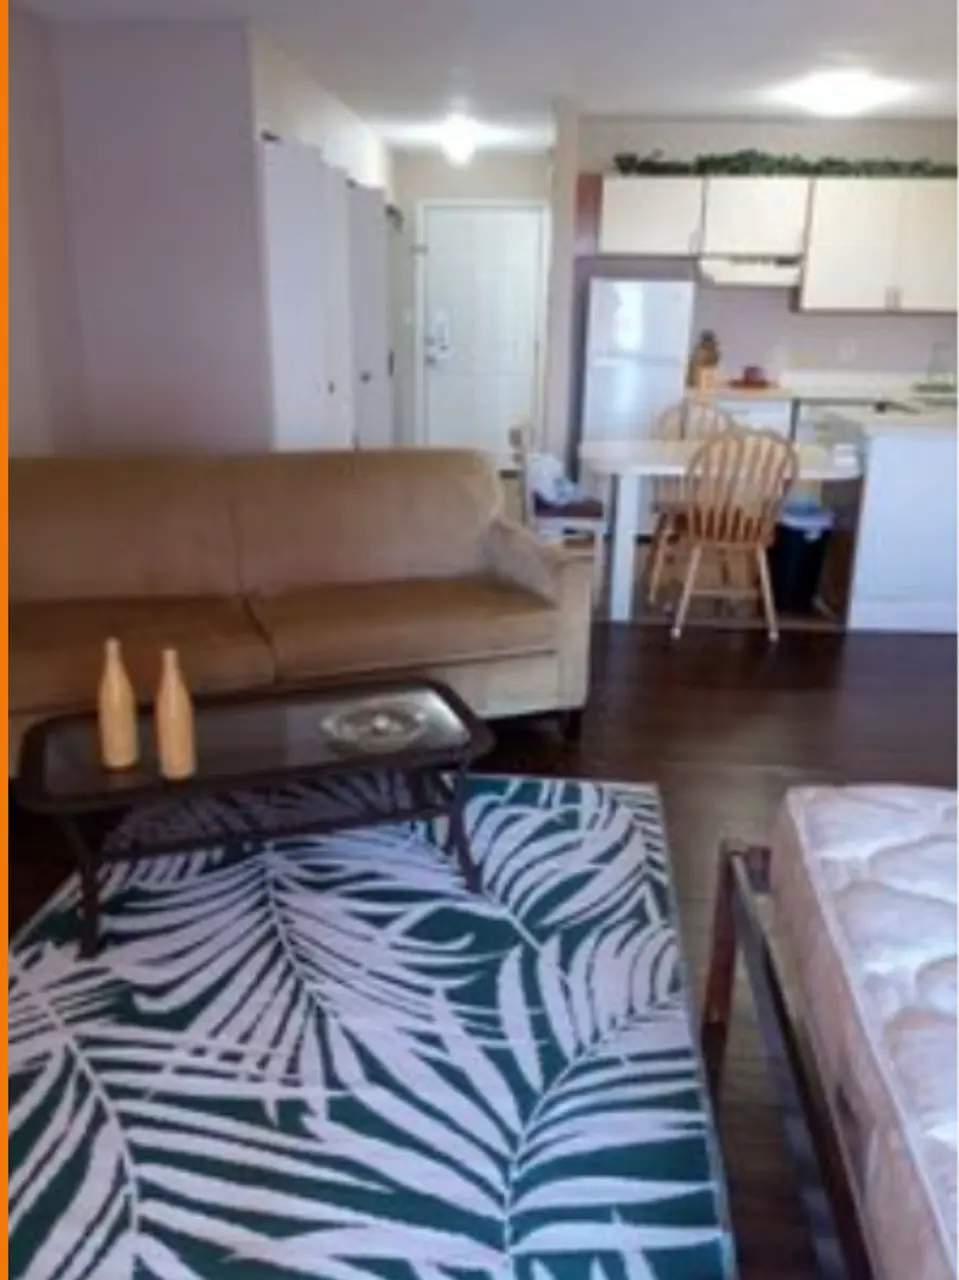
Condition & rehab AI · 3 photos
The property is in fair condition with minor repairs and maintenance needed. Upgrades to interior walls, kitchen, and exterior can significantly enhance its value.
Repairs flagged
- Minor kitchen cabinets — Standard kitchen cabinets may need minor touch-ups or cleaning.
- Minor bathroom fixtures — Standard bathroom fixtures may need minor cleaning or touch-ups.
- Minor exterior siding — Exterior siding may need minor touch-ups or cleaning.
- Minor interior walls — Interior walls may need touch-ups or repainting.
- Minor windows — Windows may need minor cleaning or touch-ups.
- Minor HVAC filters — New HVAC unit may need filters replaced.
- Minor landscaping — Landscaping may need minor trimming or maintenance.
Value-add opportunities
- Both Paint interior walls — Fresh paint can significantly improve the home's appearance and value.
- Both Replace kitchen cabinets — New cabinets can enhance the kitchen's functionality and aesthetic appeal.
- Both Upgrade bathroom fixtures — Modern fixtures can improve the bathroom's functionality and aesthetic appeal.
- Both Upgrade exterior siding — New siding can improve the home's curb appeal and energy efficiency.
- Both Landscaping improvements — Well-maintained landscaping can enhance the home's curb appeal and property value.
- Both HVAC system maintenance — Regular maintenance can ensure the HVAC system operates efficiently and reduces energy costs.
Renovation cost estimate screening
| Repair item | Severity | Est. cost |
|---|---|---|
| kitchen cabinets · Standard kitchen cabinets may need minor touch-ups or cleaning. | Minor | $500–3,000 |
| bathroom fixtures · Standard bathroom fixtures may need minor cleaning or touch-ups. | Minor | $500–3,000 |
| exterior siding · Exterior siding may need minor touch-ups or cleaning. | Minor | $500–3,000 |
| interior walls · Interior walls may need touch-ups or repainting. | Minor | $500–3,000 |
| windows · Windows may need minor cleaning or touch-ups. | Minor | $500–3,000 |
| HVAC filters · New HVAC unit may need filters replaced. | Minor | $500–3,000 |
| landscaping · Landscaping may need minor trimming or maintenance. | Minor | $500–3,000 |
| Total estimated repair cost · 7 items | $3,500–21,000 |
Value-add ROI direction
- Both Paint interior walls — Fresh paint can significantly improve the home's appearance and value. ↑
- Both Replace kitchen cabinets — New cabinets can enhance the kitchen's functionality and aesthetic appeal. ↑
- Both Upgrade bathroom fixtures — Modern fixtures can improve the bathroom's functionality and aesthetic appeal. ↑
- Both Upgrade exterior siding — New siding can improve the home's curb appeal and energy efficiency. ↑
- Both Landscaping improvements — Well-maintained landscaping can enhance the home's curb appeal and property value. ↑
- Both HVAC system maintenance — Regular maintenance can ensure the HVAC system operates efficiently and reduces energy costs. ↑
ⓘ Cost ranges are severity-bucket heuristics (US national rule-of-thumb). Get contractor quotes + a written scope before underwriting a rehab budget.
Schools (NCES district)
- District
- Worcester County Public Schools
- NCES district ID
- 2400720
- Math proficiency
- 30% ▼ -25.00%
- Reading proficiency
- 44% ▼ -20.00%
- Median HH income
- $56,748
- Composite
- 32.6/100
- National rank
- #5672
- State rank
- #6 of 24 in MD
Livability — Ocean City
- Score
- 73/100
- State rank
- #125
- US rank
- #5407
Category grades
Schools grade is shown separately in the Schools card above.
Census & demographics
- Census place
- Ocean City, MD
- County
- Worcester County · 35,603 people
- Metro
- Salisbury, MD-DE
- Population (ZIP)
- 11,226
- Household income
- $79,876
- Rent vs Own
- Severe rent burden
- 322.0
Population outlook (Worcester County) Hauer SSP2
- Today (2025)
- 51,363 people
- By 2030
- 51,191 · -0.3%
- By 2040
- 50,459 · -1.8%
- By 2050
- 49,451 · -3.7%
- By 2075
- 48,533 · -5.5%
- By 2100
- 44,223 · -13.9%
Race, ethnicity, and origin ACS 2023
- Neighborhood character
- Predominantly White (86%)
- Race & ethnicity
- White 86% Hispanic / Latino 8% Two or more races 5% Black 3%
- Hispanic origin (detail)
- Mexican 3%
- Common ancestry
- Romanian 6% Slovak 3% Lithuanian 2%
- Foreign-born
- 10% · Canada, China
- Languages at home
- 87% English-only · Spanish 7% Russian/Polish/Slavic 3% Other Indo-European 2%
Political lean MEDSL · Worcester
- 2024 margin
- Strong R (+22.0) · D 38.0% · R 60.0% · Other 2.0%
- 2008→2024 swing
- -6.5pp toward R · 2008: -15.5pp · 2024: -22.0pp
- All cycles
- 2024: R+22.0 2020: R+19.0 2016: R+27.9 2012: R+18.3 2008: R+15.5
Not yet ingested
- Civics
- —
Market trends
- HPI YoY
- ▼ -25.65%
- Current HPI
- 482.18
- Rent YoY
- —
- Metro
- Salisbury, MD-DE
- State GDP YoY
- ▲ 2.97%
- F500 in state
- 12
Industry mix (Fortune 500 HQ in MD)
| Industry | F500 HQs | Revenue |
|---|---|---|
| Aerospace / Defense | 1 | $71B |
|
||
| Utilities | 1 | $25B |
|
||
| Hotels | 1 | $24B |
|
||
| Consumer Goods | 1 | $7B |
|
||
| Real Estate | 1 | $6B |
|
||
| Chemicals | 1 | $2B |
|
||
Price history
+1816.7% since first listed3 events — show timeline
- 2026-06-04 Listed $230,000 ForSaleByOwner.com
- 2026-05-23 Price Changed $2,000 Avail
- 2026-03-26 Listed for Rent $12,000 Avail
Cash-flow waterfall
monthlySold comps — $/sqft
last 12 mo · ≤1 miLoading sold comps…