9830 Caneyville Rd · Caneyville, KY
Flood risk No data
- FEMA flood zone
- —
- Chance of flooding over 30 yrs
- —
- Est. flood insurance / yr
- —
Fire risk No data
- Est. fire insurance / yr
- —
Heat risk No data
- Hot days now (above threshold)
- —
- Hot days in 30 yrs
- —
Wind risk No data
- Chance of severe wind over 30 yrs
- —
Air-quality risk No data
- Unhealthy air days now
- —
- Unhealthy air days in 30 yrs
- —
Risk factors via First Street. Map © Google.
Why this score? — see what drove the B grade
The composite is a weighted blend of 9 inputs, each scored 0–100. Each bar is that input's sub-score; the figure is the points it added to the 100-point composite (weight × sub-score).
- Cash flow +29.2/30.0
- DSCR +10.0/10.0
- Appreciation +9.8/10.0
- ARV discount +7.5/15.0
- 1% rule +7.0/10.0
- Livability +3.4/5.0
- Rent growth +2.5/5.0
- Condition / age +2.5/5.0
- Schools +2.1/10.0
$99,000
🖨 Deal sheet 📄 Offer letter ✓ Due diligence
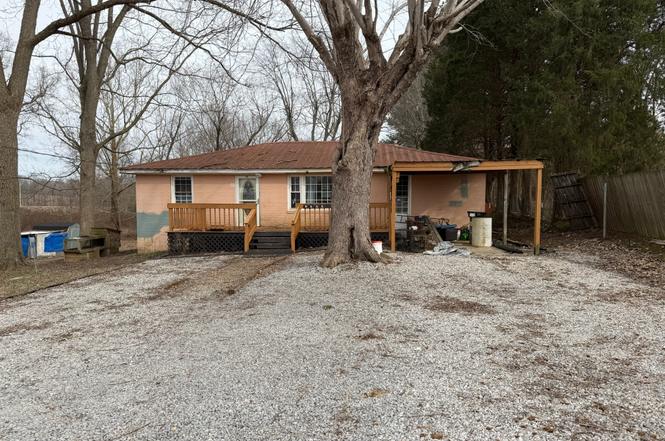
Listing remarks MLS
3 bedroom, 1 bath home sitting on 6.72+/- acres new heat & air. Has carport, storage building, storm shelter, replacement windows & creek.
Key facts
- Running stream
- 6.72 acres
- Central heat and air
Tags
Neighborhood map
What this means for you Summary
Snapshot
- This is a 3-bed/1.0-bath single-family listed at $99k.
Deal economics
- At list price, monthly cash flow is $345 ($4k/yr) — positive.
- The deal already cash-flows at list — no discount required.
- Meets the 1% rule at list price ($1k rent vs $99k).
- Recommended offer: $96k (3.0% below list) — sets the bar for market timing.
- Cap rate 10.5% vs local median 2.1% in Caneyville — top-decile yield for the area; either an underpriced asset or a hidden risk that comps aren't pricing in. Stress-test before assuming the spread holds.
Location & tenants
- Location reads 68/100 on livability (#182 in KY) — a middle-class / working-renter tenant base. Strengths: crime A+, cost of living A+, housing A+; Watch: amenities F, commute F, employment F.
- Butler County (rural): math 18% / reading 32% proficiency, ranked #147 of 165 in KY (top 89%) — low school quality limits family demand, transient renter base, plan for 1-2y turnover.
- Zoned schools: North Butler Elementary (math 17% / reading 32%, grade F, #489 of 676 statewide, top 76%, 396 students, 54% FRL); Butler County High School (math 22% / reading 27%, grade F, #179 of 254 statewide, top 78%, 633 students, 54% FRL) — zoned schools at 54% FRL track the district average.
- Market conditions: 35 active listings in the ZIP; 1 units permitted in Butler County in 2024 (0 in 5+ unit buildings).
Forward outlook
- In year one you build about $10k of equity ($684 loan paydown + $10k appreciation (9.6% local appreciation)).
- At projected returns (9.6% appreciation + 3.0% rent growth), your $28k cash investment doubles in ~2 years — after that, you're playing with house money.
- By year 4, paydown + projected appreciation supports a ~$36k cash-out refi (75% LTV) — recoverable capital for the next deal without selling this one.
Negotiation context
- It's been on market 43 days — a 3% lower offer ($96k) is reasonable based on typical stale-listing flexibility.
- 3 sale attempts since 7y ago with the ask held roughly flat each time — persistent listings suggest the price (not the market) is what's stuck; bring a comps-based counter.
Questions for the listing agent
- It's been on market 43 days. Have you received any prior offers? Is the seller open to a 3% concession, seller financing, or rate buy-down credit?
- Built in 1960 — when were the roof, HVAC, electrical panel, plumbing, and water heater last replaced?
- Is there a deadline driving the sale (1031 exchange, divorce, estate, relocation)? That informs how much negotiation room exists.
- Schools are D-rated, which usually means shorter tenancies and higher turnover. Who's the typical renter profile here, and what's been the actual vacancy rate?
- What's the average days-on-market for RENTAL listings here right now (not sales)? A rising rental-DOM trend means longer vacancies and softer asking-rent achievability than the comps imply.
- What's the recent tenant-quality profile in this submarket — average credit score on applications, eviction rate, late-payment / NSF rate, and stable-employment percentage? A property-management company in the area should have these aggregated.
- How much new for-sale + rental construction is in the pipeline within 1–3 miles? Heavy new supply typically softens prices + rents 12–24 months out; constrained supply supports both.
Investment metrics
- 1% rule
- 1.20% ✓
- Cap rate
- 10.48%
- Cash-on-cash
- 14.95%
- DSCR
- 1.67
- GRM
- 7.0
CMA / ARV
No comps found within radius.
Projected returns pro-forma
9.6% appreciation · 3.0% rent growth · sell at horizon
- IRR
- 34.6%
- Equity multiple
- 3.64×
- Total profit
- $73,167
- Equity at exit
- $86,309
- IRR
- 30.0%
- Equity multiple
- 8.12×
- Total profit
- $197,423
- Equity at exit
- $183,149
Cash invested: $27,720 (down + closing). Projections, not guarantees.
Landlord ↔ Tenant lean methodology
- Overall (STATE)
- 83 Strongly Landlord-Friendly
- State Kentucky
- 83 Strongly Landlord-Friendly · R+16
- County
- — inherits STATE
- City
- — inherits STATE
ZIP-level market 42261
- Home prices YoY
- 3.6%
- Active inventory
- 35
- Price-to-rent
- 7.0×
Monthly cashflow live
- Estimated rent
- $1,187 medium interval (Pro) →
- Mortgage (P&I)
- −$519
- Tax from tax record
- −$32 /mo · $381/yr
- Insurance
- −$41
- HOA
- −$0
- Vacancy / Maint / Mgmt
- −$249
- Net cashflow
- $345
Break-even live
UW: 25.0% down · 7.5% · 30yr · 1.5% tax · 5.0% vac · 8.0% maint · 8.0% mgmt
Financing live
Cash to close
- Down payment
- $24,750
- Closing costs
- $2,970
- Reserves months
- —
- Total cash needed
- —
Loan-product check · same deal, 3 products live
Conventional
25% down · 7.5% · 30yr
- Down + closing
- —
- Monthly P&I
- —
- Monthly cashflow
- —
- DSCR
- —
- Eligible?
- —
Personal DTI + credit; lowest rate.
DSCR
20% down · 8.5% · 30yr
- Down + closing
- —
- Monthly P&I
- —
- Monthly cashflow
- —
- DSCR
- —
- Eligible?
- —
No personal income docs; deal must DSCR.
Hard money
10% down · 12.0% · 12mo
- Down + closing
- —
- Monthly P&I
- —
- Monthly cashflow
- —
- DSCR
- —
- Eligible?
- —
Short-term bridge; refi at stabilization.
Listing history 11 events
-
2026-04-09status Pending
-
2026-03-31status Active
-
2026-03-31price $99,000
-
2026-03-23status Pending
-
2026-02-28price $89,000
-
2026-02-17$100,000 Active
-
2019-08-15soldstatus $90,000 150-char remark
Show marketing remark (150 chars)
3 bedroom, 1 bath home sitting on 6.72+/- acres new heat & air. Has carport, storage building, storm shelter, replacement windows & creek.
-
2019-08-15soldstatus $90,000
Show marketing remark (150 chars)
3 bedroom, 1 bath home sitting on 6.72+/- acres new heat & air. Has carport, storage building, storm shelter, replacement windows & creek.
-
2019-06-03$94,500 150-char remark
Show marketing remark (150 chars)
3 bedroom, 1 bath home sitting on 6.72+/- acres new heat & air. Has carport, storage building, storm shelter, replacement windows & creek.
-
2008-04-18soldstatus $49,600
-
2004-03-26soldstatus $23,000
ⓘ Source: listings_history table (triggers on properties + properties_extension) + one-shot
backfill from property_details.listing_events for pre-trigger history.
Tax reassessment forecast KY · Resets to sale price
- Current annual tax
- $381 · $32/mo
- Projected year-2 tax
- $851 · $71/mo
- Expected delta
- +$471/yr (+$39/mo · 123.6%)
ⓘ Screening estimate from a state-policy table — verify with the county assessor before closing.
Nearby sold comps map
Loading sold comps map…
Walkable amenities ~0.75 mi
Loading nearby amenities…
Taxation est. · year 1
- Rental income
- $14,240
- − Mortgage interest
- −$5,546
- − Property taxes
- −$381
- − Insurance
- −$495
- − Repairs & maintenance
- −$1,139
- − Management
- −$1,139
- − Depreciation
- −$2,880
- Taxable income
- $2,660
- Est. tax owed @ 24.0%
- −$638
- After-tax cash flow
- $3,505/yr
For passive investors: Depreciation is non-cash, so a rental often shows a tax loss while cash-flowing — sheltering income. Rental losses are passive: they offset passive income freely, and up to $25,000/yr can offset ordinary (W-2) income if you actively participate and your MAGI is under $100k (phasing out to $0 by $150k); unused losses carry forward. On sale, claimed depreciation is recaptured at up to 25%, and gains may owe capital-gains tax (a 1031 exchange can defer both). Figures are a year-1 estimate at your 24.0% rate — not tax advice; consult a CPA.
Schools (NCES district)
- District
- Butler County
- NCES district ID
- 2100810
- Math proficiency
- 18% ▼ -20.00%
- Reading proficiency
- 32% ▼ -15.00%
- Median HH income
- $35,849
- Composite
- 20.65/100
- National rank
- #8541
- State rank
- #147 of 165 in KY
Livability — Caneyville
- Score
- 68/100
- State rank
- #182
- US rank
- #9075
Category grades
Schools grade is shown separately in the Schools card above.
Census & demographics
- City population
- 4,302
- Population (ZIP)
- 9,725
Population outlook (Butler County) Hauer SSP2
- Today (2025)
- 13,118 people
- By 2030
- 13,111 · -0.1%
- By 2040
- 13,003 · -0.9%
- By 2050
- 12,979 · -1.1%
- By 2075
- 13,826 · +5.4%
- By 2100
- 15,986 · +21.9%
Race, ethnicity, and origin ACS 2023
- Neighborhood character
- Predominantly White (91%)
- Race & ethnicity
- White 91% Hispanic / Latino 6% Two or more races 6%
- Hispanic origin (detail)
- Common ancestry
- Polish 2% Italian 2% Lithuanian 1%
- Foreign-born
- 3% · Canada
- Languages at home
- 93% English-only · Spanish 4% German/W. Germanic 2%
Political lean MEDSL · Butler
- 2024 margin
- Solid R (+66.3) · D 16.2% · R 82.5% · Other 1.2%
- 2008→2024 swing
- -26.0pp toward R · 2008: -40.3pp · 2024: -66.3pp
- All cycles
- 2024: R+66.3 2020: R+63.4 2016: R+62.4 2012: R+47.9 2008: R+40.3
Not yet ingested
- Civics
- —
Market trends
- HPI YoY
- ▲ 9.60%
- Current HPI
- 272.49
- Rent YoY
- —
- Metro
- —
- State GDP YoY
- ▲ 1.81%
- F500 in state
- 4
Industry mix (Fortune 500 HQ in KY)
| Industry | F500 HQs | Revenue |
|---|---|---|
| Healthcare | 1 | $118B |
|
||
| Food / Beverage | 1 | $7B |
|
||
Price history
+330.4% since first listed11 events — show timeline
- 2026-04-09 Pending — REALTRACS as Distributed by MLS Grid
- 2026-03-31 Relisted — REALTRACS as Distributed by MLS Grid
- 2026-03-31 Price Changed $99,000 REALTRACS as Distributed by MLS Grid
- 2026-03-23 Pending — REALTRACS as Distributed by MLS Grid
- 2026-02-28 Price Changed $89,000 REALTRACS as Distributed by MLS Grid
- 2026-02-17 Listed $100,000 REALTRACS as Distributed by MLS Grid
- 2019-08-15 Sold (Public Records) $90,000 Public Records
- 2019-08-15 Sold (MLS) $90,000 RASKMLS
- 2019-06-03 Listed $94,500 RASKMLS
- 2008-04-18 Sold (Public Records) $49,600 Public Records
- 2004-03-26 Sold (Public Records) $23,000 Public Records
Property tax history
-0.8%/yrLatest (2025): $381 · -52.9% YoY. Source: county tax records.
Cash-flow waterfall
monthlySold comps — $/sqft
last 12 mo · ≤1 miLoading sold comps…