 Fourplex
1129 Lincoln Blvd · Santa Monica, CA
Flood risk 1/10 · Minimal
- FEMA flood zone
- X (unshaded)
- Chance of flooding over 30 yrs
- 0.0%
- Est. flood insurance / yr
- $507 – $1,088
Fire risk 1/10 · Minimal
- Est. fire insurance / yr
- $659 – $1,223
Heat risk 7/10 · Major
- Hot days now (above 80°F)
- 7 days/yr
- Hot days in 30 yrs
- 20 days/yr
Wind risk 1/10 · Minimal
- Chance of severe wind over 30 yrs
- —
Air-quality risk 4/10 · Minor
- Unhealthy air days now
- 5 days/yr
- Unhealthy air days in 30 yrs
- 6 days/yr
Risk factors via First Street. Map © Google.
Why this score? — see what drove the D grade
The composite is a weighted blend of 9 inputs, each scored 0–100. Each bar is that input's sub-score; the figure is the points it added to the 100-point composite (weight × sub-score).
- Cash flow +10.4/30.0
- ARV discount +6.3/15.0
- Schools +6.2/10.0
- Appreciation +4.9/10.0
- Livability +3.6/5.0
- DSCR +3.0/10.0
- Rent growth +2.5/5.0
- Condition / age +2.5/5.0
- 1% rule +1.8/10.0
$3,700,000
🖨 Deal sheet 📄 Offer letter ✓ Due diligence
Multi-family units
County records classify this as Multi-Family (5+ Unit). Listing-text estimate: 4 units. estimate disagrees with records
5+ unit building — per-unit beds/baths from public records are typically unavailable; the breakdown below (if shown) is an estimate from the listing text.
Listing remarks MLS
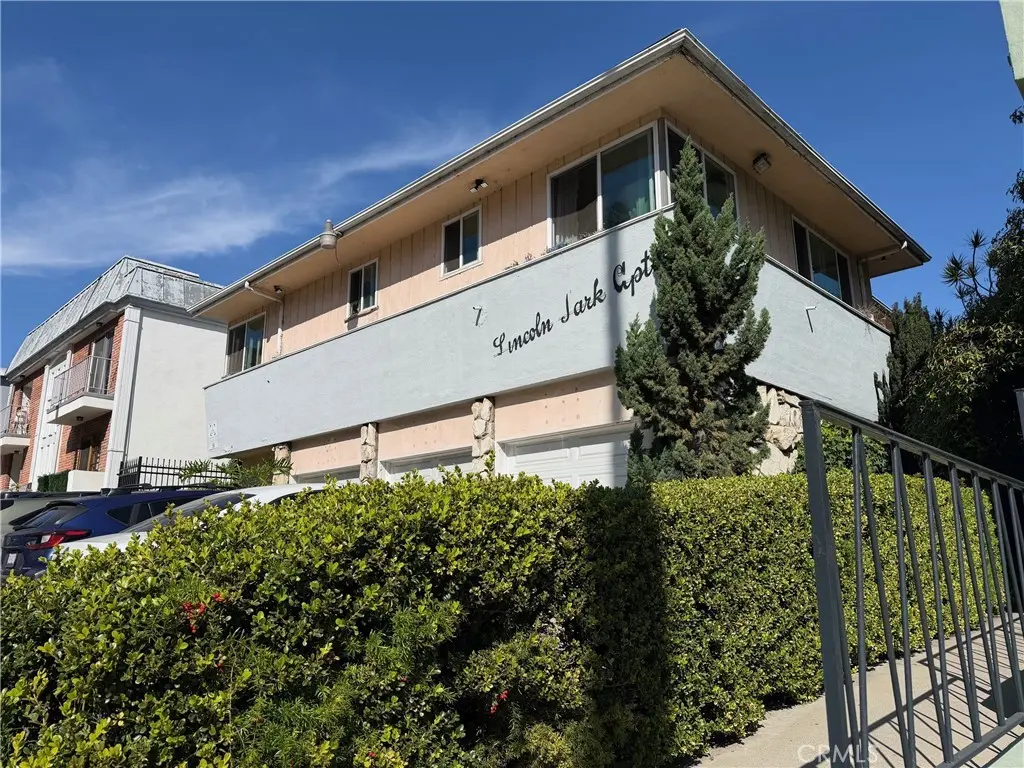
The subject property (Lincoln Park Apartments) is a Classic 1950's two story walkup apartment building with 10 units. There are 3 two bedroom units, 5 one bedroom units, and 2 Studio apartments. The property features a gated central courtyard for access to the common area and entry for all of the units. There is a laundry room on site and 7 parking garages, in addition to the front parking area for 3 more vehicles. The units are subject to City of Santa Monica Rent Control and all units are below market with upside in rental income as units turnover. The property is in one of the most desirable areas of Santa Monica, just north of Wilshire Boulevard across from beautiful Reed Park which encompasses a full city block and has picnic tables, benches, basketball courts, public and private tennis courts. This quiet apartment complex is a short walk or bike ride to, 3rd Street Promenade with it's many shops and restaurants, the park along Ocean Avenue, Santa Monica State Beach, and The Santa Monica Pier. Properties in this area rarely become available, and are in high demand.
Key facts
- Laundry room on site
- 7,494 sq ft lot
- 7 garage spots
Tags
Neighborhood map
What this means for you Summary
Snapshot
- This is a 4 × 3-bed/?-bath units multifamily listed at $3.70M.
Deal economics
- At list price, monthly cash flow is $-2k ($-23k/yr) — negative. Per door: $-487/mo.
- To cash-flow at today's rent, offer at most $3.36M (9.3% below list).
- To meet the 1% rule (rent ≥ 1% of price), the offer needs to be $2.53M (31.7% below list).
- Recommended offer: $2.53M (31.7% below list) — sets the bar for 1% rule.
- Cap rate 5.7% vs local median 1.2% in Santa Monica — top-decile yield for the area; either an underpriced asset or a hidden risk that comps aren't pricing in. Stress-test before assuming the spread holds.
Location & tenants
- Location reads 72/100 on livability (#178 in CA) — a middle-class / working-renter tenant base. Strengths: schools A+, amenities A+, commute A+; Watch: health & safety C-, crime F, cost of living F.
- Santa Monica-Malibu Unified (urban): math 61% / reading 74% proficiency, ranked #123 of 1,400 in CA (top 9%) — acceptable for families but not a draw, mixed tenant base, ~2y average lease.
- Market conditions: Rents soft (-0.1%/yr); 93 active listings in the ZIP; high-income renter base; 19,697 units permitted in Los Angeles County in 2024 (9,426 in 5+ unit buildings).
- At $25,253/mo this rent would consume 249% of the median local household income ($122k/yr) (locally 2265% of renters already pay >50% of income on rent) — very limited rent-growth headroom before tenants either downsize or default.
Forward outlook
- In year one you build about $22k of equity ($26k loan paydown + $-4k appreciation (-0.1% local appreciation)).
- Los Angeles County population projected at +9% by 2050 — modest demand growth; plan on rents tracking national, not racing it.
- By year 8, paydown + projected appreciation supports a ~$248k cash-out refi (75% LTV) — recoverable capital for the next deal without selling this one.
Negotiation context
- It's been on market 101 days — a 9% lower offer ($3.37M) is reasonable based on typical stale-listing flexibility.
- 4 sale attempts since 3y ago with the ask held roughly flat each time — persistent listings suggest the price (not the market) is what's stuck; bring a comps-based counter.
Risks & watch-outs
- Watch-outs: built in 1956 — expect roof / HVAC / electrical / plumbing capex.
- Climate carrying-cost: extreme-heat days projected 7→20/yr by 2055 (HVAC capex compounding) — expect insurance premiums to compound above CPI over the hold.
Questions for the listing agent
- What do current leases actually rent for vs. the listed asking? Can we see a recent rent roll and the last 12 months of T-12 income?
- It's been on market 101 days. Have you received any prior offers? Is the seller open to a 32% concession, seller financing, or rate buy-down credit?
- Can we see the unit-by-unit rent roll, current vacancy, and any below-market leases? What's the average tenancy length?
- What capital expenditures (roof, boiler, parking lot, exteriors) have been made in the last 5 years, and what's planned in the next 2?
- Built in 1956 — when were the roof, HVAC, electrical panel, plumbing, and water heater last replaced?
- Why hasn't it sold? Are there any deal-killer items the seller is aware of (foundation, flood, title, zoning, code violations)?
- Is there a deadline driving the sale (1031 exchange, divorce, estate, relocation)? That informs how much negotiation room exists.
- Schools are A-rated — typically a magnet for longer-tenancy family renters. What's the average tenant stay here, and is there a school-zone premium baked into asking?
- Crime grade is F in this area — have there been break-ins, vandalism, or insurance claims at this property in the last 3 years? What carrier currently insures it and at what premium?
- The area grade is low — what's the realistic commute time and amenity access for the typical tenant pool here? Any planned neighborhood developments (good or bad) we should know about?
- What's the average days-on-market for RENTAL listings here right now (not sales)? A rising rental-DOM trend means longer vacancies and softer asking-rent achievability than the comps imply.
- What's the recent tenant-quality profile in this submarket — average credit score on applications, eviction rate, late-payment / NSF rate, and stable-employment percentage? A property-management company in the area should have these aggregated.
- How much new apartment / multifamily construction is in the pipeline within 1–3 miles? Heavy new supply (>2% of stock underway) typically softens rents 12–24 months out; light construction supports rent growth.
Investment metrics
- 1% rule
- 0.68% ✗
- Cap rate
- 5.66%
- Cash-on-cash
- -2.25%
- DSCR
- 0.90
- GRM
- 12.2
CMA / ARV
- ARV (median comp)
- $3,602,703
- List price
- $3,700,000
- Delta
- 2.70%
- Verdict
- FAIR
- Comps
- 20 within 1.0 mi
Show comp detail 4 sales within ~0.75 mi
| Address | Dist | Beds/Ba | Sqft | Sold | Price | $/sf | Match |
|---|---|---|---|---|---|---|---|
| 725 9th St | 0.50mi | 12/11.0 | 7,250 (-2%) | 20mo | $4,000,000 | $552 | 55 |
| 1019 6th St | 0.22mi | 13/13.0 (+1) | 7,764 (+5%) | 19mo | $4,314,420 | $556 | 50 |
| 833 15th St | 0.65mi | 11/11.0 (-1) | 6,574 (-11%) | 6mo | $3,145,000 | $478 | 39 |
| 1127 16th St | 0.60mi | 12/12.0 | 6,768 (-8%) | 20mo | $2,607,000 | $385 | 35 |
Match score weights: distance 35% · size 25% · config 20% · recency 20%. Top-matched comps best support the ARV.
Projected returns pro-forma
-0.1% appreciation · 0.0% rent growth · sell at horizon
- IRR
- -6.9%
- Equity multiple
- 0.69×
- Total profit
- $-325,563
- Equity at exit
- $1,055,793
- IRR
- -2.6%
- Equity multiple
- 0.74×
- Total profit
- $-270,998
- Equity at exit
- $1,254,385
Cash invested: $1,036,000 (down + closing). Projections, not guarantees.
Landlord ↔ Tenant lean methodology
- Overall (STATE)
- 18 Strongly Tenant-Friendly
- State California
- 18 Strongly Tenant-Friendly · D+13
- County
- — inherits STATE
- City
- — inherits STATE
ZIP-level market 90403
- Home prices YoY
- -0.0%
- Rents YoY
- -0.1%
- Active inventory
- 93
- Price-to-rent
- 48.8×
Monthly cashflow live
- Estimated rent
- $25,253 high interval (Pro) →
- Mortgage (P&I)
- −$19,403
- Tax from tax record
- −$952 /mo · $11,420/yr
- Insurance
- −$1,542
- HOA
- −$0
- Vacancy / Maint / Mgmt
- −$5,303
- Net cashflow
- $-1,947
Break-even live
4-unit breakdown (identical units grouped — click to expand)
| Units | Beds | Baths | Est. rent |
|---|---|---|---|
| 4× units | 3 | — | $25,252 |
| #1 | 3 | — | $6,313 |
| #2 | 3 | — | $6,313 |
| #3 | 3 | — | $6,313 |
| #4 | 3 | — | $6,313 |
| Total (4 units) | $25,253 | ||
UW: 25.0% down · 7.5% · 30yr · 1.5% tax · 5.0% vac · 8.0% maint · 8.0% mgmt
Financing live
Cash to close
- Down payment
- $925,000
- Closing costs
- $111,000
- Reserves months
- —
- Total cash needed
- —
Loan-product check · same deal, 3 products live
Conventional
25% down · 7.5% · 30yr
- Down + closing
- —
- Monthly P&I
- —
- Monthly cashflow
- —
- DSCR
- —
- Eligible?
- —
Personal DTI + credit; lowest rate.
DSCR
20% down · 8.5% · 30yr
- Down + closing
- —
- Monthly P&I
- —
- Monthly cashflow
- —
- DSCR
- —
- Eligible?
- —
No personal income docs; deal must DSCR.
Hard money
10% down · 12.0% · 12mo
- Down + closing
- —
- Monthly P&I
- —
- Monthly cashflow
- —
- DSCR
- —
- Eligible?
- —
Short-term bridge; refi at stabilization.
Listing history 23 events
-
2026-06-18days on market $3,700,000 Active 101 DOM
-
2026-06-17days on market $3,700,000 Active 100 DOM
-
2026-06-16days on market $3,700,000 Active 99 DOM
-
2026-06-15days on market $3,700,000 Active 98 DOM
-
2026-06-13days on market $3,700,000 Active 96 DOM
-
2026-06-13days on market $3,700,000 Active 95 DOM
-
2026-06-09days on market $3,700,000 Active 92 DOM
-
2026-06-08days on market $3,700,000 Active 91 DOM
-
2026-06-07days on market $3,700,000 Active 90 DOM
-
2026-06-04days on market $3,700,000 Active 87 DOM
-
2026-06-03days on market $3,700,000 Active 86 DOM
-
2026-06-02days on market $3,700,000 Active 85 DOM
-
2026-06-01days on market $3,700,000 Active 84 DOM
-
2026-05-31days on market $3,700,000 Active 83 DOM
-
2026-05-19price $3,700,000 1086-char remark
Show marketing remark (1086 chars)
The subject property (Lincoln Park Apartments) is a Classic 1950's two story walkup apartment building with 10 units. There are 3 two bedroom units, 5 one bedroom units, and 2 Studio apartments. The property features a gated central courtyard for access to the common area and entry for all of the units. There is a laundry room on site and 7 parking garages, in addition to the front parking area for 3 more vehicles. The units are subject to City of Santa Monica Rent Control and all units are below market with upside in rental income as units turnover. The property is in one of the most desirable areas of Santa Monica, just north of Wilshire Boulevard across from beautiful Reed Park which encompasses a full city block and has picnic tables, benches, basketball courts, public and private tennis courts. This quiet apartment complex is a short walk or bike ride to, 3rd Street Promenade with it's many shops and restaurants, the park along Ocean Avenue, Santa Monica State Beach, and The Santa Monica Pier. Properties in this area rarely become available, and are in high demand.
-
2026-03-09$3,800,000 Active 1086-char remark
Show marketing remark (1086 chars)
The subject property (Lincoln Park Apartments) is a Classic 1950's two story walkup apartment building with 10 units. There are 3 two bedroom units, 5 one bedroom units, and 2 Studio apartments. The property features a gated central courtyard for access to the common area and entry for all of the units. There is a laundry room on site and 7 parking garages, in addition to the front parking area for 3 more vehicles. The units are subject to City of Santa Monica Rent Control and all units are below market with upside in rental income as units turnover. The property is in one of the most desirable areas of Santa Monica, just north of Wilshire Boulevard across from beautiful Reed Park which encompasses a full city block and has picnic tables, benches, basketball courts, public and private tennis courts. This quiet apartment complex is a short walk or bike ride to, 3rd Street Promenade with it's many shops and restaurants, the park along Ocean Avenue, Santa Monica State Beach, and The Santa Monica Pier. Properties in this area rarely become available, and are in high demand.
-
2024-08-18historical $1,995
-
2024-08-18historical $1,995
-
2024-08-14$1,995
-
2024-08-14$2,995
-
2023-08-05historical $2,995
-
2023-07-29$2,995
-
2023-07-13historical
ⓘ Source: listings_history table (triggers on properties + properties_extension) + one-shot
backfill from property_details.listing_events for pre-trigger history.
Tax reassessment forecast CA · Resets to sale price
- Current annual tax
- $11,420 · $952/mo
- Projected year-2 tax
- $28,120 · $2,343/mo
- Expected delta
- +$16,700/yr (+$1,392/mo · 146.2%)
ⓘ Screening estimate from a state-policy table — verify with the county assessor before closing.
Climate risk First Street
- Flood 1/10 Low FEMA zone X (unshaded) · 0% chance over 30 yrs
- Wildfire 1/10 Low
- Heat 7/10 Severe 7 d/yr ≥80°F today · 20 d/yr by 30 yrs out
- Wind 1/10 Low
- Air quality 4/10 Moderate 5 unhealthy d/yr today · 6 by 30 yrs out
Nearby sold comps map
Loading sold comps map…
Walkable amenities ~0.75 mi
Loading nearby amenities…
Taxation est. · year 1
- Rental income
- $303,036
- − Mortgage interest
- −$207,258
- − Property taxes
- −$11,420
- − Insurance
- −$18,500
- − Repairs & maintenance
- −$24,243
- − Management
- −$24,243
- − Depreciation
- −$107,636
- Taxable loss
- −$90,264
- Est. tax savings @ 24.0%
- +$21,663
- After-tax cash flow
- $-1,697/yr
For passive investors: Depreciation is non-cash, so a rental often shows a tax loss while cash-flowing — sheltering income. Rental losses are passive: they offset passive income freely, and up to $25,000/yr can offset ordinary (W-2) income if you actively participate and your MAGI is under $100k (phasing out to $0 by $150k); unused losses carry forward. On sale, claimed depreciation is recaptured at up to 25%, and gains may owe capital-gains tax (a 1031 exchange can defer both). Figures are a year-1 estimate at your 24.0% rate — not tax advice; consult a CPA.
Schools (NCES district)
- District
- Santa Monica-Malibu Unified
- NCES district ID
- 0635700
- Math proficiency
- 61% ▬ 0.00%
- Reading proficiency
- 74% ▬ 0.00%
- Median HH income
- $81,489
- Composite
- 61.58/100
- National rank
- #1535
- State rank
- #123 of 1400 in CA
Livability — Santa Monica
- Score
- 72/100
- State rank
- #178
- US rank
- #5878
Category grades
Schools grade is shown separately in the Schools card above.
Census & demographics
- Census place
- Santa Monica, CA
- County
- Los Angeles County · 9,444,647 people
- City population
- 93,581
- Metro
- Los Angeles-Long Beach-Anaheim, CA
- Population (ZIP)
- 23,867
- Household income
- $121,925
- Rent vs Own
- Severe rent burden
- 2265.0
Population outlook (Los Angeles County) Hauer SSP2
- Today (2025)
- 10,940,515 people
- By 2030
- 11,256,481 · +2.9%
- By 2040
- 11,729,929 · +7.2%
- By 2050
- 11,948,407 · +9.2%
- By 2075
- 11,818,114 · +8.0%
- By 2100
- 10,842,928 · -0.9%
Race, ethnicity, and origin ACS 2023
- Neighborhood character
- Predominantly White (67%)
- Race & ethnicity
- White 67% Hispanic / Latino 12% Two or more races 12% Asian 11% Black 2%
- Hispanic origin (detail)
- Mexican 9%
- Common ancestry
- Italian 7% Romanian 5% Scotch-Irish 4%
- Foreign-born
- 24% · Canada, China, Dominican Republic
- Languages at home
- 75% English-only · Spanish 8% Other Indo-European 6% Russian/Polish/Slavic 4%
Political lean MEDSL · Los Angeles
- 2024 margin
- Solid D (+32.9) · D 64.8% · R 31.9% · Other 3.3%
- 2008→2024 swing
- -7.4pp toward R · 2008: 40.4pp · 2024: 32.9pp
- All cycles
- 2024: D+32.9 2020: D+44.2 2016: D+48.0 2012: D+40.0 2008: D+40.4
Not yet ingested
- Civics
- —
Market trends
- HPI YoY
- ▼ -0.10%
- Current HPI
- 310.2427
- Rent YoY
- ▼ -0.07%
- Metro
- Los Angeles-Long Beach-Anaheim, CA
- State GDP YoY
- ▲ 3.21%
- F500 in state
- 116
Industry mix (Fortune 500 HQ in CA)
| Industry | F500 HQs | Revenue |
|---|---|---|
| Technology | 27 | $1,492B |
|
||
| Financial Services | 3 | $174B |
|
||
| Retail | 3 | $44B |
|
||
| Insurance | 3 | $26B |
|
||
| Media / Entertainment | 2 | $115B |
|
||
| Pharmaceuticals / Biotech | 2 | $62B |
|
||
Price history
+123439.2% since first listed9 events — show timeline
- 2026-05-19 Price Changed $3,700,000 CRMLS
- 2026-03-09 Listed $3,800,000 CRMLS
- 2024-08-18 Rental Removed $1,995 APPFOLIO
- 2024-08-18 Rental Removed $1,995 APPFOLIO
- 2024-08-14 Listed for Rent $1,995 APPFOLIO
- 2024-08-14 Listed for Rent $2,995 APPFOLIO
- 2023-08-05 Rental Removed $2,995 APPFOLIO
- 2023-07-29 Listed for Rent $2,995 APPFOLIO
- 2023-07-13 Rental Removed — APPFOLIO
Property tax history
+2.3%/yrLatest (2025): $11,420 · +6.5% YoY. Source: county tax records.
Cash-flow waterfall
monthlySold comps — $/sqft
last 12 mo · ≤1 miLoading sold comps…