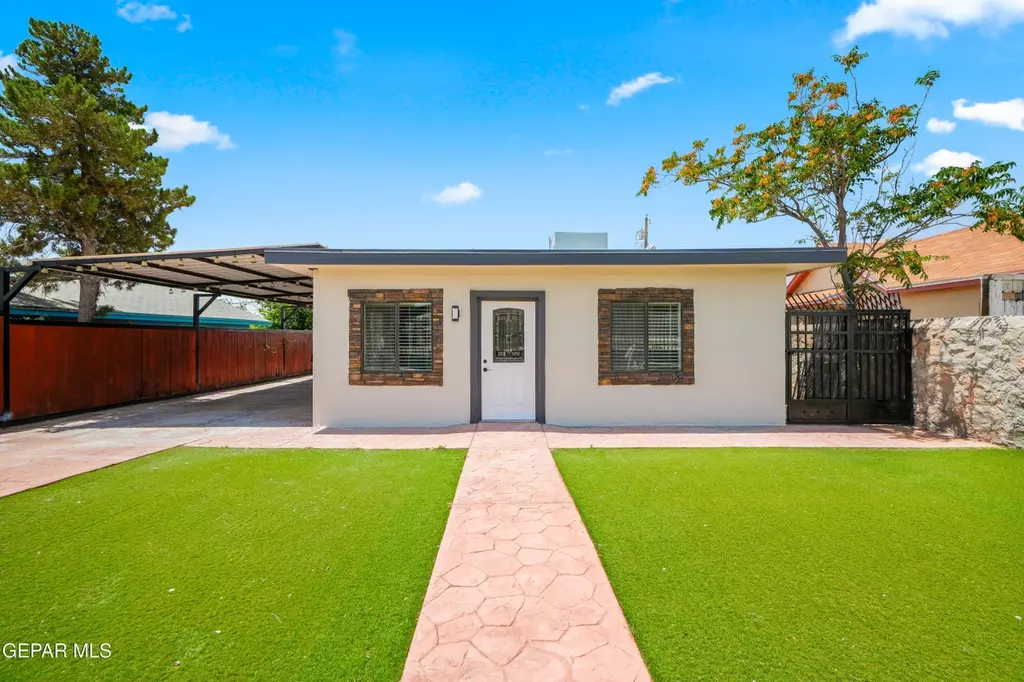
6206 Cleveland Ave · El Paso, TX
Flood risk 1/10 · Minimal
- FEMA flood zone
- X
- Chance of flooding over 30 yrs
- 0.0%
- Est. flood insurance / yr
- $507 – $1,088
Fire risk 1/10 · Minimal
- Est. fire insurance / yr
- $1,222 – $2,270
Heat risk 6/10 · Moderate
- Hot days now (above 102°F)
- 7 days/yr
- Hot days in 30 yrs
- 25 days/yr
Wind risk 1/10 · Minimal
- Chance of severe wind over 30 yrs
- —
Air-quality risk 2/10 · Minimal
- Unhealthy air days now
- 1 days/yr
- Unhealthy air days in 30 yrs
- 2 days/yr
Risk factors via First Street. Map © Google.
Why this score? — see what drove the D- grade
The composite is a weighted blend of 9 inputs, each scored 0–100. Each bar is that input's sub-score; the figure is the points it added to the 100-point composite (weight × sub-score).
- Appreciation +10.0/10.0
- ARV discount +7.5/15.0
- Cash flow +7.2/30.0
- Livability +4.0/5.0
- Schools +2.7/10.0
- Rent growth +2.5/5.0
- Condition / age +2.5/5.0
- 1% rule +2.1/10.0
- DSCR +1.3/10.0
$195,000
🖨 Deal sheet 📄 Offer letter ✓ Due diligence
Listing remarks
This centrally located home features 2 bedroom and 1 full bath and an additional spacious room that can be used as a master bedroom, flex room or family room . . Move in ready , the home has been recently updated and offers comfortable living in prime location. This home is a great investment with endless possibilities
Key facts
- 6,000 sq ft lot
- Garage
- Built 1960
Property features AI
Finance
- Other: Lot about 0.14 acres
- HOA & community: No HOA fees
Exterior
- Home design: Single family residence
- Construction: Construction details: see remarks; Roof: see remarks; Built area approximately 1360
- Exterior features: See remarks; Fenced yard
Interior
- Kitchen: Refrigerator
- Flooring: Tile
- Bathrooms: 1 full bathroom
- Heating & cooling: Forced air heating; Refrigerated cooling
- Interior features: See remarks; Blinds
Neighborhood map
What this means for you Summary
Snapshot
- This is a 3-bed/1.0-bath single-family listed at $195k.
Deal economics
- At list price, monthly cash flow is $-273 ($-3k/yr) — negative.
- To cash-flow at today's rent, offer at most $147k (24.7% below list).
- To meet the 1% rule (rent ≥ 1% of price), the offer needs to be $139k (28.9% below list).
- Recommended offer: $139k (28.9% below list) — sets the bar for 1% rule.
Location & tenants
- Location reads 81/100 on livability (#23 in TX, #1,375 nationally) — a professional / high-income tenant draw. Strengths: commute A+, cost of living A+, housing A+; Watch: employment D+.
- El Paso ISD (urban): math 27% / reading 37% proficiency, ranked #591 of 826 in TX (top 72%) — families likely to look elsewhere, expect single-tenant / working-renter base with shorter leases; 65% free/reduced lunch — lower-income household profile, screen leases tightly.
- Zoned schools: Hawkins El (math 54% / reading 64%, grade B-, #409 of 4,322 statewide, top 10%, 262 students, 97% FRL); Ross Middle (math 28% / reading 32%, grade F, #1,056 of 1,662 statewide, top 65%, 658 students, 79% FRL); Burges H S (math 36% / reading 37%, grade F, #924 of 1,632 statewide, top 57%, 1,478 students, 80% FRL) — zoned schools average 85% FRL vs 65% district-wide (20 pts higher); higher-poverty schools than district average — tighter screening recommended.
- Market conditions: 60 active listings in the ZIP; 9 comparable units currently listed for rent nearby; rentals at typical pace (median 24d on market — plan ~3-4 weeks tenant-placement turnaround); 44% of comp listings sitting > 30 days — soft ceiling on asking rent; 2,196 units permitted in El Paso County in 2024 (143 in 5+ unit buildings).
Forward outlook
- In year one you build about $21k of equity ($1k loan paydown + $20k appreciation (10.0% local appreciation)).
- El Paso County population projected at +10% by 2050 — modest demand growth; plan on rents tracking national, not racing it.
- By year 2, paydown + projected appreciation supports a ~$34k cash-out refi (75% LTV) — recoverable capital for the next deal without selling this one.
Negotiation context
- Only 13 days on market — expect competitive offers; lowballing is unlikely to land.
Risks & watch-outs
- Climate carrying-cost: extreme-heat days projected 7→25/yr by 2055 (HVAC capex compounding) — expect insurance premiums to compound above CPI over the hold.
Questions for the listing agent
- What do current leases actually rent for vs. the listed asking? Can we see a recent rent roll and the last 12 months of T-12 income?
- Built in 1960 — when were the roof, HVAC, electrical panel, plumbing, and water heater last replaced?
- Is there a deadline driving the sale (1031 exchange, divorce, estate, relocation)? That informs how much negotiation room exists.
- Schools are B-rated — typically a magnet for longer-tenancy family renters. What's the average tenant stay here, and is there a school-zone premium baked into asking?
- The area grade is low — what's the realistic commute time and amenity access for the typical tenant pool here? Any planned neighborhood developments (good or bad) we should know about?
- What's the average days-on-market for RENTAL listings here right now (not sales)? A rising rental-DOM trend means longer vacancies and softer asking-rent achievability than the comps imply.
- What's the recent tenant-quality profile in this submarket — average credit score on applications, eviction rate, late-payment / NSF rate, and stable-employment percentage? A property-management company in the area should have these aggregated.
- How much new for-sale + rental construction is in the pipeline within 1–3 miles? Heavy new supply typically softens prices + rents 12–24 months out; constrained supply supports both.
Investment metrics
- 1% rule
- 0.71% ✗
- Cap rate
- 4.61%
- Cash-on-cash
- -6.00%
- DSCR
- 0.73
- GRM
- 11.7
CMA / ARV
No comps found within radius.
Projected returns pro-forma
10.0% appreciation · 3.0% rent growth · sell at horizon
- IRR
- 20.0%
- Equity multiple
- 2.63×
- Total profit
- $88,862
- Equity at exit
- $175,671
- IRR
- 18.3%
- Equity multiple
- 6.04×
- Total profit
- $275,414
- Equity at exit
- $378,842
Cash invested: $54,600 (down + closing). Projections, not guarantees.
Landlord ↔ Tenant lean methodology
- Overall (STATE)
- 87 Strongly Landlord-Friendly
- State Texas
- 87 Strongly Landlord-Friendly · R+5
- County
- — inherits STATE
- City
- — inherits STATE
ZIP-level market 79905
- Home prices YoY
- 12.8%
- Active inventory
- 60
- Price-to-rent
- 11.7×
Monthly cashflow live
- Estimated rent
- $1,387 high interval (Pro) →
- Mortgage (P&I)
- −$1,023
- Tax from tax record
- −$265 /mo · $3,180/yr
- Insurance
- −$81
- HOA
- −$0
- Vacancy / Maint / Mgmt
- −$291
- Net cashflow
- $-273
Break-even live
UW: 25.0% down · 7.5% · 30yr · 1.5% tax · 5.0% vac · 8.0% maint · 8.0% mgmt
Financing live
Cash to close
- Down payment
- $48,750
- Closing costs
- $5,850
- Reserves months
- —
- Total cash needed
- —
Loan-product check · same deal, 3 products live
Conventional
25% down · 7.5% · 30yr
- Down + closing
- —
- Monthly P&I
- —
- Monthly cashflow
- —
- DSCR
- —
- Eligible?
- —
Personal DTI + credit; lowest rate.
DSCR
20% down · 8.5% · 30yr
- Down + closing
- —
- Monthly P&I
- —
- Monthly cashflow
- —
- DSCR
- —
- Eligible?
- —
No personal income docs; deal must DSCR.
Hard money
10% down · 12.0% · 12mo
- Down + closing
- —
- Monthly P&I
- —
- Monthly cashflow
- —
- DSCR
- —
- Eligible?
- —
Short-term bridge; refi at stabilization.
Rent comps 9 comps
| Address | Beds | Baths | Sqft | Rent | $/sqft | DOM | Units | Dist |
|---|---|---|---|---|---|---|---|---|
| 6203 Trowbridge Dr El Paso, TX | 3.0 | 1.0 | 1003 | $1,400 | $1.40 | 23d | 1 | 0.10mi |
| 6005 Tampa Ave El Paso, TX | 3.0 | 2.0 | 906 | $1,450 | $1.60 | 43d | 1 | 0.38mi |
| 1015 N Clark Dr El Paso, TX | 2.0 | 1.0 | 1031 | $1,200 | $1.16 | 3d | 1 | 0.39mi |
| 209 N Seville Dr Unit A El Paso, TX | 3.0 | 2.5 | 1250 | $1,600 | $1.28 | 2d | 1 | 0.54mi |
| 187 N Awbrey St Unit 1 El Paso, TX | 2.0 | 1.0 | 891 | $850 | $0.95 | 19d | 1 | 0.59mi |
| 5530 Venezuela Rd El Paso, TX | 3.0 | 3.0 | 1568 | $1,350 | $0.86 | 43d | 1 | 0.96mi |
| 6530 Mohawk Ave El Paso, TX | 3.0 | 2.0 | 1113 | $1,650 | $1.48 | 43d | 1 | 0.98mi |
| 339 Medina St Unit A El Paso, TX | 4.0 | 2.0 | 1300 | $1,465 | $1.13 | 43d | 1 | 1.11mi |
| 726 Medina St El Paso, TX | 3.0 | 2.0 | 1310 | $1,600 | $1.22 | 3d | 1 | 1.44mi |
Listing history 13 events
-
2026-06-19status $195,000 Active 13 DOM
-
2026-06-18days on market $195,000 Active Under Contract 13 DOM
-
2026-06-17days on market $195,000 Active Under Contract 12 DOM
-
2026-06-16days on market $195,000 Active Under Contract 11 DOM
-
2026-06-15status $195,000 Active Under Contract 10 DOM
-
2026-06-15days on market $195,000 Active 10 DOM
-
2026-06-13days on market $195,000 Active 8 DOM
-
2026-06-13days on market $195,000 Active 7 DOM
-
2026-06-10days on market $195,000 Active 5 DOM
-
2026-06-09days on market $195,000 Active 4 DOM
-
2026-06-08days on market $195,000 Active 3 DOM
-
2026-06-07remarks 320-char remark
-
2026-06-07$195,000 Active 2 DOM
ⓘ Source: listings_history table (triggers on properties + properties_extension) + one-shot
backfill from property_details.listing_events for pre-trigger history.
Tax reassessment forecast TX · Resets to sale price
- Current annual tax
- $3,180 · $265/mo
- Projected year-2 tax
- $3,568 · $297/mo
- Expected delta
- +$389/yr (+$32/mo · 12.2%)
ⓘ Screening estimate from a state-policy table — verify with the county assessor before closing.
Climate risk First Street
- Flood 1/10 Low FEMA zone X · 0% chance over 30 yrs
- Wildfire 1/10 Low
- Heat 6/10 Major 7 d/yr ≥102°F today · 25 d/yr by 30 yrs out
- Wind 1/10 Low
- Air quality 2/10 Low 1 unhealthy d/yr today · 2 by 30 yrs out
Nearby sold comps map
Loading sold comps map…
Walkable amenities ~0.75 mi
Loading nearby amenities…
Taxation est. · year 1
- Rental income
- $16,649
- − Mortgage interest
- −$10,923
- − Property taxes
- −$3,180
- − Insurance
- −$975
- − Repairs & maintenance
- −$1,332
- − Management
- −$1,332
- − Depreciation
- −$5,673
- Taxable loss
- −$6,766
- Est. tax savings @ 24.0%
- +$1,624
- After-tax cash flow
- $-1,650/yr
For passive investors: Depreciation is non-cash, so a rental often shows a tax loss while cash-flowing — sheltering income. Rental losses are passive: they offset passive income freely, and up to $25,000/yr can offset ordinary (W-2) income if you actively participate and your MAGI is under $100k (phasing out to $0 by $150k); unused losses carry forward. On sale, claimed depreciation is recaptured at up to 25%, and gains may owe capital-gains tax (a 1031 exchange can defer both). Figures are a year-1 estimate at your 24.0% rate — not tax advice; consult a CPA.
Schools (NCES district)
- District
- El Paso ISD
- NCES district ID
- 4818300
- Math proficiency
- 27% ▼ -24.00%
- Reading proficiency
- 37% ▼ -7.00%
- Median HH income
- $38,704
- Composite
- 26.75/100
- National rank
- #7138
- State rank
- #591 of 826 in TX
Livability — El Paso
- Score
- 81/100
- State rank
- #23
- US rank
- #1375
Category grades
Schools grade is shown separately in the Schools card above.
Census & demographics
- Census place
- El Paso, TX
- City population
- 630,223
- Population (ZIP)
- 22,062
Population outlook (El Paso County) Hauer SSP2
- Today (2025)
- 897,899 people
- By 2030
- 922,694 · +2.8%
- By 2040
- 960,492 · +7.0%
- By 2050
- 982,919 · +9.5%
- By 2075
- 997,266 · +11.1%
- By 2100
- 900,630 · +0.3%
Race, ethnicity, and origin ACS 2023
- Neighborhood character
- Predominantly Hispanic (93%)
- Race & ethnicity
- Hispanic / Latino 93% Two or more races 50% White 2% Native American 1% Pacific Islander 1%
- Hispanic origin (detail)
- Mexican 89%
- Foreign-born
- 32% · Canada
- Languages at home
- 14% English-only · Spanish 86%
Political lean MEDSL · El Paso
- 2024 margin
- D (+15.1) · D 57.0% · R 41.8% · Other 1.2%
- 2008→2024 swing
- -17.4pp toward R · 2008: 32.5pp · 2024: 15.1pp
- All cycles
- 2024: D+15.1 2020: D+35.1 2016: D+43.2 2012: D+32.6 2008: D+32.5
Not yet ingested
- Civics
- —
Market trends
- HPI YoY
- ▲ 29.29%
- Current HPI
- 258.3487
- Rent YoY
- —
- Metro
- —
- State GDP YoY
- ▲ 3.95%
- F500 in state
- 110
Industry mix (Fortune 500 HQ in TX)
| Industry | F500 HQs | Revenue |
|---|---|---|
| Energy | 16 | $1,198B |
|
||
| Technology | 5 | $198B |
|
||
| Engineering / Construction | 4 | $72B |
|
||
| Energy Services | 3 | $60B |
|
||
| Utilities | 3 | $41B |
|
||
| Healthcare | 2 | $330B |
|
||
Price history
3 events — show timeline
- 2026-06-04 Listed $195,000 GEPARMLS
- 1987-04-16 Sold (Public Records) — Public Records
- 1976-07-01 Sold (Public Records) — Public Records
Property tax history
+12.5%/yrLatest (2025): $3,180 · +12.0% YoY. Source: county tax records.
Cash-flow waterfall
monthlySold comps — $/sqft
last 12 mo · ≤1 miLoading sold comps…