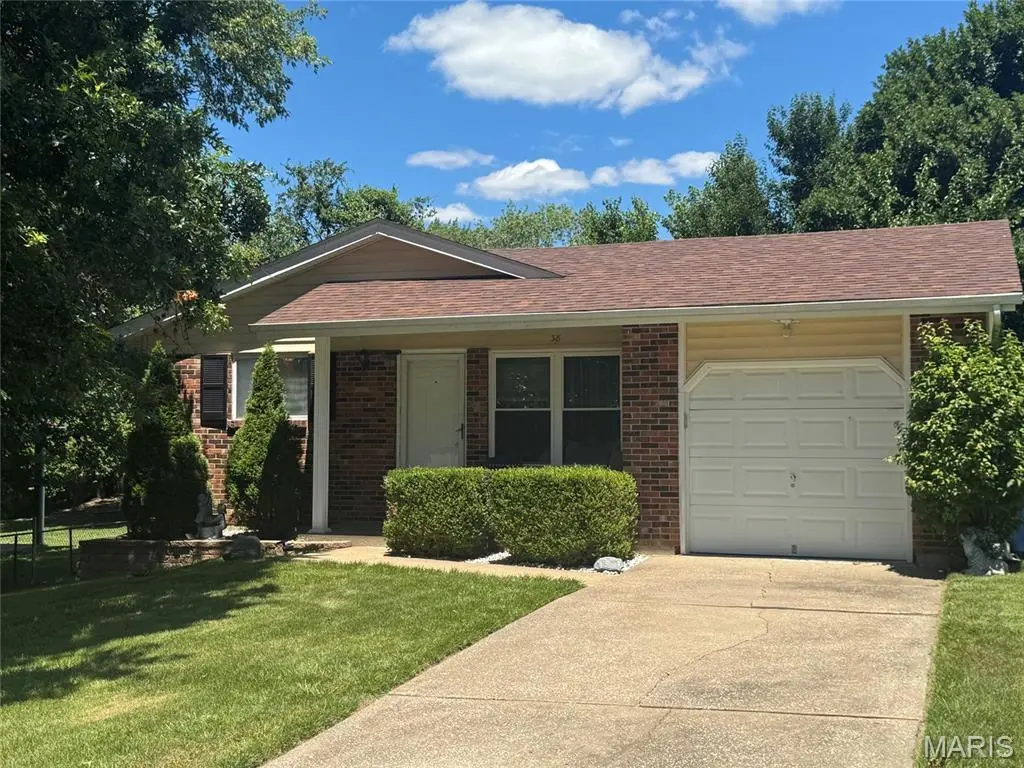
38 Matchlock Dr · O'Fallon, MO
Flood risk 1/10 · Minimal
- FEMA flood zone
- X (unshaded)
- Chance of flooding over 30 yrs
- 0.0%
- Est. flood insurance / yr
- $473 – $860
Fire risk 1/10 · Minimal
- Est. fire insurance / yr
- $1,054 – $1,958
Heat risk 5/10 · Moderate
- Hot days now (above 108°F)
- 7 days/yr
- Hot days in 30 yrs
- 20 days/yr
Wind risk 2/10 · Minimal
- Chance of severe wind over 30 yrs
- 1.0%
Air-quality risk 2/10 · Minimal
- Unhealthy air days now
- 1 days/yr
- Unhealthy air days in 30 yrs
- 1 days/yr
Risk factors via First Street. Map © Google.
Why this score? — see what drove the C- grade
The composite is a weighted blend of 9 inputs, each scored 0–100. Each bar is that input's sub-score; the figure is the points it added to the 100-point composite (weight × sub-score).
- Cash flow +15.5/30.0
- ARV discount +15.0/15.0
- Schools +5.1/10.0
- DSCR +4.8/10.0
- 1% rule +3.6/10.0
- Rent growth +3.2/5.0
- Livability +2.5/5.0
- Condition / age +2.5/5.0
- Appreciation +0.0/10.0
$249,900
🖨 Deal sheet 📄 Offer letter ✓ Due diligence
Listing remarks MLS
HURRY in to see this cute- well maintained Ranch Home in the Heart of O'fallon. Luxury Vinyl Plank floors greet you upon entry and extend through the living area as well as the kitchen and hallway. Down the hallway there are 2 carpeted bedrooms and a master at the end of the hall. The kitchen and family room areas are open concept making for great gathering space. In the fully finished basement you will find another family room with an adjacent sleeping area and full bathroom. The laundry space is finished nicely for function as well! Owners replaced the roof in 2020! Come see this great house before it's gone!
Key facts
- Covered front porch
- One-car garage
- Nicely sized yard
Tags
Property features AI
Finance
- Other: Living area approximately 1,644 (estimated) with roughly 864 above grade and 780 below grade
- Financial info: Lease not considered; Seller may consider concessions
Exterior
- Parking: Attached garage with 1 parking space
- Utilities: Public water; Public sewer; Electricity connected (single phase)
- Home design: Single-family residence; One story; House; Above-grade and below-grade finished living areas
- Construction: Brick, frame and vinyl siding construction; Architectural shingle roof; Concrete perimeter foundation; Built (year per public records)
- Exterior features: Covered patio/porch; Perimeter fencing; Front and back yards, landscaped; Asphalt road access
Interior
- Bedrooms: Three bedrooms, all on the main level (three main-level bedrooms)
- Flooring: Carpet; Laminate
- Bathrooms: Two full bathrooms (one main level, one lower level)
- Heating & cooling: Electric forced air heating; Central air conditioning; Ceiling fan(s)
- Interior features: Basement with 8+ ft poured concrete, includes bathroom, sleeping area, and storage space; Carpet and laminate flooring
Neighborhood map
What this means for you Summary
Snapshot
- This is a 3-bed/2.0-bath single-family listed at $250k.
Deal economics
- At list price, monthly cash flow is $103 ($1k/yr) — positive.
- The deal already cash-flows at list — no discount required.
- To meet the 1% rule (rent ≥ 1% of price), the offer needs to be $214k (14.2% below list).
- Recommended offer: $214k (14.2% below list) — sets the bar for 1% rule.
- Cap rate 6.8% vs local median 3.2% in O'Fallon — top-decile yield for the area; either an underpriced asset or a hidden risk that comps aren't pricing in. Stress-test before assuming the spread holds.
Location & tenants
- Location reads: area grade C — affects rentability + tenant quality, not the cash-flow math above.
- Ft. Zumwalt R-II (suburban): math 54% / reading 60% proficiency, ranked #14 of 324 in MO (top 4%) — acceptable for families but not a draw, mixed tenant base, ~2y average lease; only 18% free/reduced lunch — higher-income household profile.
- Zoned schools: Progress South Elem. (math 54% / reading 58%, grade C+, #180 of 1,115 statewide, top 16%, 678 students, 19% FRL); Ft. Zumwalt South High (math 57% / reading 70%, grade B-, #24 of 521 statewide, top 4%, 1,334 students, 15% FRL) — zoned schools at 17% FRL track the district average.
- Market conditions: Rents rising (+2.7%/yr); 290 active listings in the ZIP; 9 comparable units currently listed for rent nearby; rentals at typical pace (median 22d on market — plan ~3-4 weeks tenant-placement turnaround); solid renter incomes; 2,021 units permitted in St. Charles County in 2024 (568 in 5+ unit buildings).
Forward outlook
- Local home prices are declining (-3.0%/yr); year-one equity from $2k of loan paydown is wiped out by about $7k of value loss. Plan a longer hold.
- St. Charles County population projected at +22% by 2050 — long-run rental-demand tailwind backs the buy-and-hold thesis.
Negotiation context
- Only 1 days on market — expect competitive offers; lowballing is unlikely to land.
- 3 sale attempts since 9y ago with the ask held roughly flat each time — persistent listings suggest the price (not the market) is what's stuck; bring a comps-based counter.
- Current owner paid $144k; list at $250k implies a 74% gain — meaningful room to come down on a strong offer.
Risks & watch-outs
- Climate carrying-cost: extreme-heat days projected 7→20/yr by 2055 (HVAC capex compounding) — expect insurance premiums to compound above CPI over the hold.
Questions for the listing agent
- Is there a deadline driving the sale (1031 exchange, divorce, estate, relocation)? That informs how much negotiation room exists.
- What's the average days-on-market for RENTAL listings here right now (not sales)? A rising rental-DOM trend means longer vacancies and softer asking-rent achievability than the comps imply.
- What's the recent tenant-quality profile in this submarket — average credit score on applications, eviction rate, late-payment / NSF rate, and stable-employment percentage? A property-management company in the area should have these aggregated.
- How much new for-sale + rental construction is in the pipeline within 1–3 miles? Heavy new supply typically softens prices + rents 12–24 months out; constrained supply supports both.
Investment metrics
- 1% rule
- 0.86% ✗
- Cap rate
- 6.79%
- Cash-on-cash
- 1.76%
- DSCR
- 1.08
- GRM
- 9.7
CMA / ARV
- ARV (on-the-fly)
- $335,376
- Comps found
- 12
Show comp detail 12 sales within ~0.75 mi
| Address | Dist | Beds/Ba | Sqft | Sold | Price | $/sf | Match |
|---|---|---|---|---|---|---|---|
| 41 Pheasant Ring Dr | 0.13mi | 3/2.5 | 1,745 (+6%) | 2mo | $459,417 | $263 | 80 |
| 307 Santa Fe Trail Dr | 0.40mi | 3/2.0 | 1,613 (-2%) | 7mo | $355,000 | $220 | 72 |
| 2073 Williamstown Dr | 0.47mi | 4/2.0 (+1) | 1,636 (-0%) | 2mo | $319,900 | $196 | 71 |
| 2003 Lunenburg Dr | 0.43mi | 3/2.0 | 1,600 (-3%) | 8mo | $375,000 | $234 | 69 |
| 24 Saint Robert Dr | 0.38mi | 3/2.0 | 1,566 (-5%) | 9mo | $320,000 | $204 | 67 |
| 2 Laura Hill Rd | 0.23mi | 3/2.0 | 1,800 (+10%) | 8mo | $350,000 | $194 | 67 |
| 13 Kingspointe Dr | 0.17mi | 3/2.5 | 1,883 (+14%) | 8mo | $300,000 | $159 | 59 |
| 211 Butternut Stage Dr | 0.58mi | 4/3.0 (+1) | 1,678 (+2%) | 4mo | $369,900 | $220 | 57 |
| 1 Sunset Ln | 0.66mi | 3/2.5 | 1,680 (+2%) | 8mo | $335,000 | $199 | 57 |
| 83 Foxgate Ct | 0.69mi | 2/2.0 (-1) | 1,527 (-7%) | 1mo | $315,000 | $206 | 50 |
| 5 Arborgate Dr Unit 69A | 0.73mi | 2/2.0 (-1) | 1,520 (-8%) | 5mo | $309,000 | $203 | 44 |
| 6 Laura Dr | 0.72mi | 4/2.0 (+1) | 1,492 (-9%) | 5mo | $299,000 | $200 | 42 |
Match score weights: distance 35% · size 25% · config 20% · recency 20%. Top-matched comps best support the ARV.
Projected returns pro-forma
-3.0% appreciation · 2.69% rent growth · sell at horizon
- IRR
- -13.8%
- Equity multiple
- 0.50×
- Total profit
- $-34,670
- Equity at exit
- $37,261
- IRR
- -5.5%
- Equity multiple
- 0.65×
- Total profit
- $-24,693
- Equity at exit
- $21,607
Cash invested: $69,972 (down + closing). Projections, not guarantees.
Landlord ↔ Tenant lean methodology
- Overall (STATE)
- 81 Strongly Landlord-Friendly
- State Missouri
- 81 Strongly Landlord-Friendly · R+10
- County
- — inherits STATE
- City
- — inherits STATE
ZIP-level market 63376
- Rents YoY
- 2.7%
- Active inventory
- 290
- Price-to-rent
- 9.7×
Monthly cashflow live
- Estimated rent
- $2,143 high interval (Pro) →
- Mortgage (P&I)
- −$1,311
- Tax from tax record
- −$176 /mo · $2,108/yr
- Insurance
- −$104
- HOA
- −$0
- Vacancy / Maint / Mgmt
- −$450
- Net cashflow
- $103
Break-even live
UW: 25.0% down · 7.5% · 30yr · 1.5% tax · 5.0% vac · 8.0% maint · 8.0% mgmt
Financing live
Cash to close
- Down payment
- $62,475
- Closing costs
- $7,497
- Reserves months
- —
- Total cash needed
- —
Loan-product check · same deal, 3 products live
Conventional
25% down · 7.5% · 30yr
- Down + closing
- —
- Monthly P&I
- —
- Monthly cashflow
- —
- DSCR
- —
- Eligible?
- —
Personal DTI + credit; lowest rate.
DSCR
20% down · 8.5% · 30yr
- Down + closing
- —
- Monthly P&I
- —
- Monthly cashflow
- —
- DSCR
- —
- Eligible?
- —
No personal income docs; deal must DSCR.
Hard money
10% down · 12.0% · 12mo
- Down + closing
- —
- Monthly P&I
- —
- Monthly cashflow
- —
- DSCR
- —
- Eligible?
- —
Short-term bridge; refi at stabilization.
Rent comps 9 comps
| Address | Beds | Baths | Sqft | Rent | $/sqft | DOM | Units | Dist |
|---|---|---|---|---|---|---|---|---|
| 43 Kingspointe Dr Saint Peters, MO | 3.0 | 2.0 | 1072 | $2,125 | $1.98 | 23d | 1 | 0.29mi |
| 2 Aspen Pointe Dr Saint Peters, MO | 3.0 | 2.0 | 1547 | $2,170 | $1.40 | 2d | 1 | 0.51mi |
| 10 Kingsmont Ct Saint Peters, MO | 3.0 | 2.0 | 1488 | $2,446 | $1.64 | 21d | 1 | 0.70mi |
| 381 Erin Dr Saint Peters, MO | 3.0 | 2.5 | 1288 | $2,500 | $1.94 | 23d | 1 | 0.76mi |
| 106 Laura Dr Saint Peters, MO | 2.0 | 1.0 | 1286 | $1,650 | $1.28 | 11d | 1 | 0.77mi |
| 256 Cherrywood Parc Dr O Fallon, MO | 3.0 | 2.5 | 1590 | $2,276 | $1.43 | 4d | 1 | 0.94mi |
| 1000 Bramblett Xing O'Fallon, MO | 1.0–2.0 | 1.0–2.0 | 997 | $1,945 | $1.95 | 3d | 15 | 1.14mi |
| 333 Bramblett Hls O Fallon, MO | 2.0 | 2.0 | 1139 | $1,500 | $1.32 | 23d | 1 | 1.18mi |
| 172 Weatherby Landing Dr O Fallon, MO | 3.0 | 2.5 | 1748 | $2,300 | $1.32 | 23d | 1 | 1.40mi |
Listing history 2 events
-
2026-06-18remarks 693-char remark
-
2026-06-18$249,900 Active 1 DOM
ⓘ Source: listings_history table (triggers on properties + properties_extension) + one-shot
backfill from property_details.listing_events for pre-trigger history.
Tax reassessment forecast MO · Resets to sale price
- Current annual tax
- $2,108 · $176/mo
- Projected year-2 tax
- $2,424 · $202/mo
- Expected delta
- +$316/yr (+$26/mo · 15.0%)
ⓘ Screening estimate from a state-policy table — verify with the county assessor before closing.
Climate risk First Street
- Flood 1/10 Low FEMA zone X (unshaded) · 0% chance over 30 yrs
- Wildfire 1/10 Low
- Heat 5/10 Major 7 d/yr ≥108°F today · 20 d/yr by 30 yrs out
- Wind 2/10 Low 100% chance of damaging wind over 30 yrs
- Air quality 2/10 Low 1 unhealthy d/yr today · 1 by 30 yrs out
Nearby sold comps map
Loading sold comps map…
Walkable amenities ~0.75 mi
Loading nearby amenities…
Taxation est. · year 1
- Rental income
- $25,717
- − Mortgage interest
- −$13,998
- − Property taxes
- −$2,108
- − Insurance
- −$1,250
- − Repairs & maintenance
- −$2,057
- − Management
- −$2,057
- − Depreciation
- −$7,270
- Taxable loss
- −$3,024
- Est. tax savings @ 24.0%
- +$726
- After-tax cash flow
- $1,958/yr
For passive investors: Depreciation is non-cash, so a rental often shows a tax loss while cash-flowing — sheltering income. Rental losses are passive: they offset passive income freely, and up to $25,000/yr can offset ordinary (W-2) income if you actively participate and your MAGI is under $100k (phasing out to $0 by $150k); unused losses carry forward. On sale, claimed depreciation is recaptured at up to 25%, and gains may owe capital-gains tax (a 1031 exchange can defer both). Figures are a year-1 estimate at your 24.0% rate — not tax advice; consult a CPA.
Schools (NCES district)
- District
- Ft. Zumwalt R-II
- NCES district ID
- 2908370
- Math proficiency
- 54% ▼ -7.00%
- Reading proficiency
- 60% ▼ -4.00%
- Median HH income
- $75,817
- Composite
- 51.04/100
- National rank
- #1772
- State rank
- #14 of 324 in MO
Livability — O'Fallon
No livability data for this city. (Only ~50 U.S. cities are tracked.)
Census & demographics
- County
- Saint Charles County · 399,703 people
- City population
- 45,862
- Metro
- St. Louis, MO-IL
- Population (ZIP)
- 74,962
- Household income
- $96,393
- Rent vs Own
- Severe rent burden
- 964.0
Population outlook (St. Charles County) Hauer SSP2
- Today (2025)
- 437,857 people
- By 2030
- 461,707 · +5.4%
- By 2040
- 503,222 · +14.9%
- By 2050
- 534,684 · +22.1%
- By 2075
- 597,047 · +36.4%
- By 2100
- 609,682 · +39.2%
Race, ethnicity, and origin ACS 2023
- Neighborhood character
- Predominantly White (86%)
- Race & ethnicity
- White 86% Two or more races 6% Black 5% Hispanic / Latino 2% Asian 2%
- Common ancestry
- Lithuanian 3% Romanian 3% Italian 2%
- Foreign-born
- 3% · China, Canada
- Languages at home
- 96% English-only · Spanish 1% Chinese 1% Other Asian/Pacific 1%
Political lean MEDSL · St. Charles
- 2024 margin
- R (+17.0) · D 40.8% · R 57.8% · Other 1.4%
- 2008→2024 swing
- -7.2pp toward R · 2008: -9.7pp · 2024: -17.0pp
- All cycles
- 2024: R+17.0 2020: R+17.5 2016: R+26.4 2012: R+21.0 2008: R+9.7
Not yet ingested
- Civics
- —
Market trends
- HPI YoY
- ▼ -315.50%
- Current HPI
- 230.3362
- Rent YoY
- ▲ 2.69%
- Metro
- St. Louis, MO-IL
- State GDP YoY
- ▲ 1.84%
- F500 in state
- 20
Industry mix (Fortune 500 HQ in MO)
| Industry | F500 HQs | Revenue |
|---|---|---|
| Healthcare | 1 | $163B |
|
||
| Insurance | 1 | $21B |
|
||
| Industrial Technology | 1 | $17B |
|
||
| Retail | 1 | $16B |
|
||
| Industrial Distribution | 1 | $10B |
|
||
| Utilities | 1 | $9B |
|
||
Price history
+4898.0% since first listed18 events — show timeline
- 2026-06-18 Listed $249,900 MARIS as Distributed by MLS Grid
- 2026-06-18 Coming Soon $249,900 MARIS as Distributed by MLS Grid
- 2022-07-15 Sold (Public Records) — Public Records
- 2022-07-12 Sold (MLS) — MARIS as Distributed by MLS Grid
- 2022-06-07 Pending — MARIS as Distributed by MLS Grid
- 2022-05-31 Listed $200,000 MARIS as Distributed by MLS Grid
- 2022-05-29 Coming Soon $200,000 MARIS as Distributed by MLS Grid
- 2017-08-03 Sold (Public Records) $144,000 Public Records
- 2017-07-28 Sold (MLS) — MARIS as Distributed by MLS Grid
- 2017-06-10 Pending — MARIS as Distributed by MLS Grid
- 2017-06-07 Price Changed $144,900 MARIS as Distributed by MLS Grid
- 2017-06-02 Price Changed $147,900 MARIS as Distributed by MLS Grid
- 2017-05-25 Listed $149,900 MARIS as Distributed by MLS Grid
- 2017-05-16 Coming Soon $149,900 MARIS as Distributed by MLS Grid
- 2003-06-26 Sold (Public Records) $80,000 Public Records
- 1986-01-01 Sold (Public Records) $46,200 Public Records
- 1983-10-01 Sold (Public Records) $5,000 Public Records
- 1983-07-01 Sold (Public Records) — Public Records
Property tax history
+4.6%/yrLatest (2025): $2,108 · +1.2% YoY. Source: county tax records.
Cash-flow waterfall
monthlySold comps — $/sqft
last 12 mo · ≤1 miLoading sold comps…