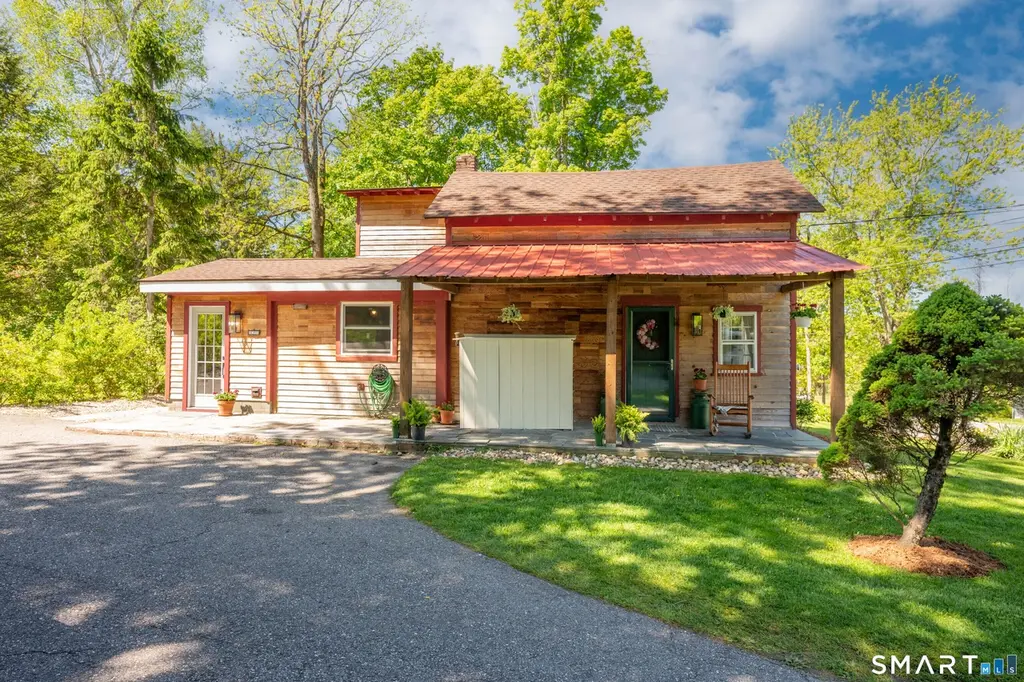
91 Amenia Rd · Sharon, CT
Flood risk 1/10 · Minimal
- FEMA flood zone
- X
- Chance of flooding over 30 yrs
- 0.0%
- Est. flood insurance / yr
- $507 – $1,088
Fire risk 3/10 · Minor
- Est. fire insurance / yr
- $829 – $1,539
Heat risk 3/10 · Minor
- Hot days now (above 95°F)
- 7 days/yr
- Hot days in 30 yrs
- 16 days/yr
Wind risk 4/10 · Minor
- Chance of severe wind over 30 yrs
- 16.0%
Air-quality risk 3/10 · Minor
- Unhealthy air days now
- 2 days/yr
- Unhealthy air days in 30 yrs
- 3 days/yr
Risk factors via First Street. Map © Google.
Why this score? — see what drove the A- grade
The composite is a weighted blend of 9 inputs, each scored 0–100. Each bar is that input's sub-score; the figure is the points it added to the 100-point composite (weight × sub-score).
- Cash flow +30.0/30.0
- ARV discount +15.0/15.0
- 1% rule +10.0/10.0
- DSCR +10.0/10.0
- Schools +5.1/10.0
- Appreciation +3.9/10.0
- Livability +3.0/5.0
- Rent growth +2.5/5.0
- Condition / age +2.5/5.0
$299,000
🖨 Deal sheet 📄 Offer letter ✓ Due diligence
Listing remarks MLS
Charming antique colonial in move in condition. Refinished wood floors, large dressing room, laundry room. Updates include: septic 2002, boiler 2004, well 2004. Fenced in yard. A must see. Owners relocating. Won't last long at this price!
Key facts
- Covered front porch
- Country kitchen
- Manageable lot
Tags
Property features AI
Finance
- Financial info: Assessed value listed (public record)
Exterior
- Utilities: Private well water; Septic sewage system; Fuel tank located in basement
- Home design: Single-family home
- Construction: Frame construction; Wood and shingle exterior siding; Stone foundation; Asphalt shingle roof; Tan exterior color; Built-in living area approximately 1008 (public record)
- Exterior features: Level lot; Porch; Shed
Interior
- Kitchen: Cooktop; Microwave; Refrigerator; Dishwasher
- Bedrooms: 2 bedrooms
- Bathrooms: 1 full bathroom
- Heating & cooling: Oil-fired heat (baseboard and hot air); Window unit cooling
- Interior features: Laundry room on the main level; Mud room; Full unfinished basement with interior access and partial hatchway
- Laundry & utility: Washer and dryer included (main level); Domestic electric hot water
Neighborhood map
What this means for you Summary
Snapshot
- This is a 2-bed/1.0-bath single-family listed at $299k.
Deal economics
- At list price, monthly cash flow is $2k ($22k/yr) — positive.
- The deal already cash-flows at list — no discount required.
- Meets the 1% rule at list price ($5k rent vs $299k).
- Recommended offer: $295k (1.5% below list) — sets the bar for market timing.
Location & tenants
- Location reads 59/100 on livability (#141 in CT) — a working-class tenant base; expect higher turnover. Strengths: employment A+, crime A, cost of living B+; Watch: amenities F, commute D-, housing F.
- Sharon School District (rural): math 50% / reading 60% proficiency, ranked #110 of 192 in CT (top 57%) — acceptable for families but not a draw, mixed tenant base, ~2y average lease; only 18% free/reduced lunch — higher-income household profile.
- Market conditions: 36 active listings in the ZIP; 154 units permitted in Northwest Hills Planning Region in 2024 (6 in 5+ unit buildings).
Forward outlook
- Local home prices are declining (-2.2%/yr); year-one equity from $2k of loan paydown is wiped out by about $7k of value loss. Plan a longer hold.
- At projected returns (-2.2% appreciation + 3.0% rent growth), your $84k cash investment doubles in ~5 years — after that, you're playing with house money.
Negotiation context
- It's been on market 15 days — a 2% lower offer ($295k) is reasonable based on typical stale-listing flexibility.
- 3 sale attempts since 29y ago; this cycle's ask has dropped $70k (19%) from the opening price — seller is motivated, your offer sets the floor, not the list.
- Current owner paid $202k; 48% above their basis — modest negotiation headroom, anchor on the comps not their cost.
Risks & watch-outs
- Watch-outs: built in 1875 — expect roof / HVAC / electrical / plumbing capex.
Questions for the listing agent
- Built in 1875 — when were the roof, HVAC, electrical panel, plumbing, and water heater last replaced?
- Is there a deadline driving the sale (1031 exchange, divorce, estate, relocation)? That informs how much negotiation room exists.
- Schools are B-rated — typically a magnet for longer-tenancy family renters. What's the average tenant stay here, and is there a school-zone premium baked into asking?
- What's the average days-on-market for RENTAL listings here right now (not sales)? A rising rental-DOM trend means longer vacancies and softer asking-rent achievability than the comps imply.
- What's the recent tenant-quality profile in this submarket — average credit score on applications, eviction rate, late-payment / NSF rate, and stable-employment percentage? A property-management company in the area should have these aggregated.
- How much new for-sale + rental construction is in the pipeline within 1–3 miles? Heavy new supply typically softens prices + rents 12–24 months out; constrained supply supports both.
Investment metrics
- 1% rule
- 1.56% ✓
- Cap rate
- 13.76%
- Cash-on-cash
- 26.68%
- DSCR
- 2.19
- GRM
- 5.3
CMA / ARV
- ARV (on-the-fly)
- $416,304
- Comps found
- 2
Show comp detail 2 sales within ~0.75 mi
| Address | Dist | Beds/Ba | Sqft | Sold | Price | $/sf | Match |
|---|---|---|---|---|---|---|---|
| 74 Hilltop Rd | 0.62mi | 2/1.0 | 1,004 (-0%) | 19mo | $415,000 | $413 | 55 |
| 99 King Hill Rd | 0.59mi | 2/1.0 | 1,150 (+14%) | 20mo | $300,000 | $261 | 32 |
Match score weights: distance 35% · size 25% · config 20% · recency 20%. Top-matched comps best support the ARV.
Projected returns pro-forma
-2.17% appreciation · 3.0% rent growth · sell at horizon
- IRR
- 22.4%
- Equity multiple
- 1.96×
- Total profit
- $80,487
- Equity at exit
- $55,700
- IRR
- 29.3%
- Equity multiple
- 3.77×
- Total profit
- $231,675
- Equity at exit
- $45,361
Cash invested: $83,720 (down + closing). Projections, not guarantees.
Landlord ↔ Tenant lean methodology
- Overall (STATE)
- 27 Tenant-Leaning
- State Connecticut
- 27 Tenant-Leaning · D+7
- County
- — inherits STATE
- City
- — inherits STATE
ZIP-level market 06069
- Home prices YoY
- -0.7%
- Active inventory
- 36
- Price-to-rent
- 5.3×
Monthly cashflow live
- Estimated rent
- $4,664 medium interval (Pro) →
- Mortgage (P&I)
- −$1,568
- Tax from tax record
- −$130 /mo · $1,564/yr
- Insurance
- −$125
- HOA
- −$0
- Vacancy / Maint / Mgmt
- −$979
- Net cashflow
- $1,862
Break-even live
UW: 25.0% down · 7.5% · 30yr · 1.5% tax · 5.0% vac · 8.0% maint · 8.0% mgmt
Financing live
Cash to close
- Down payment
- $74,750
- Closing costs
- $8,970
- Reserves months
- —
- Total cash needed
- —
Loan-product check · same deal, 3 products live
Conventional
25% down · 7.5% · 30yr
- Down + closing
- —
- Monthly P&I
- —
- Monthly cashflow
- —
- DSCR
- —
- Eligible?
- —
Personal DTI + credit; lowest rate.
DSCR
20% down · 8.5% · 30yr
- Down + closing
- —
- Monthly P&I
- —
- Monthly cashflow
- —
- DSCR
- —
- Eligible?
- —
No personal income docs; deal must DSCR.
Hard money
10% down · 12.0% · 12mo
- Down + closing
- —
- Monthly P&I
- —
- Monthly cashflow
- —
- DSCR
- —
- Eligible?
- —
Short-term bridge; refi at stabilization.
Listing history 24 events
-
2026-06-19days on market $299,000 Active 15 DOM
-
2026-06-18days on market $299,000 Active 14 DOM
-
2026-06-17days on market $299,000 Active 13 DOM
-
2026-06-16days on market $299,000 Active 12 DOM
-
2026-06-15days on market $299,000 Active 11 DOM
-
2026-06-13pricedays on market $299,000 Active 9 DOM
-
2026-06-12days on market $335,000 Active 8 DOM
-
2026-06-10days on market $335,000 Active 6 DOM
-
2026-06-09days on market $335,000 Active 5 DOM
-
2026-06-08days on market $335,000 Active 4 DOM
-
2026-06-07days on market $335,000 Active 3 DOM
-
2026-06-05pricedays on market $335,000 Active 1 DOM
-
2026-06-02days on market $369,000 Active 14 DOM
-
2026-06-01days on market $369,000 Active 13 DOM
-
2026-05-31days on market $369,000 Active 12 DOM
-
2026-05-30days on market $369,000 Active 11 DOM
-
2026-05-19$369,000 Active
-
2006-08-09soldstatus $202,460
-
2006-08-08soldstatus $202,460 238-char remark
Show marketing remark (238 chars)
Charming antique colonial in move in condition. Refinished wood floors, large dressing room, laundry room. Updates include: septic 2002, boiler 2004, well 2004. Fenced in yard. A must see. Owners relocating. Won't last long at this price!
-
2005-12-17$189,900 238-char remark
Show marketing remark (238 chars)
Charming antique colonial in move in condition. Refinished wood floors, large dressing room, laundry room. Updates include: septic 2002, boiler 2004, well 2004. Fenced in yard. A must see. Owners relocating. Won't last long at this price!
-
2004-04-05soldstatus $160,000
-
1998-05-21soldstatus $80,000
-
1997-08-20historical
-
1997-07-23$99,900
ⓘ Source: listings_history table (triggers on properties + properties_extension) + one-shot
backfill from property_details.listing_events for pre-trigger history.
Tax reassessment forecast CT · Partial reset (capped growth)
- Current annual tax
- $1,564 · $130/mo
- Projected year-2 tax
- $3,981 · $332/mo
- Expected delta
- +$2,417/yr (+$201/mo · 154.6%)
ⓘ Screening estimate from a state-policy table — verify with the county assessor before closing.
Climate risk First Street
- Flood 1/10 Low FEMA zone X · 0% chance over 30 yrs
- Wildfire 3/10 Moderate
- Heat 3/10 Moderate 7 d/yr ≥95°F today · 16 d/yr by 30 yrs out
- Wind 4/10 Moderate 16% chance of damaging wind over 30 yrs
- Air quality 3/10 Moderate 2 unhealthy d/yr today · 3 by 30 yrs out
Nearby sold comps map
Loading sold comps map…
Walkable amenities ~0.75 mi
Loading nearby amenities…
Taxation est. · year 1
- Rental income
- $55,967
- − Mortgage interest
- −$16,749
- − Property taxes
- −$1,564
- − Insurance
- −$1,495
- − Repairs & maintenance
- −$4,477
- − Management
- −$4,477
- − Depreciation
- −$8,698
- Taxable income
- $18,506
- Est. tax owed @ 24.0%
- −$4,442
- After-tax cash flow
- $17,898/yr
For passive investors: Depreciation is non-cash, so a rental often shows a tax loss while cash-flowing — sheltering income. Rental losses are passive: they offset passive income freely, and up to $25,000/yr can offset ordinary (W-2) income if you actively participate and your MAGI is under $100k (phasing out to $0 by $150k); unused losses carry forward. On sale, claimed depreciation is recaptured at up to 25%, and gains may owe capital-gains tax (a 1031 exchange can defer both). Figures are a year-1 estimate at your 24.0% rate — not tax advice; consult a CPA.
Schools (NCES district)
- District
- Sharon School District
- NCES district ID
- 0904020
- Math proficiency
- 50% ▲ 10.00%
- Reading proficiency
- 60% ▲ 15.00%
- Median HH income
- $72,415
- Composite
- 50.86/100
- National rank
- #3869
- State rank
- #110 of 192 in CT
Livability — Sharon
- Score
- 59/100
- State rank
- #141
- US rank
- #20344
Category grades
Schools grade is shown separately in the Schools card above.
Census & demographics
- Census place
- Sharon, CT
- Population (ZIP)
- 2,562
Population outlook (Northwest Hills County) Hauer SSP2
- By 2040
- 118,998
Race, ethnicity, and origin ACS 2023
- Neighborhood character
- Predominantly White (80%)
- Race & ethnicity
- White 80% Asian 5% Two or more races 4% Hispanic / Latino 1%
- Common ancestry
- Italian 5% Russian 4% Slovak 3%
- Foreign-born
- 18% · Canada, South Korea
- Languages at home
- 83% English-only · Other Indo-European 9% French/Haitian/Cajun 3% Korean 2%
Political lean MEDSL · Northwest Hills
- 2024 margin
- Toss-up / Even · D 48.6% · R 49.9% · Other 1.6%
- All cycles
- 2024: R+1.3
Not yet ingested
- Civics
- —
Market trends
- HPI YoY
- ▼ -2.17%
- Current HPI
- 321.8949
- Rent YoY
- —
- Metro
- —
- State GDP YoY
- ▲ 1.06%
- F500 in state
- 38
Industry mix (Fortune 500 HQ in CT)
| Industry | F500 HQs | Revenue |
|---|---|---|
| Industrial Machinery | 4 | $38B |
|
||
| Insurance | 3 | $71B |
|
||
| Financial Services | 2 | $25B |
|
||
| Transportation / Logistics | 2 | $18B |
|
||
| Healthcare | 1 | $247B |
|
||
| Telecommunications | 1 | $55B |
|
||
Price history
+269.4% since first listed8 events — show timeline
- 2026-05-19 Listed $369,000 Smart MLS
- 2006-08-09 Sold (Public Records) $202,460 Public Records
- 2006-08-08 Sold (MLS) $202,460 Smart MLS
- 2005-12-17 Listed $189,900 Smart MLS
- 2004-04-05 Sold (Public Records) $160,000 Public Records
- 1998-05-21 Sold (Public Records) $80,000 Public Records
- 1997-08-20 Listing Removed — Smart MLS
- 1997-07-23 Listed $99,900 Smart MLS
Property tax history
+1.4%/yrLatest (2023): $1,564 · +0.0% YoY. Source: county tax records.
Cash-flow waterfall
monthlySold comps — $/sqft
last 12 mo · ≤1 miLoading sold comps…