305 Gills Branch Rd · Monterey, KY
Flood risk 9/10 · Severe
- FEMA flood zone
- X (unshaded)
- Chance of flooding over 30 yrs
- 0.99%
- Est. flood insurance / yr
- $507 – $1,088
Fire risk 4/10 · Minor
- Est. fire insurance / yr
- $839 – $1,559
Heat risk 4/10 · Minor
- Hot days now (above 103°F)
- 7 days/yr
- Hot days in 30 yrs
- 19 days/yr
Wind risk 2/10 · Minimal
- Chance of severe wind over 30 yrs
- 1.0%
Air-quality risk 2/10 · Minimal
- Unhealthy air days now
- 1 days/yr
- Unhealthy air days in 30 yrs
- 3 days/yr
Risk factors via First Street. Map © Google.
Why this score? — see what drove the D+ grade
The composite is a weighted blend of 9 inputs, each scored 0–100. Each bar is that input's sub-score; the figure is the points it added to the 100-point composite (weight × sub-score).
- Cash flow +11.5/30.0
- Appreciation +10.0/10.0
- ARV discount +7.5/15.0
- 1% rule +3.5/10.0
- DSCR +3.4/10.0
- Rent growth +2.5/5.0
- Condition / age +2.5/5.0
- Schools +2.4/10.0
- Livability +2.1/5.0
$112,000
🖨 Deal sheet (PDF) 📄 Offer letter ✓ Due diligence
Listing remarks MLS
For comp purposes only
Key facts
- Central heat and air
- Convenient access
- Spacious lot
Tags
Property features AI
Exterior
- Parking: Driveway
- Utilities: Public water; Septic tank
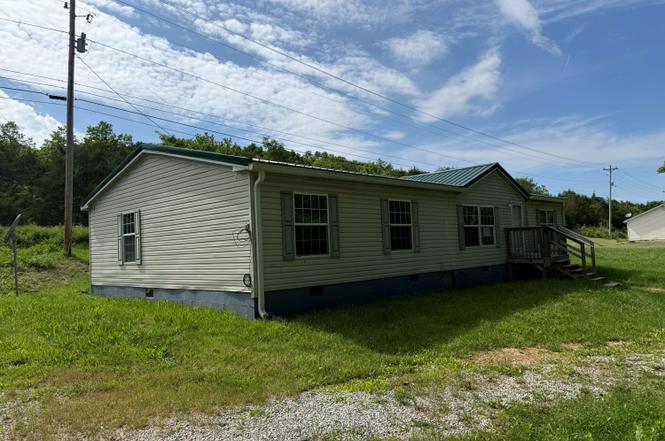
- Home design: Single-family manufactured home (double wide); One level; Built in 2007
- Construction: Vinyl siding; Metal roof; Block foundation and mobile home base
- Exterior features: Deck; Porch; Cleared, level lot; County road frontage; Paved road access; Has view
Interior
- Kitchen: Eat-in kitchen
- Bedrooms: Primary bedroom; Bedroom 2
- Bathrooms: 2 full bathrooms
- Heating & cooling: Central air conditioning; Forced air heating (electric)
- Interior features: Eat-in kitchen
- Laundry & utility: Main level laundry room with washer hookup and electric dryer hookup
Neighborhood map
What this means for you Summary
Snapshot
- This is a 3-bed/2.0-bath other listed at $112k.
Deal economics
- At list price, monthly cash flow is $-102 ($-1k/yr) — negative.
- To cash-flow at today's rent, offer at most $94k (16.2% below list).
- To meet the 1% rule (rent ≥ 1% of price), the offer needs to be $95k (14.9% below list).
- Recommended offer: $94k (16.2% below list) — sets the bar for cash-flow.
Location & tenants
- Location reads 41/100 on livability (#532 in KY) — a working-class tenant base; expect higher turnover. Strengths: cost of living A+, crime A; Watch: amenities F, commute F, employment F.
- Owen County (rural): math 24% / reading 32% proficiency, ranked #120 of 165 in KY (top 73%) — low school quality limits family demand, transient renter base, plan for 1-2y turnover.
- Zoned schools: Owen County Elementary/Primary School (math 27% / reading 35%, grade F, #378 of 676 statewide, top 57%, 690 students, 62% FRL); Maurice Bowling Middle School (math 22% / reading 33%, grade F, #168 of 217 statewide, top 78%, 484 students, 62% FRL); Owen County High School (math 27% / reading 27%, grade F, #158 of 254 statewide, top 68%, 558 students, 53% FRL).
- Market conditions: 103 active listings in the ZIP; 18 units permitted in Owen County in 2024 (0 in 5+ unit buildings).
Forward outlook
- In year one you build about $12k of equity ($774 loan paydown + $11k appreciation (10.0% local appreciation)).
- Owen County population projected at -14% by 2050 — secular population decline; favor cash flow + early exit over multi-decade hold.
- By year 3, paydown + projected appreciation supports a ~$30k cash-out refi (75% LTV) — recoverable capital for the next deal without selling this one.
Negotiation context
- Only 5 days on market — expect competitive offers; lowballing is unlikely to land.
- 3 sale attempts since 3y ago with the ask held roughly flat each time — persistent listings suggest the price (not the market) is what's stuck; bring a comps-based counter.
Risks & watch-outs
- Watch-outs: flood insurance adds $66/mo.
- Climate carrying-cost: severe flood risk — expect insurance premiums to compound above CPI over the hold.
Questions for the listing agent
- What do current leases actually rent for vs. the listed asking? Can we see a recent rent roll and the last 12 months of T-12 income?
- What's the actual annual flood-insurance premium (NFIP or private), and is the property in a SFHA with mandatory coverage?
- Is there a deadline driving the sale (1031 exchange, divorce, estate, relocation)? That informs how much negotiation room exists.
- Schools are F-rated, which usually means shorter tenancies and higher turnover. Who's the typical renter profile here, and what's been the actual vacancy rate?
- The area grade is low — what's the realistic commute time and amenity access for the typical tenant pool here? Any planned neighborhood developments (good or bad) we should know about?
- What's the average days-on-market for RENTAL listings here right now (not sales)? A rising rental-DOM trend means longer vacancies and softer asking-rent achievability than the comps imply.
- What's the recent tenant-quality profile in this submarket — average credit score on applications, eviction rate, late-payment / NSF rate, and stable-employment percentage? A property-management company in the area should have these aggregated.
- How much new for-sale + rental construction is in the pipeline within 1–3 miles? Heavy new supply typically softens prices + rents 12–24 months out; constrained supply supports both.
Investment metrics
- 1% rule
- 0.85% ✗
- Cap rate
- 5.91%
- Cash-on-cash
- -1.38%
- DSCR
- 0.94
- GRM
- 9.8
CMA / ARV
No comps found within radius.
Projected returns pro-forma
10.0% appreciation · 3.0% rent growth · sell at horizon
- IRR
- 21.5%
- Equity multiple
- 2.74×
- Total profit
- $54,539
- Equity at exit
- $100,898
- IRR
- 19.4%
- Equity multiple
- 6.29×
- Total profit
- $165,868
- Equity at exit
- $217,591
Cash invested: $31,360 (down + closing). Projections, not guarantees.
Landlord ↔ Tenant lean methodology
- Overall (STATE)
- 83 Strongly Landlord-Friendly
- State Kentucky
- 83 Strongly Landlord-Friendly · R+16
- County
- — inherits STATE
- City
- — inherits STATE
ZIP-level market 40359
- Home prices YoY
- 8.3%
- Active inventory
- 103
- Price-to-rent
- 9.8×
Monthly cashflow live
- Estimated rent
- $954 medium interval (Pro) →
- Mortgage (P&I)
- −$587
- Tax from tax record
- −$155 /mo · $1,863/yr
- Insurance
- −$47
- Flood insurance flood zone
- −$66 /mo · $798/yr
- HOA
- −$0
- Vacancy / Maint / Mgmt
- −$200
- Net cashflow
- $-102
Break-even live
Sensitivity live
| Price | -10% $-39 | -5% $-71 | +0% $-102 | +5% $-134 | +10% $-166 |
|---|---|---|---|---|---|
| Rent | -10% $-178 | -5% $-140 | +0% $-102 | +5% $-65 | +10% $-27 |
| Rate | -1.0pp $-46 | -0.5pp $-74 | base $-102 | +0.5pp $-131 | +1.0pp $-161 |
UW: 25.0% down · 7.5% · 30yr · 1.5% tax · 5.0% vac · 8.0% maint · 8.0% mgmt
Financing live
Cash to close
- Down payment
- $28,000
- Closing costs
- $3,360
- Reserves months
- —
- Total cash needed
- —
Loan-product check · same deal, 3 products live
Conventional
25% down · 7.5% · 30yr
- Down + closing
- —
- Monthly P&I
- —
- Monthly cashflow
- —
- DSCR
- —
- Eligible?
- —
Personal DTI + credit; lowest rate.
DSCR
20% down · 8.5% · 30yr
- Down + closing
- —
- Monthly P&I
- —
- Monthly cashflow
- —
- DSCR
- —
- Eligible?
- —
No personal income docs; deal must DSCR.
Hard money
10% down · 12.0% · 12mo
- Down + closing
- —
- Monthly P&I
- —
- Monthly cashflow
- —
- DSCR
- —
- Eligible?
- —
Short-term bridge; refi at stabilization.
Listing history 4 events
-
2026-06-22days on market $112,000 Active 5 DOM
-
2026-06-19days on market $112,000 Active 2 DOM
-
2026-06-17remarks 626-char remark
-
2026-06-17$112,000 Active 1 DOM
ⓘ Source: listings_history table (triggers on properties + properties_extension) + one-shot
backfill from property_details.listing_events for pre-trigger history.
Tax reassessment forecast KY · Resets to sale price
- Current annual tax
- $1,863 · $155/mo
- Projected year-2 tax
- $1,863 · $155/mo
- Expected delta
- $0/yr ($0/mo · 0.0%)
ⓘ Screening estimate from a state-policy table — verify with the county assessor before closing.
Climate risk First Street
- Flood 9/10 Extreme FEMA zone X (unshaded) · 99% chance over 30 yrs
- Wildfire 4/10 Moderate
- Heat 4/10 Moderate 7 d/yr ≥103°F today · 19 d/yr by 30 yrs out
- Wind 2/10 Low 100% chance of damaging wind over 30 yrs
- Air quality 2/10 Low 1 unhealthy d/yr today · 3 by 30 yrs out
Nearby sold comps map
Loading sold comps map…
Walkable amenities ~0.75 mi
Loading nearby amenities…
Taxation est. · year 1
- Rental income
- $11,442
- − Mortgage interest
- −$6,274
- − Property taxes
- −$1,863
- − Insurance
- −$1,358
- − Repairs & maintenance
- −$915
- − Management
- −$915
- − Depreciation
- −$3,258
- Taxable loss
- −$3,141
- Est. tax savings @ 24.0%
- +$754
- After-tax cash flow
- $-475/yr
For passive investors: Depreciation is non-cash, so a rental often shows a tax loss while cash-flowing — sheltering income. Rental losses are passive: they offset passive income freely, and up to $25,000/yr can offset ordinary (W-2) income if you actively participate and your MAGI is under $100k (phasing out to $0 by $150k); unused losses carry forward. On sale, claimed depreciation is recaptured at up to 25%, and gains may owe capital-gains tax (a 1031 exchange can defer both). Figures are a year-1 estimate at your 24.0% rate — not tax advice; consult a CPA.
Schools (NCES district)
- District
- Owen County
- NCES district ID
- 2104560
- Math proficiency
- 24% ▼ -19.00%
- Reading proficiency
- 32% ▼ -18.00%
- Median HH income
- $42,943
- Composite
- 23.84/100
- National rank
- #7804
- State rank
- #120 of 165 in KY
Livability — Monterey
- Score
- 41/100
- State rank
- #532
- US rank
- #27187
Category grades
Schools grade is shown separately in the Schools card above.
Census & demographics
- Population (ZIP)
- 7,222
Population outlook (Owen County) Hauer SSP2
- Today (2025)
- 10,496 people
- By 2030
- 10,251 · -2.3%
- By 2040
- 9,650 · -8.1%
- By 2050
- 8,984 · -14.4%
- By 2075
- 7,589 · -27.7%
- By 2100
- 6,380 · -39.2%
Race, ethnicity, and origin ACS 2023
- Neighborhood character
- Predominantly White (97%)
- Race & ethnicity
- White 97% Two or more races 2%
- Common ancestry
- Lithuanian 2% Slovak 2% Italian 1%
- Foreign-born
- 0%
- Languages at home
- 99% English-only · Spanish 1%
Political lean MEDSL · Owen
- 2024 margin
- Solid R (+62.7) · D 18.0% · R 80.7% · Other 1.3%
- 2008→2024 swing
- -35.9pp toward R · 2008: -26.8pp · 2024: -62.7pp
- All cycles
- 2024: R+62.7 2020: R+58.5 2016: R+53.7 2012: R+32.3 2008: R+26.8
Not yet ingested
- Civics
- —
Market trends
- HPI YoY
- ▲ 16.56%
- Current HPI
- 215.21
- Rent YoY
- —
- Metro
- —
- State GDP YoY
- ▲ 1.81%
- F500 in state
- 4
Industry mix (Fortune 500 HQ in KY)
| Industry | F500 HQs | Revenue |
|---|---|---|
| Healthcare | 1 | $118B |
|
||
| Food / Beverage | 1 | $7B |
|
||
Price history
-30.0% since first listed8 events — show timeline
- 2026-06-16 Listed $112,000 NKMLS
- 2024-01-25 Sold (Public Records) $154,500 Public Records
- 2024-01-12 Sold (MLS) $154,500 NKMLS
- 2024-01-12 Sold (MLS) $154,500 ImagineMLS
- 2023-12-15 Listing Removed — ImagineMLS
- 2023-12-07 Pending — NKMLS
- 2023-12-01 Listed $154,500 ImagineMLS
- 2023-11-13 Listed $159,900 NKMLS
Property tax history
+6.5%/yrLatest (2025): $1,863 · +2.7% YoY. Source: county tax records.
Cash-flow waterfall
monthlySold comps — $/sqft
last 12 mo · ≤1 miLoading sold comps…