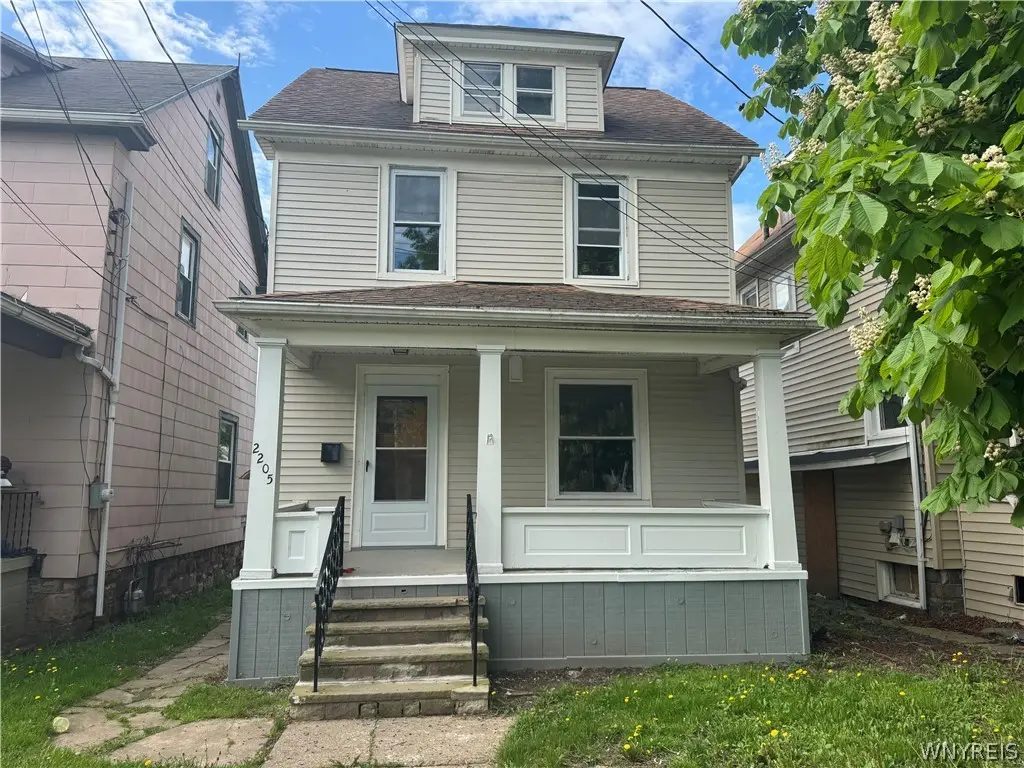
2205 La Salle Ave · Niagara Falls, NY
Flood risk 1/10 · Minimal
- FEMA flood zone
- X (unshaded)
- Chance of flooding over 30 yrs
- 0.0%
- Est. flood insurance / yr
- $473 – $860
Fire risk 1/10 · Minimal
- Est. fire insurance / yr
- $691 – $1,283
Heat risk 3/10 · Minor
- Hot days now (above 94°F)
- 7 days/yr
- Hot days in 30 yrs
- 15 days/yr
Wind risk 1/10 · Minimal
- Chance of severe wind over 30 yrs
- —
Air-quality risk 3/10 · Minor
- Unhealthy air days now
- 2 days/yr
- Unhealthy air days in 30 yrs
- 3 days/yr
Risk factors via First Street. Map © Google.
Why this score? — see what drove the B grade
The composite is a weighted blend of 9 inputs, each scored 0–100. Each bar is that input's sub-score; the figure is the points it added to the 100-point composite (weight × sub-score).
- Cash flow +21.6/30.0
- ARV discount +11.7/15.0
- Appreciation +10.0/10.0
- 1% rule +8.1/10.0
- DSCR +6.9/10.0
- Rent growth +4.7/5.0
- Livability +3.0/5.0
- Schools +2.5/10.0
- Condition / age +2.5/5.0
$99,900
🖨 Deal sheet 📄 Offer letter ✓ Due diligence
Listing remarks MLS
VR Pricing. Seller will consider offers between $10,000 and $30,000. Home offers entry foyer, formal living room, formal dining room, eat in kitchen, 3 spacious bedrooms and hallway, full bath, walk up attic, full basement, hardwood floors, fully fenced yard, 2.0 car garage, covered front porch, updates include roof '06, siding '08, furnace '07, garage roof '05, blown in insulation '08, updated electric service '13. Ready for its new owner.
Key facts
- New furnace
- New kitchen
- New tiled bathroom
Tags
Property features AI
Exterior
- Parking: Detached garage; Approximately 1.5 garage spaces
- Utilities: Public water connected; Sewer connected
- Home design: 2-story existing building; Vinyl siding exterior; Block foundation; Resale condition
- Construction: Built as existing structure; Vinyl siding construction; Block foundation
- Exterior features: Concrete driveway; City street frontage; Rectangular residential lot (30 x 126 feet)
Interior
- Kitchen: Gas water heater
- Bedrooms: Total of 9 rooms (bedroom count not specified)
- Flooring: Carpet; Luxury vinyl; Varied flooring
- Bathrooms: 1 full bathroom
- Heating & cooling: Gas forced-air heating
- Interior features: Eat-in kitchen; Other interior features (see remarks)
- Laundry & utility: Has basement (full)
Neighborhood map
What this means for you Summary
Snapshot
- This is a 3-bed/1.0-bath single-family listed at $100k.
Deal economics
- At list price, monthly cash flow is $152 ($2k/yr) — positive.
- The deal already cash-flows at list — no discount required.
- Meets the 1% rule at list price ($1k rent vs $100k).
- Recommended offer: $98k (1.5% below list) — sets the bar for market timing.
Location & tenants
- Location reads 60/100 on livability (#956 in NY) — a middle-class / working-renter tenant base. Strengths: cost of living A+, housing A+; Watch: schools F, crime F, amenities F.
- Niagara Falls City School District (urban): math 26% / reading 34% proficiency, ranked #578 of 590 in NY (top 98%) — families likely to look elsewhere, expect single-tenant / working-renter base with shorter leases; 66% free/reduced lunch — lower-income household profile, screen leases tightly.
- Market conditions: Rents rising fast (+8.8%/yr); 164 active listings in the ZIP; 24 comparable units currently listed for rent nearby; rentals at typical pace (median 17d on market — plan ~3-4 weeks tenant-placement turnaround); lower-income renter base — watch delinquency; 167 units permitted in Niagara County in 2024 (0 in 5+ unit buildings).
- At $1,307/mo this rent would consume 45% of the median local household income ($35k/yr) (locally 954% of renters already pay >50% of income on rent) — very limited rent-growth headroom before tenants either downsize or default.
Forward outlook
- In year one you build about $11k of equity ($691 loan paydown + $10k appreciation (10.0% local appreciation)).
- Niagara County population projected at -19% by 2050 — secular population decline; favor cash flow + early exit over multi-decade hold.
- At projected returns (10.0% appreciation + 8.0% rent growth), your $28k cash investment doubles in ~3 years — after that, you're playing with house money.
- By year 4, paydown + projected appreciation supports a ~$38k cash-out refi (75% LTV) — recoverable capital for the next deal without selling this one.
Negotiation context
- It's been on market 19 days — a 2% lower offer ($98k) is reasonable based on typical stale-listing flexibility.
- 4 sale attempts since 14y ago with the ask held roughly flat each time — persistent listings suggest the price (not the market) is what's stuck; bring a comps-based counter.
- Current owner paid $47k; list at $100k implies a 113% gain — meaningful room to come down on a strong offer.
Risks & watch-outs
- Watch-outs: property tax is 3.8% of price; built in 1919 — expect roof / HVAC / electrical / plumbing capex.
Questions for the listing agent
- Built in 1919 — when were the roof, HVAC, electrical panel, plumbing, and water heater last replaced?
- Property tax is high relative to price — has the assessment been appealed recently, and will the sale trigger a re-assessment?
- Is there a deadline driving the sale (1031 exchange, divorce, estate, relocation)? That informs how much negotiation room exists.
- Schools are F-rated, which usually means shorter tenancies and higher turnover. Who's the typical renter profile here, and what's been the actual vacancy rate?
- Crime grade is F in this area — have there been break-ins, vandalism, or insurance claims at this property in the last 3 years? What carrier currently insures it and at what premium?
- What's the average days-on-market for RENTAL listings here right now (not sales)? A rising rental-DOM trend means longer vacancies and softer asking-rent achievability than the comps imply.
- What's the recent tenant-quality profile in this submarket — average credit score on applications, eviction rate, late-payment / NSF rate, and stable-employment percentage? A property-management company in the area should have these aggregated.
- How much new for-sale + rental construction is in the pipeline within 1–3 miles? Heavy new supply typically softens prices + rents 12–24 months out; constrained supply supports both.
Investment metrics
- 1% rule
- 1.31% ✓
- Cap rate
- 8.12%
- Cash-on-cash
- 6.54%
- DSCR
- 1.29
- GRM
- 6.4
CMA / ARV
- ARV (on-the-fly)
- $110,240
- Comps found
- 12
Show comp detail 12 sales within ~0.75 mi
| Address | Dist | Beds/Ba | Sqft | Sold | Price | $/sf | Match |
|---|---|---|---|---|---|---|---|
| 2219 Forest Ave | 0.14mi | 3/1.0 | 1,116 (+7%) | 5mo | $155,000 | $139 | 77 |
| 609 25th St | 0.46mi | 3/2.0 | 1,040 (0%) | 2mo | $158,000 | $152 | 73 |
| 1812 Pierce Ave | 0.23mi | 3/1.0 | 1,152 (+11%) | 0mo | $65,000 | $56 | 71 |
| 1133 Whitney Ave | 0.64mi | 3/1.0 | 1,057 (+2%) | 3mo | $76,100 | $72 | 65 |
| 633 33rd St | 0.75mi | 3/1.0 | 1,050 (+1%) | 1mo | $145,000 | $138 | 63 |
| 1512 Willow Ave | 0.44mi | 3/1.0 | 1,148 (+10%) | 0mo | $39,300 | $34 | 62 |
| 1145 Whitney Ave | 0.62mi | 3/1.5 | 992 (-5%) | 1mo | $105,100 | $106 | 61 |
| 422 21st St | 0.73mi | 3/1.0 | 992 (-5%) | 5mo | $136,000 | $137 | 54 |
| 724 17th St | 0.40mi | 3/1.5 | 1,179 (+13%) | 4mo | $70,000 | $59 | 54 |
| 544 30th St | 0.68mi | 3/1.0 | 964 (-7%) | 3mo | $62,000 | $64 | 54 |
| 627 13th St | 0.67mi | 3/1.5 | 1,120 (+8%) | 4mo | $110,000 | $98 | 50 |
| 2487 Grand Ave | 0.39mi | 4/1.5 (+1) | 1,188 (+14%) | 1mo | $169,900 | $143 | 50 |
Match score weights: distance 35% · size 25% · config 20% · recency 20%. Top-matched comps best support the ARV.
Projected returns pro-forma
10.0% appreciation · 8.0% rent growth · sell at horizon
- IRR
- 31.6%
- Equity multiple
- 3.54×
- Total profit
- $71,161
- Equity at exit
- $89,998
- IRR
- 29.3%
- Equity multiple
- 8.84×
- Total profit
- $219,296
- Equity at exit
- $194,084
Cash invested: $27,972 (down + closing). Projections, not guarantees.
Landlord ↔ Tenant lean methodology
- Overall (STATE)
- 15 Strongly Tenant-Friendly
- State New York
- 15 Strongly Tenant-Friendly · D+10
- County
- — inherits STATE
- City
- — inherits STATE
ZIP-level market 14301
- Home prices YoY
- 6.2%
- Rents YoY
- 8.8%
- Active inventory
- 164
- Price-to-rent
- 6.4×
Monthly cashflow live
- Estimated rent
- $1,307 high interval (Pro) →
- Mortgage (P&I)
- −$524
- Tax from tax record
- −$314 /mo · $3,770/yr
- Insurance
- −$42
- HOA
- −$0
- Vacancy / Maint / Mgmt
- −$274
- Net cashflow
- $152
Break-even live
UW: 25.0% down · 7.5% · 30yr · 1.5% tax · 5.0% vac · 8.0% maint · 8.0% mgmt
Financing live
Cash to close
- Down payment
- $24,975
- Closing costs
- $2,997
- Reserves months
- —
- Total cash needed
- —
Loan-product check · same deal, 3 products live
Conventional
25% down · 7.5% · 30yr
- Down + closing
- —
- Monthly P&I
- —
- Monthly cashflow
- —
- DSCR
- —
- Eligible?
- —
Personal DTI + credit; lowest rate.
DSCR
20% down · 8.5% · 30yr
- Down + closing
- —
- Monthly P&I
- —
- Monthly cashflow
- —
- DSCR
- —
- Eligible?
- —
No personal income docs; deal must DSCR.
Hard money
10% down · 12.0% · 12mo
- Down + closing
- —
- Monthly P&I
- —
- Monthly cashflow
- —
- DSCR
- —
- Eligible?
- —
Short-term bridge; refi at stabilization.
Rent comps 24 comps
| Address | Beds | Baths | Sqft | Rent | $/sqft | DOM | Units | Dist |
|---|---|---|---|---|---|---|---|---|
| 1808 Whitney Ave Unit 3 Niagara Falls, NY | 2.0 | 1.0 | 1200 | $900 | $0.75 | 43d | 1 | 0.18mi |
| 769 19th St Niagara Falls, NY | 2.0 | 1.5 | 960 | $1,400 | $1.46 | 21d | 1 | 0.24mi |
| 1001 17th St Niagara Falls, NY | 3.0 | 1.0 | 1152 | $1,800 | $1.56 | 23d | 1 | 0.29mi |
| 2473 Pierce Ave Unit 2 Niagara Falls, NY | 2.0 | 1.0 | 1000 | $1,200 | $1.20 | 3d | 1 | 0.29mi |
| 784 15th St Niagara Falls, NY | 3.0 | 1.5 | 1380 | $1,350 | $0.98 | 3d | 1 | 0.44mi |
| 754 15th St Niagara Falls, NY | 3.0 | 1.0 | 990 | $1,100 | $1.11 | 23d | 1 | 0.47mi |
| 2463 South Ave Niagara Falls, NY | 2.0 | 1.0 | 1008 | $1,100 | $1.09 | 17d | 1 | 0.48mi |
| 1817 Ontario Ave Unit 1 Niagara Falls, NY | 2.0 | 1.0 | 999 | $1,899 | $1.90 | 1d | 1 | 0.60mi |
| 1817 Ontario Ave Unit 2 Niagara Falls, NY | 2.0 | 1.0 | 985 | $1,899 | $1.93 | 1d | 1 | 0.60mi |
| 613 13th St Unit 1 Niagara Falls, NY | 2.0 | 1.0 | 750 | $1,100 | $1.47 | 17d | 1 | 0.68mi |
| 434 23rd St Unit Upper Niagara Falls, NY | 2.0 | 1.0 | 816 | $1,100 | $1.35 | 14d | 1 | 0.72mi |
| 420 18th St Unit Upper Niagara Falls, NY | 2.0 | 1.0 | 816 | $1,150 | $1.41 | 43d | 1 | 0.77mi |
| 420 25th St Niagara Falls, NY | 3.0 | 1.0 | 1101 | $1,500 | $1.36 | 43d | 1 | 0.79mi |
| 1427 Fort Ave Unit 2 Niagara Falls, NY | 3.0 | 1.0 | 1058 | $950 | $0.90 | 43d | 1 | 0.80mi |
| 2727 Monroe Ave Niagara Falls, NY | 3.0 | 1.0 | 960 | $1,500 | $1.56 | 10d | 1 | 0.86mi |
| 1780 Falls St Niagara Falls, NY | 2.0 | 1.0 | 1100 | $1,200 | $1.09 | 43d | 1 | 0.89mi |
| 724 Augustus Pl Niagara Falls, NY | 4.0 | 1.0 | 1200 | $1,500 | $1.25 | 43d | 1 | 0.97mi |
| 2420 Mackenna Ave Unit 1 Niagara Falls, NY | 4.0 | 1.0 | 1300 | $1,390 | $1.07 | 1d | 1 | 1.04mi |
| 616 7th St Niagara Falls, NY | 2.0 | 1.0 | 770 | $1,150 | $1.49 | 23d | 1 | 1.04mi |
| 3036 Welch Ave Niagara Falls, NY | 3.0 | 1.0 | 1000 | $1,500 | $1.50 | 1d | 1 | 1.05mi |
| 642 Ashland Ave Niagara Falls, NY | 3.0 | 1.0 | 1238 | $1,100 | $0.89 | 3d | 1 | 1.06mi |
| 3626 Dudley Ave Niagara Falls, NY | 2.0 | 1.0 | 700 | $1,250 | $1.79 | 43d | 1 | 1.09mi |
| 3340 Simmons Ave Niagara Falls, NY | 3.0 | 1.0 | 1008 | $1,550 | $1.54 | 14d | 1 | 1.17mi |
| 2814 10th St Niagara Falls, NY | 2.0 | 1.0 | 900 | $900 | $1.00 | 1d | 1 | 1.24mi |
Listing history 17 events
-
2026-06-18days on market $99,900 Active 19 DOM
-
2026-06-17days on market $99,900 Active 18 DOM
-
2026-06-16days on market $99,900 Active 17 DOM
-
2026-06-15remarks 694-char remark
-
2026-06-15days on market $99,900 Active 16 DOM
-
2026-06-07days on market $99,900 Active 17 DOM
-
2026-06-03days on market $99,900 Active 13 DOM
-
2026-06-02days on market $99,900 Active 12 DOM
-
2026-06-01days on market $99,900 Active 11 DOM
-
2026-05-31days on market $99,900 Active 10 DOM
-
2026-05-21$99,900 Active
-
2020-05-11soldstatus $47,000
-
2019-05-30soldstatus $67,000
-
2013-12-05soldstatus $18,500 446-char remark
Show marketing remark (446 chars)
VR Pricing. Seller will consider offers between $10,000 and $30,000. Home offers entry foyer, formal living room, formal dining room, eat in kitchen, 3 spacious bedrooms and hallway, full bath, walk up attic, full basement, hardwood floors, fully fenced yard, 2.0 car garage, covered front porch, updates include roof '06, siding '08, furnace '07, garage roof '05, blown in insulation '08, updated electric service '13. Ready for its new owner.
-
2013-10-10$30,000 446-char remark
Show marketing remark (446 chars)
VR Pricing. Seller will consider offers between $10,000 and $30,000. Home offers entry foyer, formal living room, formal dining room, eat in kitchen, 3 spacious bedrooms and hallway, full bath, walk up attic, full basement, hardwood floors, fully fenced yard, 2.0 car garage, covered front porch, updates include roof '06, siding '08, furnace '07, garage roof '05, blown in insulation '08, updated electric service '13. Ready for its new owner.
-
2013-04-09$34,500
-
2012-10-02$39,900
ⓘ Source: listings_history table (triggers on properties + properties_extension) + one-shot
backfill from property_details.listing_events for pre-trigger history.
Tax reassessment forecast NY · Partial reset (capped growth)
- Current annual tax
- $3,770 · $314/mo
- Projected year-2 tax
- $3,770 · $314/mo
- Expected delta
- $0/yr ($0/mo · 0.0%)
ⓘ Screening estimate from a state-policy table — verify with the county assessor before closing.
Climate risk First Street
- Flood 1/10 Low FEMA zone X (unshaded) · 0% chance over 30 yrs
- Wildfire 1/10 Low
- Heat 3/10 Moderate 7 d/yr ≥94°F today · 15 d/yr by 30 yrs out
- Wind 1/10 Low
- Air quality 3/10 Moderate 2 unhealthy d/yr today · 3 by 30 yrs out
Nearby sold comps map
Loading sold comps map…
Walkable amenities ~0.75 mi
Loading nearby amenities…
Taxation est. · year 1
- Rental income
- $15,678
- − Mortgage interest
- −$5,596
- − Property taxes
- −$3,770
- − Insurance
- −$500
- − Repairs & maintenance
- −$1,254
- − Management
- −$1,254
- − Depreciation
- −$2,906
- Taxable income
- $398
- Est. tax owed @ 24.0%
- −$96
- After-tax cash flow
- $1,734/yr
For passive investors: Depreciation is non-cash, so a rental often shows a tax loss while cash-flowing — sheltering income. Rental losses are passive: they offset passive income freely, and up to $25,000/yr can offset ordinary (W-2) income if you actively participate and your MAGI is under $100k (phasing out to $0 by $150k); unused losses carry forward. On sale, claimed depreciation is recaptured at up to 25%, and gains may owe capital-gains tax (a 1031 exchange can defer both). Figures are a year-1 estimate at your 24.0% rate — not tax advice; consult a CPA.
Schools (NCES district)
- District
- Niagara Falls City School District
- NCES district ID
- 3620820
- Math proficiency
- 26% ▼ -10.00%
- Reading proficiency
- 34% ▲ 3.00%
- Median HH income
- $32,488
- Composite
- 24.5/100
- National rank
- #7655
- State rank
- #578 of 590 in NY
Livability — Niagara Falls
- Score
- 60/100
- State rank
- #956
- US rank
- #18749
Category grades
Schools grade is shown separately in the Schools card above.
Census & demographics
- Census place
- Niagara Falls, NY
- County
- Niagara County · 157,377 people
- City population
- 62,983
- Metro
- Buffalo-Cheektowaga, NY
- Population (ZIP)
- 10,923
- Household income
- $34,549
- Rent vs Own
- Severe rent burden
- 954.0
Population outlook (Niagara County) Hauer SSP2
- Today (2025)
- 204,149 people
- By 2030
- 197,900 · -3.1%
- By 2040
- 182,239 · -10.7%
- By 2050
- 165,198 · -19.1%
- By 2075
- 129,416 · -36.6%
- By 2100
- 96,222 · -52.9%
Race, ethnicity, and origin ACS 2023
- Neighborhood character
- Diverse neighborhood (Simpson 0.58)
- Race & ethnicity
- White 59% Black 25% Two or more races 8% Hispanic / Latino 8% Asian 2%
- Hispanic origin (detail)
- Puerto Rican 3% Cuban 2%
- Common ancestry
- Romanian 6% Slovak 2% Lithuanian 1%
- Foreign-born
- 5% · Canada, China, Dominican Republic
- Languages at home
- 90% English-only · Spanish 6% Other Indo-European 3% Chinese 1%
Political lean MEDSL · Niagara
- 2024 margin
- R (+14.9) · D 42.5% · R 57.5%
- 2008→2024 swing
- -15.9pp toward R · 2008: 1.0pp · 2024: -14.9pp
- All cycles
- 2024: R+14.9 2020: R+9.7 2016: R+19.0 2012: D+0.6 2008: D+1.0
Not yet ingested
- Civics
- —
Market trends
- HPI YoY
- ▲ 15.41%
- Current HPI
- 266.1457
- Rent YoY
- ▲ 8.79%
- Metro
- Buffalo-Cheektowaga, NY
- State GDP YoY
- ▲ 2.60%
- F500 in state
- 92
Industry mix (Fortune 500 HQ in NY)
| Industry | F500 HQs | Revenue |
|---|---|---|
| Financial Services | 10 | $950B |
|
||
| Consumer Goods | 9 | $162B |
|
||
| Insurance | 4 | $225B |
|
||
| Telecommunications | 2 | $144B |
|
||
| Pharmaceuticals | 2 | $112B |
|
||
| Media / Entertainment | 2 | $69B |
|
||
Price history
+150.4% since first listed7 events — show timeline
- 2026-05-21 Listed $99,900 WNYREIS
- 2020-05-11 Sold (Public Records) $47,000 Public Records
- 2019-05-30 Sold (Public Records) $67,000 Public Records
- 2013-12-05 Sold (MLS) $18,500 WNYREIS
- 2013-10-10 Listed $30,000 WNYREIS
- 2013-04-09 Listed $34,500 WNYREIS
- 2012-10-02 Listed $39,900 WNYREIS
Property tax history
+7.5%/yrLatest (2025): $3,770 · -2.7% YoY. Source: county tax records.
Cash-flow waterfall
monthlySold comps — $/sqft
last 12 mo · ≤1 miLoading sold comps…