 Duplex
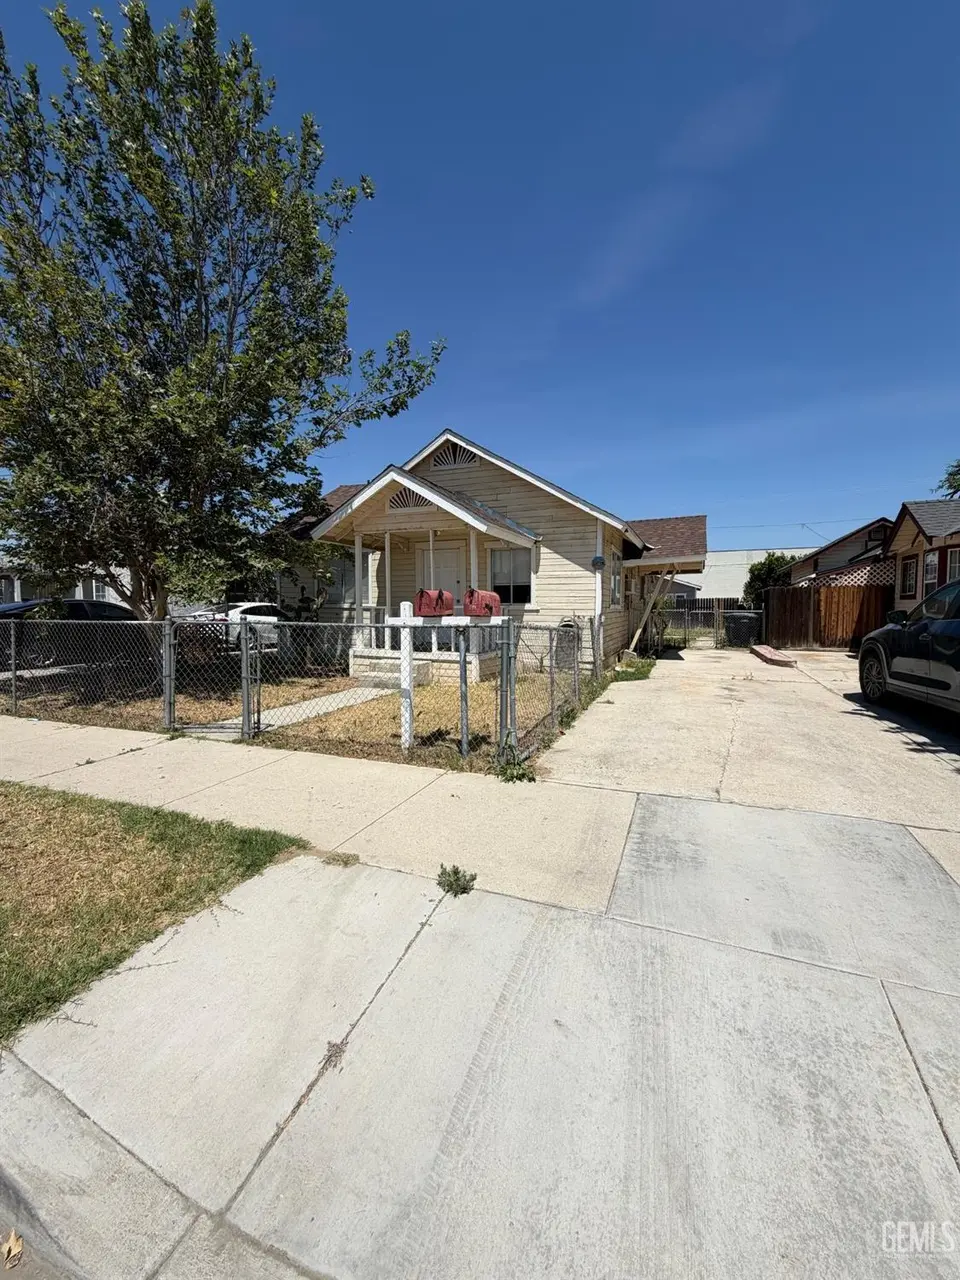
180 Poso St · Shafter, CA
Flood risk 1/10 · Minimal
- FEMA flood zone
- X (unshaded)
- Chance of flooding over 30 yrs
- 0.0%
- Est. flood insurance / yr
- $507 – $1,088
Fire risk 5/10 · Moderate
- Est. fire insurance / yr
- $659 – $1,223
Heat risk 8/10 · Major
- Hot days now (above 105°F)
- 7 days/yr
- Hot days in 30 yrs
- 19 days/yr
Wind risk 1/10 · Minimal
- Chance of severe wind over 30 yrs
- —
Air-quality risk 10/10 · Severe
- Unhealthy air days now
- 23 days/yr
- Unhealthy air days in 30 yrs
- 28 days/yr
Risk factors via First Street. Map © Google.
Why this score? — see what drove the D+ grade
The composite is a weighted blend of 9 inputs, each scored 0–100. Each bar is that input's sub-score; the figure is the points it added to the 100-point composite (weight × sub-score).
- Cash flow +19.9/30.0
- ARV discount +7.5/15.0
- DSCR +6.3/10.0
- 1% rule +4.5/10.0
- Livability +3.6/5.0
- Rent growth +2.5/5.0
- Condition / age +2.5/5.0
- Schools +1.5/10.0
- Appreciation +0.0/10.0
$280,000
🖨 Deal sheet 📄 Offer letter ✓ Due diligence
Multi-family units
County records classify this as Multi-Family (2-4 Unit). Listing-text estimate: 2 units. confirmed
Listing remarks MLS
Great investment opportunity to own a Dulpex, in the Peaceful City of Shafter. 3BD+1BA in the front 956 sqft unit, and 2BD+1BA in the 708 sqft back unit. Some recent cosmetic upgrades, such as laminate flooring in both units and some painting in the front unit have been done by seller. Seller has never lived at the property, therefore has never done any major updates. Definitely needs TLC. Property is situated in a great area, across the street from a Park, as well as a super market, not to mention, new nearby shopping Center coming soon.
Key facts
- 6,534 sq ft lot
- Built 1937
Neighborhood map
What this means for you Summary
Snapshot
- This is a 2 × 2-bed/1-bath units multifamily listed at $280k.
Deal economics
- At list price, monthly cash flow is $337 ($4k/yr) — positive. Per door: $169/mo.
- The deal already cash-flows at list — no discount required.
- To meet the 1% rule (rent ≥ 1% of price), the offer needs to be $266k (4.9% below list).
- Recommended offer: $266k (4.9% below list) — sets the bar for 1% rule.
- Cap rate 7.7% vs local median 2.7% in Shafter — top-decile yield for the area; either an underpriced asset or a hidden risk that comps aren't pricing in. Stress-test before assuming the spread holds.
Location & tenants
- Location reads 72/100 on livability (#185 in CA) — a middle-class / working-renter tenant base. Strengths: amenities A+, housing A+; Watch: health & safety C-, commute D+, cost of living D+.
- Richland Union Elementary (town): math 11% / reading 24% proficiency, ranked #480 of 517 in CA (top 93%) — low school quality limits family demand, transient renter base, plan for 1-2y turnover; 79% free/reduced lunch — lower-income household profile, screen leases tightly.
- Zoned schools: Golden Oak Elementary (math 13% / reading 24%, grade F, #1,313 of 1,571 statewide, top 84%, 729 students, 91% FRL).
- Market conditions: 176 active listings in the ZIP; 3 comparable units currently listed for rent nearby; rentals lingering (median 44d on market — plan ~5-8 weeks vacancy on turnover, expect pricing pressure); 100% of comp listings sitting > 30 days — soft ceiling on asking rent; 3,244 units permitted in Kern County in 2024 (73 in 5+ unit buildings).
Forward outlook
- Local home prices are declining (-3.0%/yr); year-one equity from $2k of loan paydown is wiped out by about $8k of value loss. Plan a longer hold.
- Kern County population projected at +17% by 2050 — long-run rental-demand tailwind backs the buy-and-hold thesis.
Negotiation context
- Only 0 days on market — expect competitive offers; lowballing is unlikely to land.
- 2 sale attempts since 10y ago with the ask held roughly flat each time — persistent listings suggest the price (not the market) is what's stuck; bring a comps-based counter.
- Current owner paid $127k; list at $280k implies a 120% gain — meaningful room to come down on a strong offer.
Risks & watch-outs
- Watch-outs: built in 1937 — expect roof / HVAC / electrical / plumbing capex.
- Climate carrying-cost: moderate wildfire risk; extreme-heat days projected 7→19/yr by 2055 (HVAC capex compounding) — expect insurance premiums to compound above CPI over the hold.
Questions for the listing agent
- Can we see the unit-by-unit rent roll, current vacancy, and any below-market leases? What's the average tenancy length?
- What capital expenditures (roof, boiler, parking lot, exteriors) have been made in the last 5 years, and what's planned in the next 2?
- Built in 1937 — when were the roof, HVAC, electrical panel, plumbing, and water heater last replaced?
- Is there a deadline driving the sale (1031 exchange, divorce, estate, relocation)? That informs how much negotiation room exists.
- Schools are F-rated, which usually means shorter tenancies and higher turnover. Who's the typical renter profile here, and what's been the actual vacancy rate?
- The area grade is low — what's the realistic commute time and amenity access for the typical tenant pool here? Any planned neighborhood developments (good or bad) we should know about?
- What's the average days-on-market for RENTAL listings here right now (not sales)? A rising rental-DOM trend means longer vacancies and softer asking-rent achievability than the comps imply.
- What's the recent tenant-quality profile in this submarket — average credit score on applications, eviction rate, late-payment / NSF rate, and stable-employment percentage? A property-management company in the area should have these aggregated.
- How much new apartment / multifamily construction is in the pipeline within 1–3 miles? Heavy new supply (>2% of stock underway) typically softens rents 12–24 months out; light construction supports rent growth.
Investment metrics
- 1% rule
- 0.95% ✗
- Cap rate
- 7.74%
- Cash-on-cash
- 5.16%
- DSCR
- 1.23
- GRM
- 8.8
CMA / ARV
No comps found within radius.
Projected returns pro-forma
-3.0% appreciation · 3.0% rent growth · sell at horizon
- IRR
- -8.3%
- Equity multiple
- 0.69×
- Total profit
- $-23,946
- Equity at exit
- $41,749
- IRR
- 1.2%
- Equity multiple
- 1.08×
- Total profit
- $6,563
- Equity at exit
- $24,209
Cash invested: $78,400 (down + closing). Projections, not guarantees.
Landlord ↔ Tenant lean methodology
- Overall (STATE)
- 18 Strongly Tenant-Friendly
- State California
- 18 Strongly Tenant-Friendly · D+13
- County
- — inherits STATE
- City
- — inherits STATE
ZIP-level market 93263
- Home prices YoY
- -13.1%
- Active inventory
- 176
- Price-to-rent
- 17.5×
Monthly cashflow live
- Estimated rent
- $2,664 medium interval (Pro) →
- Mortgage (P&I)
- −$1,468
- Tax from tax record
- −$182 /mo · $2,186/yr
- Insurance
- −$117
- HOA
- −$0
- Vacancy / Maint / Mgmt
- −$559
- Net cashflow
- $337
Break-even live
2-unit breakdown (identical units grouped — click to expand)
| Units | Beds | Baths | Est. rent |
|---|---|---|---|
| 2× units | 2 | 1 | $2,664 |
| #1 | 2 | 1 | $1,332 |
| #2 | 2 | 1 | $1,332 |
| Total (2 units) | $2,664 | ||
UW: 25.0% down · 7.5% · 30yr · 1.5% tax · 5.0% vac · 8.0% maint · 8.0% mgmt
Financing live
Cash to close
- Down payment
- $70,000
- Closing costs
- $8,400
- Reserves months
- —
- Total cash needed
- —
Loan-product check · same deal, 3 products live
Conventional
25% down · 7.5% · 30yr
- Down + closing
- —
- Monthly P&I
- —
- Monthly cashflow
- —
- DSCR
- —
- Eligible?
- —
Personal DTI + credit; lowest rate.
DSCR
20% down · 8.5% · 30yr
- Down + closing
- —
- Monthly P&I
- —
- Monthly cashflow
- —
- DSCR
- —
- Eligible?
- —
No personal income docs; deal must DSCR.
Hard money
10% down · 12.0% · 12mo
- Down + closing
- —
- Monthly P&I
- —
- Monthly cashflow
- —
- DSCR
- —
- Eligible?
- —
Short-term bridge; refi at stabilization.
Rent comps 3 comps
| Address | Beds | Baths | Sqft | Rent | $/sqft | DOM | Units | Dist |
|---|---|---|---|---|---|---|---|---|
| 232 E Marengo Ave Unit Na Shafter, CA | 2.0 | 1.0 | 823 | $1,700 | $2.07 | 43d | 1 | 0.50mi |
| 489 W Marengo Ave Unit Na Shafter, CA | 2.0 | 1.0 | 1000 | $1,800 | $1.80 | 43d | 1 | 0.58mi |
| 354 E Euclid Ave Unit 356 Shafter, CA | 2.0 | 1.0 | 781 | $1,350 | $1.73 | 43d | 1 | 0.66mi |
Listing history 8 events
-
2026-05-16historical
-
2026-05-15$280,000
-
2017-01-27soldstatus $127,000
-
2017-01-25soldstatus $127,000 Closed Sale 544-char remark
Show marketing remark (544 chars)
Great investment opportunity to own a Dulpex, in the Peaceful City of Shafter. 3BD+1BA in the front 956 sqft unit, and 2BD+1BA in the 708 sqft back unit. Some recent cosmetic upgrades, such as laminate flooring in both units and some painting in the front unit have been done by seller. Seller has never lived at the property, therefore has never done any major updates. Definitely needs TLC. Property is situated in a great area, across the street from a Park, as well as a super market, not to mention, new nearby shopping Center coming soon.
-
2016-12-13status Pending Sale 544-char remark
Show marketing remark (544 chars)
Great investment opportunity to own a Dulpex, in the Peaceful City of Shafter. 3BD+1BA in the front 956 sqft unit, and 2BD+1BA in the 708 sqft back unit. Some recent cosmetic upgrades, such as laminate flooring in both units and some painting in the front unit have been done by seller. Seller has never lived at the property, therefore has never done any major updates. Definitely needs TLC. Property is situated in a great area, across the street from a Park, as well as a super market, not to mention, new nearby shopping Center coming soon.
-
2016-11-18historical Active Under Contract 544-char remark
Show marketing remark (544 chars)
Great investment opportunity to own a Dulpex, in the Peaceful City of Shafter. 3BD+1BA in the front 956 sqft unit, and 2BD+1BA in the 708 sqft back unit. Some recent cosmetic upgrades, such as laminate flooring in both units and some painting in the front unit have been done by seller. Seller has never lived at the property, therefore has never done any major updates. Definitely needs TLC. Property is situated in a great area, across the street from a Park, as well as a super market, not to mention, new nearby shopping Center coming soon.
-
2016-10-21$149,900 Active 544-char remark
Show marketing remark (544 chars)
Great investment opportunity to own a Dulpex, in the Peaceful City of Shafter. 3BD+1BA in the front 956 sqft unit, and 2BD+1BA in the 708 sqft back unit. Some recent cosmetic upgrades, such as laminate flooring in both units and some painting in the front unit have been done by seller. Seller has never lived at the property, therefore has never done any major updates. Definitely needs TLC. Property is situated in a great area, across the street from a Park, as well as a super market, not to mention, new nearby shopping Center coming soon.
-
1991-01-02soldstatus $55,000
ⓘ Source: listings_history table (triggers on properties + properties_extension) + one-shot
backfill from property_details.listing_events for pre-trigger history.
Tax reassessment forecast CA · Resets to sale price
- Current annual tax
- $2,186 · $182/mo
- Projected year-2 tax
- $2,186 · $182/mo
- Expected delta
- $0/yr ($0/mo · 0.0%)
ⓘ Screening estimate from a state-policy table — verify with the county assessor before closing.
Climate risk First Street
- Flood 1/10 Low FEMA zone X (unshaded) · 0% chance over 30 yrs
- Wildfire 5/10 Major
- Heat 8/10 Severe 7 d/yr ≥105°F today · 19 d/yr by 30 yrs out
- Wind 1/10 Low
- Air quality 10/10 Extreme 23 unhealthy d/yr today · 28 by 30 yrs out
Nearby sold comps map
Loading sold comps map…
Walkable amenities ~0.75 mi
Loading nearby amenities…
Taxation est. · year 1
- Rental income
- $31,968
- − Mortgage interest
- −$15,684
- − Property taxes
- −$2,186
- − Insurance
- −$1,400
- − Repairs & maintenance
- −$2,557
- − Management
- −$2,557
- − Depreciation
- −$8,145
- Taxable loss
- −$562
- Est. tax savings @ 24.0%
- +$135
- After-tax cash flow
- $4,184/yr
For passive investors: Depreciation is non-cash, so a rental often shows a tax loss while cash-flowing — sheltering income. Rental losses are passive: they offset passive income freely, and up to $25,000/yr can offset ordinary (W-2) income if you actively participate and your MAGI is under $100k (phasing out to $0 by $150k); unused losses carry forward. On sale, claimed depreciation is recaptured at up to 25%, and gains may owe capital-gains tax (a 1031 exchange can defer both). Figures are a year-1 estimate at your 24.0% rate — not tax advice; consult a CPA.
Schools (NCES district)
- District
- Richland Union Elementary
- NCES district ID
- 0621450
- Math proficiency
- 11% ▼ -15.00%
- Reading proficiency
- 24% ▼ -10.00%
- Median HH income
- $39,624
- Composite
- 14.8/100
- National rank
- #9386
- State rank
- #480 of 517 in CA
Livability — Shafter
- Score
- 72/100
- State rank
- #185
- US rank
- #6066
Category grades
Schools grade is shown separately in the Schools card above.
Census & demographics
- Census place
- Shafter, CA
- City population
- 23,423
- Population (ZIP)
- 23,423
Population outlook (Kern County) Hauer SSP2
- Today (2025)
- 947,286 people
- By 2030
- 978,984 · +3.3%
- By 2040
- 1,045,018 · +10.3%
- By 2050
- 1,105,232 · +16.7%
- By 2075
- 1,229,538 · +29.8%
- By 2100
- 1,238,059 · +30.7%
Race, ethnicity, and origin ACS 2023
- Neighborhood character
- Predominantly Hispanic (80%)
- Race & ethnicity
- Hispanic / Latino 80% Two or more races 35% White 17% Native American 1% Black 1% Asian 1%
- Hispanic origin (detail)
- Mexican 75% Puerto Rican 1%
- Common ancestry
- Italian 0%
- Foreign-born
- 25% · Canada
- Languages at home
- 42% English-only · Spanish 56% Arabic 1%
Political lean MEDSL · Kern
- 2024 margin
- Strong R (+21.1) · D 38.2% · R 59.3% · Other 2.5%
- 2008→2024 swing
- -3.3pp toward R · 2008: -17.8pp · 2024: -21.1pp
- All cycles
- 2024: R+21.1 2020: R+10.2 2016: R+15.0 2012: R+20.9 2008: R+17.8
Not yet ingested
- Civics
- —
Market trends
- HPI YoY
- ▼ -53.09%
- Current HPI
- 352.9878
- Rent YoY
- —
- Metro
- —
- State GDP YoY
- ▲ 3.21%
- F500 in state
- 116
Industry mix (Fortune 500 HQ in CA)
| Industry | F500 HQs | Revenue |
|---|---|---|
| Technology | 27 | $1,492B |
|
||
| Financial Services | 3 | $174B |
|
||
| Retail | 3 | $44B |
|
||
| Insurance | 3 | $26B |
|
||
| Media / Entertainment | 2 | $115B |
|
||
| Pharmaceuticals / Biotech | 2 | $62B |
|
||
Price history
+409.1% since first listed8 events — show timeline
- 2026-05-16 Delisted — GEMLS
- 2026-05-15 Listed $280,000 GEMLS
- 2017-01-27 Sold (Public Records) $127,000 Public Records
- 2017-01-25 Sold (MLS) $127,000 CRMLS
- 2016-12-13 Pending — CRMLS
- 2016-11-18 Contingent — CRMLS
- 2016-10-21 Listed $149,900 CRMLS
- 1991-01-02 Sold (Public Records) $55,000 Public Records
Property tax history
+8.0%/yrLatest (2025): $2,186 · +1.8% YoY. Source: county tax records.
Cash-flow waterfall
monthlySold comps — $/sqft
last 12 mo · ≤1 miLoading sold comps…