 Duplex
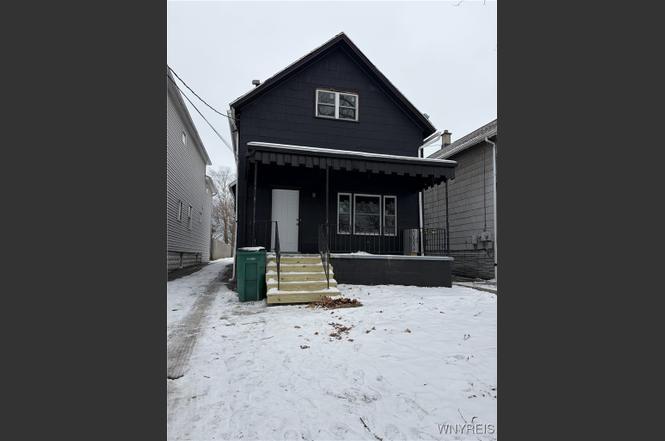
30 N Ogden St · Buffalo, NY
Flood risk 4/10 · Minor
- FEMA flood zone
- X (unshaded)
- Chance of flooding over 30 yrs
- 0.22%
- Est. flood insurance / yr
- $473 – $860
Fire risk 1/10 · Minimal
- Est. fire insurance / yr
- $691 – $1,283
Heat risk 3/10 · Minor
- Hot days now (above 92°F)
- 7 days/yr
- Hot days in 30 yrs
- 15 days/yr
Wind risk 1/10 · Minimal
- Chance of severe wind over 30 yrs
- —
Air-quality risk 3/10 · Minor
- Unhealthy air days now
- 2 days/yr
- Unhealthy air days in 30 yrs
- 3 days/yr
Risk factors via First Street. Map © Google.
Why this score? — see what drove the B- grade
The composite is a weighted blend of 9 inputs, each scored 0–100. Each bar is that input's sub-score; the figure is the points it added to the 100-point composite (weight × sub-score).
- Cash flow +27.6/30.0
- DSCR +9.7/10.0
- Appreciation +9.0/10.0
- 1% rule +7.5/10.0
- Livability +3.9/5.0
- Schools +3.3/10.0
- Rent growth +2.5/5.0
- Condition / age +2.5/5.0
- ARV discount +1.5/15.0
$168,900
🖨 Deal sheet (PDF) 📄 Offer letter ✓ Due diligence
Multi-family units
County records classify this as Multi-Family (2-4 Unit). Listing-text estimate: 2 units. confirmed
Listing remarks MLS
EXCELLENT OPPORTUNITY! 2/2 FRONT TO REAR DUPLEX. 2 BEDROOM 1.5 BATH IN FRONT, 2 BEDROOM , 2 BATH REAR. NEW ROOF. NEW FURNACE, UPDATED PLUMBING AND ELECTRICAL. USED TO BE OWNER OCCUPIED, NOW HAS LONG TERM TENANTS. EXCELLENT RENTS.
Key facts
- 4,050 sq ft lot
- 2 parking spots
- Built 1901
Neighborhood map
What this means for you Summary
Snapshot
- This is a 2 × 2-bed/2.0-bath units multifamily listed at $169k.
Deal economics
- At list price, monthly cash flow is $502 ($6k/yr) — positive. Per door: $251/mo.
- The deal already cash-flows at list — no discount required.
- Meets the 1% rule at list price ($2k rent vs $169k).
- Recommended offer: $164k (3.0% below list) — sets the bar for market timing.
- Cap rate 9.9% vs local median 8.0% in Buffalo — meaningfully above typical; check what's discounted (condition, days-on-market, listing class) to confirm the premium yield is real.
Location & tenants
- Location reads 77/100 on livability (#195 in NY, #3,011 nationally) — a middle-class / working-renter tenant base. Strengths: commute A+, housing A+, health & safety A+; Watch: crime F, employment D-.
- Buffalo City School District (urban): math 41% / reading 40% proficiency, ranked #535 of 590 in NY (top 91%) — families likely to look elsewhere, expect single-tenant / working-renter base with shorter leases; 75% free/reduced lunch — lower-income household profile, screen leases tightly.
- Zoned schools: International School (math 8% / reading 17%, grade F, #2,048 of 2,108 statewide, top 97%, 981 students, 92% FRL); Hutchinson Central Technical High School (math 96% / reading 32%, grade B-, #807 of 1,100 statewide, top 73%, 1,175 students, 78% FRL).
- Market conditions: 170 active listings in the ZIP; 3 comparable units currently listed for rent nearby; rentals leasing fast (median 12d on market — plan ~1-2 weeks tenant-placement turnaround); 1,244 units permitted in Erie County in 2024 (563 in 5+ unit buildings).
- At $2,113/mo this rent would consume 50% of the median local household income ($50k/yr) (locally 841% of renters already pay >50% of income on rent) — very limited rent-growth headroom before tenants either downsize or default.
Forward outlook
- In year one you build about $15k of equity ($1k loan paydown + $14k appreciation (8.1% local appreciation)).
- At projected returns (8.1% appreciation + 3.0% rent growth), your $47k cash investment doubles in ~3 years — after that, you're playing with house money.
- By year 3, paydown + projected appreciation supports a ~$37k cash-out refi (75% LTV) — recoverable capital for the next deal without selling this one.
Negotiation context
- It's been on market 55 days — a 3% lower offer ($164k) is reasonable based on typical stale-listing flexibility.
- 2 sale attempts since 15y ago with the ask held roughly flat each time — persistent listings suggest the price (not the market) is what's stuck; bring a comps-based counter.
- Current owner paid $34k; list at $169k implies a 397% gain — meaningful room to come down on a strong offer.
Risks & watch-outs
- Watch-outs: built in 1901 — expect roof / HVAC / electrical / plumbing capex.
Questions for the listing agent
- It's been on market 55 days. Have you received any prior offers? Is the seller open to a 3% concession, seller financing, or rate buy-down credit?
- Can we see the unit-by-unit rent roll, current vacancy, and any below-market leases? What's the average tenancy length?
- What capital expenditures (roof, boiler, parking lot, exteriors) have been made in the last 5 years, and what's planned in the next 2?
- Built in 1901 — when were the roof, HVAC, electrical panel, plumbing, and water heater last replaced?
- Is there a deadline driving the sale (1031 exchange, divorce, estate, relocation)? That informs how much negotiation room exists.
- Crime grade is F in this area — have there been break-ins, vandalism, or insurance claims at this property in the last 3 years? What carrier currently insures it and at what premium?
- What's the average days-on-market for RENTAL listings here right now (not sales)? A rising rental-DOM trend means longer vacancies and softer asking-rent achievability than the comps imply.
- What's the recent tenant-quality profile in this submarket — average credit score on applications, eviction rate, late-payment / NSF rate, and stable-employment percentage? A property-management company in the area should have these aggregated.
- How much new apartment / multifamily construction is in the pipeline within 1–3 miles? Heavy new supply (>2% of stock underway) typically softens rents 12–24 months out; light construction supports rent growth.
Investment metrics
- 1% rule
- 1.25% ✓
- Cap rate
- 9.86%
- Cash-on-cash
- 12.74%
- DSCR
- 1.57
- GRM
- 6.7
CMA / ARV
- ARV (on-the-fly)
- $149,100
- Comps found
- 12
Show comp detail 12 sales within ~0.75 mi
| Address | Dist | Beds/Ba | Sqft | Sold | Price | $/sf | Match |
|---|---|---|---|---|---|---|---|
| 30 N Ogden St | 0.00mi | 4/4.0 | 1,775 (0%) | 3mo | $157,000 | $88 | 98 |
| 34 Schiller St | 0.07mi | 4/2.0 | 1,670 (-6%) | 8mo | $95,000 | $57 | 72 |
| 33 Schiller St | 0.10mi | 4/2.0 | 1,922 (+8%) | 5mo | $60,000 | $31 | 70 |
| 293 Ludington St | 0.11mi | 3/2.0 (-1) | 1,688 (-5%) | 10mo | $205,000 | $121 | 66 |
| 187 Goethe St | 0.37mi | 4/2.0 | 1,890 (+6%) | 12mo | $77,000 | $41 | 54 |
| 238 Schiller St | 0.41mi | 4/2.0 | 1,894 (+7%) | 12mo | $145,000 | $77 | 52 |
| 115 Greene St | 0.38mi | 5/3.0 (+1) | 1,968 (+11%) | 6mo | $165,000 | $84 | 51 |
| 108 Moreland St | 0.51mi | 4/2.0 | 1,856 (+5%) | 12mo | $205,000 | $110 | 51 |
| 1068 E Lovejoy St | 0.44mi | 3/2.0 (-1) | 1,661 (-6%) | 7mo | $135,000 | $81 | 50 |
| 250 Gold St | 0.43mi | 5/2.0 (+1) | 1,646 (-7%) | 12mo | $190,000 | $115 | 44 |
| 1362 Bailey Ave | 0.72mi | 4/2.0 | 1,892 (+7%) | 5mo | $197,081 | $104 | 43 |
| 362 Davey St | 0.64mi | 5/2.0 (+1) | 1,640 (-8%) | 2mo | $92,000 | $56 | 43 |
Match score weights: distance 35% · size 25% · config 20% · recency 20%. Top-matched comps best support the ARV.
Projected returns pro-forma
8.06% appreciation · 3.0% rent growth · sell at horizon
- IRR
- 30.0%
- Equity multiple
- 3.16×
- Total profit
- $102,215
- Equity at exit
- $128,989
- IRR
- 26.8%
- Equity multiple
- 6.77×
- Total profit
- $272,898
- Equity at exit
- $256,685
Cash invested: $47,292 (down + closing). Projections, not guarantees.
Landlord ↔ Tenant lean methodology
- Overall (STATE)
- 15 Strongly Tenant-Friendly
- State New York
- 15 Strongly Tenant-Friendly · D+10
- County
- — inherits STATE
- City
- — inherits STATE
ZIP-level market 14206
- Home prices YoY
- 1.8%
- Active inventory
- 170
- Price-to-rent
- 13.3×
Monthly cashflow live
- Estimated rent
- $2,113 medium interval (Pro) →
- Mortgage (P&I)
- −$886
- Tax est. 1.5%
- −$211 /mo · $2,534/yr
- Insurance
- −$70
- HOA
- −$0
- Vacancy / Maint / Mgmt
- −$444
- Net cashflow
- $502
Break-even live
Sensitivity live
| Price | -10% $619 | -5% $560 | +0% $502 | +5% $444 | +10% $385 |
|---|---|---|---|---|---|
| Rent | -10% $335 | -5% $419 | +0% $502 | +5% $586 | +10% $669 |
| Rate | -1.0pp $587 | -0.5pp $545 | base $502 | +0.5pp $458 | +1.0pp $414 |
2-unit breakdown (identical units grouped — click to expand)
| Units | Beds | Baths | Est. rent |
|---|---|---|---|
| 2× units | 2 | 2 | $2,114 |
| #1 | 2 | 2 | $1,057 |
| #2 | 2 | 2 | $1,057 |
| Total (2 units) | $2,113 | ||
UW: 25.0% down · 7.5% · 30yr · 1.5% tax · 5.0% vac · 8.0% maint · 8.0% mgmt
Financing live
Cash to close
- Down payment
- $42,225
- Closing costs
- $5,067
- Reserves months
- —
- Total cash needed
- —
Loan-product check · same deal, 3 products live
Conventional
25% down · 7.5% · 30yr
- Down + closing
- —
- Monthly P&I
- —
- Monthly cashflow
- —
- DSCR
- —
- Eligible?
- —
Personal DTI + credit; lowest rate.
DSCR
20% down · 8.5% · 30yr
- Down + closing
- —
- Monthly P&I
- —
- Monthly cashflow
- —
- DSCR
- —
- Eligible?
- —
No personal income docs; deal must DSCR.
Hard money
10% down · 12.0% · 12mo
- Down + closing
- —
- Monthly P&I
- —
- Monthly cashflow
- —
- DSCR
- —
- Eligible?
- —
Short-term bridge; refi at stabilization.
Rent comps 3 comps
| Address | Beds | Baths | Sqft | Rent | $/sqft | DOM | Units | Dist |
|---|---|---|---|---|---|---|---|---|
| 1777 Broadway Unit 2 Buffalo, NY | 3.0 | 1.0 | 1300 | $1,200 | $0.92 | 45d | 1 | 0.84mi |
| 14 Rutland Ave Buffalo, NY | 4.0 | 1.0 | 1430 | $2,200 | $1.54 | 12d | 1 | 1.09mi |
| 979 Walden Ave Buffalo, NY | 4.0 | 3.0 | 1793 | $2,000 | $1.12 | 3d | 1 | 1.43mi |
Listing history 5 events
-
2026-02-04status Pending
-
2026-01-06price $168,900
-
2025-12-11$169,900 Active
-
2012-01-31soldstatus $34,000 229-char remark
Show marketing remark (229 chars)
EXCELLENT OPPORTUNITY! 2/2 FRONT TO REAR DUPLEX. 2 BEDROOM 1.5 BATH IN FRONT, 2 BEDROOM , 2 BATH REAR. NEW ROOF. NEW FURNACE, UPDATED PLUMBING AND ELECTRICAL. USED TO BE OWNER OCCUPIED, NOW HAS LONG TERM TENANTS. EXCELLENT RENTS.
-
2011-09-09$39,900 229-char remark
Show marketing remark (229 chars)
EXCELLENT OPPORTUNITY! 2/2 FRONT TO REAR DUPLEX. 2 BEDROOM 1.5 BATH IN FRONT, 2 BEDROOM , 2 BATH REAR. NEW ROOF. NEW FURNACE, UPDATED PLUMBING AND ELECTRICAL. USED TO BE OWNER OCCUPIED, NOW HAS LONG TERM TENANTS. EXCELLENT RENTS.
ⓘ Source: listings_history table (triggers on properties + properties_extension) + one-shot
backfill from property_details.listing_events for pre-trigger history.
Climate risk First Street
- Flood 4/10 Moderate FEMA zone X (unshaded) · 22% chance over 30 yrs
- Wildfire 1/10 Low
- Heat 3/10 Moderate 7 d/yr ≥92°F today · 15 d/yr by 30 yrs out
- Wind 1/10 Low
- Air quality 3/10 Moderate 2 unhealthy d/yr today · 3 by 30 yrs out
Nearby sold comps map
Loading sold comps map…
Walkable amenities ~0.75 mi
Loading nearby amenities…
Taxation est. · year 1
- Rental income
- $25,356
- − Mortgage interest
- −$9,461
- − Property taxes
- −$2,534
- − Insurance
- −$844
- − Repairs & maintenance
- −$2,028
- − Management
- −$2,028
- − Depreciation
- −$4,913
- Taxable income
- $3,547
- Est. tax owed @ 24.0%
- −$851
- After-tax cash flow
- $5,173/yr
For passive investors: Depreciation is non-cash, so a rental often shows a tax loss while cash-flowing — sheltering income. Rental losses are passive: they offset passive income freely, and up to $25,000/yr can offset ordinary (W-2) income if you actively participate and your MAGI is under $100k (phasing out to $0 by $150k); unused losses carry forward. On sale, claimed depreciation is recaptured at up to 25%, and gains may owe capital-gains tax (a 1031 exchange can defer both). Figures are a year-1 estimate at your 24.0% rate — not tax advice; consult a CPA.
Schools (NCES district)
- District
- Buffalo City School District
- NCES district ID
- 3605850
- Math proficiency
- 41% ▲ 11.00%
- Reading proficiency
- 40% ▲ 7.00%
- Median HH income
- $31,665
- Composite
- 33.17/100
- National rank
- #5544
- State rank
- #535 of 590 in NY
Livability — Buffalo
- Score
- 77/100
- State rank
- #195
- US rank
- #3011
Category grades
Schools grade is shown separately in the Schools card above.
Census & demographics
- Census place
- Buffalo, NY
- County
- Erie County · 714,559 people
- City population
- 440,021
- Metro
- Buffalo-Cheektowaga, NY
- Population (ZIP)
- 21,631
- Household income
- $50,450
- Rent vs Own
- Severe rent burden
- 841.0
Population outlook (Erie County) Hauer SSP2
- Today (2025)
- 933,037 people
- By 2030
- 935,181 · +0.2%
- By 2040
- 928,531 · -0.5%
- By 2050
- 905,725 · -2.9%
- By 2075
- 834,037 · -10.6%
- By 2100
- 708,033 · -24.1%
Race, ethnicity, and origin ACS 2023
- Neighborhood character
- Majority White (65%)
- Race & ethnicity
- White 65% Hispanic / Latino 13% Black 12% Two or more races 8% Asian 4%
- Hispanic origin (detail)
- Mexican 2% Puerto Rican 10%
- Common ancestry
- Romanian 25% Lithuanian 1% Italian 1%
- Foreign-born
- 6% · Canada, China
- Languages at home
- 88% English-only · Spanish 5% Other Indo-European 3% Arabic 2%
Political lean MEDSL · Erie
- 2024 margin
- Lean D (+9.7) · D 54.8% · R 45.2%
- 2008→2024 swing
- -7.9pp toward R · 2008: 17.5pp · 2024: 9.7pp
- All cycles
- 2024: D+9.7 2020: D+14.7 2016: D+4.8 2012: D+15.6 2008: D+17.5
Not yet ingested
- Civics
- —
Market trends
- HPI YoY
- ▲ 8.06%
- Current HPI
- 457.3935
- Rent YoY
- —
- Metro
- Buffalo-Cheektowaga, NY
- State GDP YoY
- ▲ 2.60%
- F500 in state
- 92
Industry mix (Fortune 500 HQ in NY)
| Industry | F500 HQs | Revenue |
|---|---|---|
| Financial Services | 10 | $950B |
|
||
| Consumer Goods | 9 | $162B |
|
||
| Insurance | 4 | $225B |
|
||
| Telecommunications | 2 | $144B |
|
||
| Pharmaceuticals | 2 | $112B |
|
||
| Media / Entertainment | 2 | $69B |
|
||
Price history
+323.3% since first listed5 events — show timeline
- 2026-02-04 Pending — WNYREIS
- 2026-01-06 Price Changed $168,900 WNYREIS
- 2025-12-11 Listed $169,900 WNYREIS
- 2012-01-31 Sold (MLS) $34,000 WNYREIS
- 2011-09-09 Listed $39,900 WNYREIS
Cash-flow waterfall
monthlySold comps — $/sqft
last 12 mo · ≤1 miLoading sold comps…