3512 E Elswood Dr · Idaho Falls, ID
Flood risk 1/10 · Minimal
- FEMA flood zone
- X
- Chance of flooding over 30 yrs
- 0.0%
- Est. flood insurance / yr
- $507 – $1,088
Fire risk 3/10 · Minor
- Est. fire insurance / yr
- $584 – $1,086
Heat risk 3/10 · Minor
- Hot days now (above 91°F)
- 7 days/yr
- Hot days in 30 yrs
- 17 days/yr
Wind risk 1/10 · Minimal
- Chance of severe wind over 30 yrs
- —
Air-quality risk 4/10 · Minor
- Unhealthy air days now
- 5 days/yr
- Unhealthy air days in 30 yrs
- 5 days/yr
Risk factors via First Street. Map © Google.
Why this score? — see what drove the B grade
The composite is a weighted blend of 9 inputs, each scored 0–100. Each bar is that input's sub-score; the figure is the points it added to the 100-point composite (weight × sub-score).
- Cash flow +30.0/30.0
- 1% rule +10.0/10.0
- DSCR +10.0/10.0
- ARV discount +7.5/15.0
- Livability +4.3/5.0
- Schools +3.7/10.0
- Rent growth +3.1/5.0
- Condition / age +2.5/5.0
- Appreciation +0.0/10.0
$55,000
🖨 Deal sheet 📄 Offer letter ✓ Due diligence
Listing remarks MLS
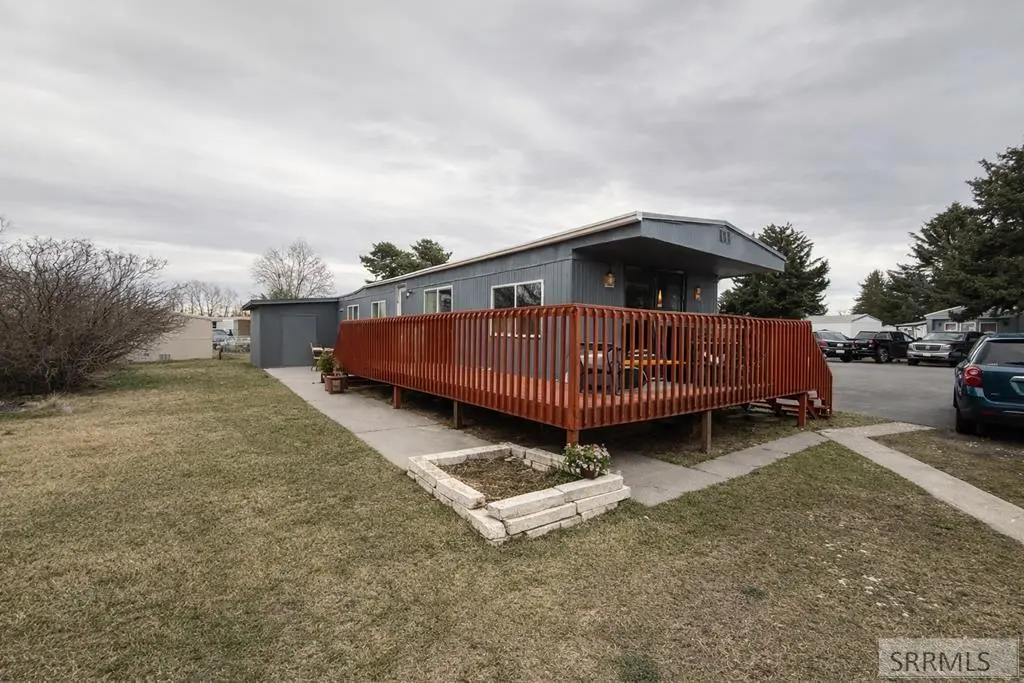
UPDATED INTERIOR WITH WINDOWS, CABINETS, COUNTER TOPS, APPLIANCES, AND SOME FLOORING. OUTSIDE UPDATED WRAPAROUND DECK WITH LOTS OF PARKING. THE HOME SITS ON A RENTED LOT IN SUNNYSIDE ACRES. LOT RENT IS $295.OO IT COVERS WATER, SEWER, AND GARBAGE.
Key facts
- Outdoor recreation
- Greenbelt
- Wraparound deck
Tags
Property features AI
Exterior
- Parking: Attached garage (1 car)
- Utilities: Public water; Public sewer
- Home design: Manufactured home; Single-story
- Construction: Metal siding construction
- Exterior features: Rubber roof; Shed(s) on the property
Interior
- Kitchen: Refrigerator
- Flooring: Vinyl flooring; Other flooring
- Bathrooms: One full bathroom
- Heating & cooling: Electric forced air heating
- Interior features: Refrigerator; Washer
- Laundry & utility: Washer
Neighborhood map
What this means for you Summary
Snapshot
- This is a ?-bed/1.0-bath manufactured listed at $55k.
Deal economics
- At list price, monthly cash flow is $479 ($6k/yr) — positive.
- The deal already cash-flows at list — no discount required.
- Meets the 1% rule at list price ($1k rent vs $55k).
- Recommended offer: $53k (3.0% below list) — sets the bar for market timing.
Location & tenants
- Location reads 86/100 on livability (#3 in ID, #428 nationally) — a professional / high-income tenant draw. Strengths: amenities A+, cost of living A+, housing A+.
- Idaho Falls District (urban): math 36% / reading 50% proficiency, ranked #54 of 92 in ID (top 59%) — families likely to look elsewhere, expect single-tenant / working-renter base with shorter leases.
- Market conditions: Rents rising (+2.6%/yr); 275 active listings in the ZIP; 2,253 units permitted in Bonneville County in 2024 (1,051 in 5+ unit buildings).
- This rent is only 16% of the median local income ($75k/yr) — well below the 30% rent-burden line; pricing power to push rent on renewal without tenant pushback.
Forward outlook
- Local home prices are declining (-3.0%/yr); year-one equity from $380 of loan paydown is wiped out by about $2k of value loss. Plan a longer hold.
- Bonneville County population projected at +18% by 2050 — long-run rental-demand tailwind backs the buy-and-hold thesis.
- At projected returns (-3.0% appreciation + 2.6% rent growth), your $15k cash investment doubles in ~4 years — after that, you're playing with house money.
Negotiation context
- It's been on market 53 days — a 3% lower offer ($53k) is reasonable based on typical stale-listing flexibility.
- 3 sale attempts since 8y ago with the ask held roughly flat each time — persistent listings suggest the price (not the market) is what's stuck; bring a comps-based counter.
Questions for the listing agent
- It's been on market 53 days. Have you received any prior offers? Is the seller open to a 3% concession, seller financing, or rate buy-down credit?
- Built in 1974 — when were the roof, HVAC, electrical panel, plumbing, and water heater last replaced?
- Is there a deadline driving the sale (1031 exchange, divorce, estate, relocation)? That informs how much negotiation room exists.
- What's the average days-on-market for RENTAL listings here right now (not sales)? A rising rental-DOM trend means longer vacancies and softer asking-rent achievability than the comps imply.
- What's the recent tenant-quality profile in this submarket — average credit score on applications, eviction rate, late-payment / NSF rate, and stable-employment percentage? A property-management company in the area should have these aggregated.
- How much new for-sale + rental construction is in the pipeline within 1–3 miles? Heavy new supply typically softens prices + rents 12–24 months out; constrained supply supports both.
Investment metrics
- 1% rule
- 1.84% ✓
- Cap rate
- 16.73%
- Cash-on-cash
- 37.29%
- DSCR
- 2.66
- GRM
- 4.5
CMA / ARV
No comps found within radius.
Projected returns pro-forma
-3.0% appreciation · 2.57% rent growth · sell at horizon
- IRR
- 32.7%
- Equity multiple
- 2.37×
- Total profit
- $21,107
- Equity at exit
- $8,201
- IRR
- 39.5%
- Equity multiple
- 4.62×
- Total profit
- $55,765
- Equity at exit
- $4,755
Cash invested: $15,400 (down + closing). Projections, not guarantees.
Landlord ↔ Tenant lean methodology
- Overall (STATE)
- 91 Strongly Landlord-Friendly
- State Idaho
- 91 Strongly Landlord-Friendly · R+18
- County
- — inherits STATE
- City
- — inherits STATE
ZIP-level market 83402
- Rents YoY
- 2.6%
- Active inventory
- 275
- Price-to-rent
- 4.5×
Monthly cashflow live
- Estimated rent
- $1,014 medium interval (Pro) →
- Mortgage (P&I)
- −$288
- Tax from tax record
- −$11 /mo · $132/yr
- Insurance
- −$23
- HOA
- −$0
- Vacancy / Maint / Mgmt
- −$213
- Net cashflow
- $479
Break-even live
UW: 25.0% down · 7.5% · 30yr · 1.5% tax · 5.0% vac · 8.0% maint · 8.0% mgmt
Financing live
Cash to close
- Down payment
- $13,750
- Closing costs
- $1,650
- Reserves months
- —
- Total cash needed
- —
Loan-product check · same deal, 3 products live
Conventional
25% down · 7.5% · 30yr
- Down + closing
- —
- Monthly P&I
- —
- Monthly cashflow
- —
- DSCR
- —
- Eligible?
- —
Personal DTI + credit; lowest rate.
DSCR
20% down · 8.5% · 30yr
- Down + closing
- —
- Monthly P&I
- —
- Monthly cashflow
- —
- DSCR
- —
- Eligible?
- —
No personal income docs; deal must DSCR.
Hard money
10% down · 12.0% · 12mo
- Down + closing
- —
- Monthly P&I
- —
- Monthly cashflow
- —
- DSCR
- —
- Eligible?
- —
Short-term bridge; refi at stabilization.
Listing history 6 events
-
2026-05-18status Pending
-
2026-04-06status Active
-
2026-03-29status Pending
-
2026-03-17$55,000 Active
-
2018-11-01soldstatus 248-char remark
Show marketing remark (248 chars)
UPDATED INTERIOR WITH WINDOWS, CABINETS, COUNTER TOPS, APPLIANCES, AND SOME FLOORING. OUTSIDE UPDATED WRAPAROUND DECK WITH LOTS OF PARKING. THE HOME SITS ON A RENTED LOT IN SUNNYSIDE ACRES. LOT RENT IS $295.OO IT COVERS WATER, SEWER, AND GARBAGE.
-
2018-07-20$29,500 248-char remark
Show marketing remark (248 chars)
UPDATED INTERIOR WITH WINDOWS, CABINETS, COUNTER TOPS, APPLIANCES, AND SOME FLOORING. OUTSIDE UPDATED WRAPAROUND DECK WITH LOTS OF PARKING. THE HOME SITS ON A RENTED LOT IN SUNNYSIDE ACRES. LOT RENT IS $295.OO IT COVERS WATER, SEWER, AND GARBAGE.
ⓘ Source: listings_history table (triggers on properties + properties_extension) + one-shot
backfill from property_details.listing_events for pre-trigger history.
Tax reassessment forecast ID · Resets to sale price
- Current annual tax
- $132 · $11/mo
- Projected year-2 tax
- $380 · $32/mo
- Expected delta
- +$248/yr (+$21/mo · 187.5%)
ⓘ Screening estimate from a state-policy table — verify with the county assessor before closing.
Climate risk First Street
- Flood 1/10 Low FEMA zone X · 0% chance over 30 yrs
- Wildfire 3/10 Moderate
- Heat 3/10 Moderate 7 d/yr ≥91°F today · 17 d/yr by 30 yrs out
- Wind 1/10 Low
- Air quality 4/10 Moderate 5 unhealthy d/yr today · 5 by 30 yrs out
Nearby sold comps map
Loading sold comps map…
Walkable amenities ~0.75 mi
Loading nearby amenities…
Taxation est. · year 1
- Rental income
- $12,165
- − Mortgage interest
- −$3,081
- − Property taxes
- −$132
- − Insurance
- −$275
- − Repairs & maintenance
- −$973
- − Management
- −$973
- − Depreciation
- −$1,600
- Taxable income
- $5,131
- Est. tax owed @ 24.0%
- −$1,231
- After-tax cash flow
- $4,511/yr
For passive investors: Depreciation is non-cash, so a rental often shows a tax loss while cash-flowing — sheltering income. Rental losses are passive: they offset passive income freely, and up to $25,000/yr can offset ordinary (W-2) income if you actively participate and your MAGI is under $100k (phasing out to $0 by $150k); unused losses carry forward. On sale, claimed depreciation is recaptured at up to 25%, and gains may owe capital-gains tax (a 1031 exchange can defer both). Figures are a year-1 estimate at your 24.0% rate — not tax advice; consult a CPA.
Schools (NCES district)
- District
- Idaho Falls District
- NCES district ID
- 1601530
- Math proficiency
- 36% ▼ -2.00%
- Reading proficiency
- 50% ▲ 1.00%
- Median HH income
- $48,119
- Composite
- 36.75/100
- National rank
- #4581
- State rank
- #54 of 92 in ID
Livability — Idaho Falls
- Score
- 86/100
- State rank
- #3
- US rank
- #428
Category grades
Schools grade is shown separately in the Schools card above.
Census & demographics
- Census place
- Idaho Falls, ID
- County
- Bonneville County · 125,162 people
- City population
- 105,466
- Metro
- Idaho Falls, ID
- Population (ZIP)
- 29,994
- Household income
- $74,517
- Rent vs Own
- Severe rent burden
- 636.0
Population outlook (Bonneville County) Hauer SSP2
- Today (2025)
- 120,170 people
- By 2030
- 124,993 · +4.0%
- By 2040
- 134,091 · +11.6%
- By 2050
- 142,122 · +18.3%
- By 2075
- 157,767 · +31.3%
- By 2100
- 160,316 · +33.4%
Race, ethnicity, and origin ACS 2023
- Neighborhood character
- Predominantly White (76%)
- Race & ethnicity
- White 76% Hispanic / Latino 19% Two or more races 9%
- Hispanic origin (detail)
- Mexican 17%
- Common ancestry
- Italian 3% Slovak 3% Iranian 2%
- Foreign-born
- 4% · Canada
- Languages at home
- 86% English-only · Spanish 12% Other Indo-European 0%
Political lean MEDSL · Bonneville
- 2024 margin
- Solid R (+45.4) · D 25.6% · R 71.0% · Other 3.4%
- 2008→2024 swing
- -2.4pp toward R · 2008: -43.0pp · 2024: -45.4pp
- All cycles
- 2024: R+45.4 2020: R+43.6 2016: R+40.2 2012: R+51.8 2008: R+43.0
Not yet ingested
- Civics
- —
Market trends
- HPI YoY
- ▼ -201.66%
- Current HPI
- 355.2953
- Rent YoY
- ▲ 2.57%
- Metro
- Idaho Falls, ID
- State GDP YoY
- ▲ 4.51%
- F500 in state
- 6
Industry mix (Fortune 500 HQ in ID)
| Industry | F500 HQs | Revenue |
|---|---|---|
| Retail | 1 | $79B |
|
||
| Technology | 1 | $25B |
|
||
| Food / Agriculture | 1 | $6B |
|
||
Price history
+86.4% since first listed6 events — show timeline
- 2026-05-18 Pending — SRMLS
- 2026-04-06 Relisted — SRMLS
- 2026-03-29 Pending — SRMLS
- 2026-03-17 Listed $55,000 SRMLS
- 2018-11-01 Sold (MLS) — SRMLS
- 2018-07-20 Listed $29,500 SRMLS
Cash-flow waterfall
monthlySold comps — $/sqft
last 12 mo · ≤1 miLoading sold comps…