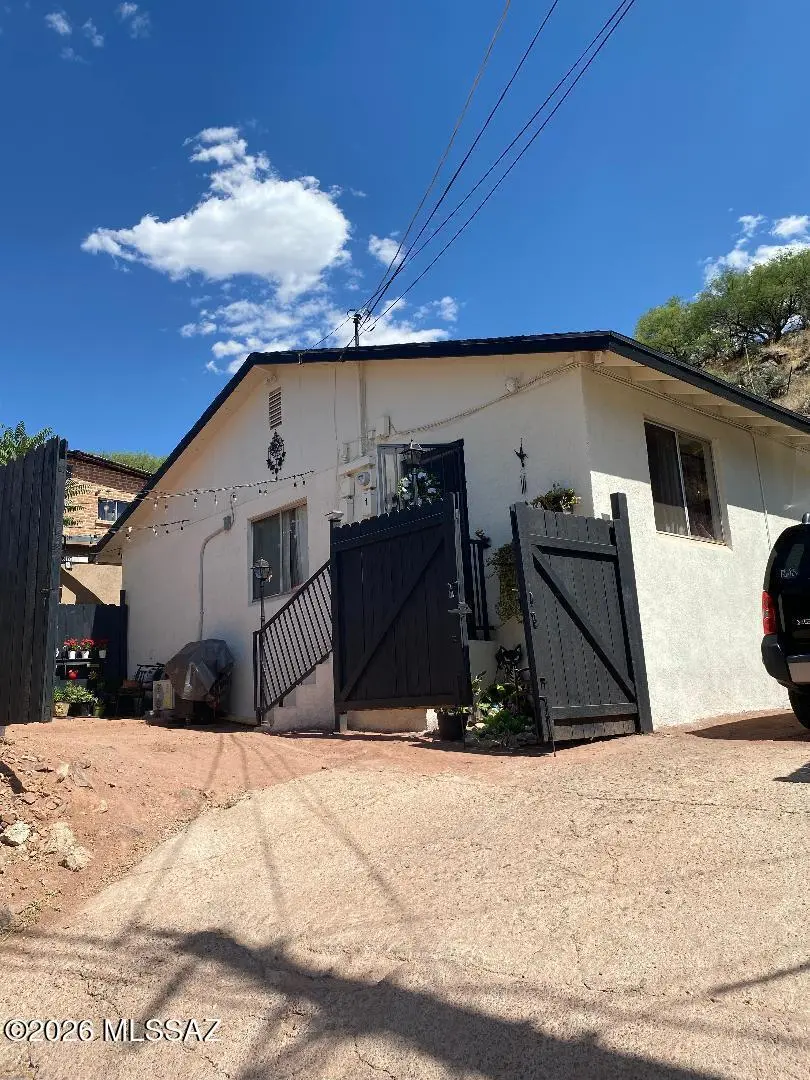
172 E Beck St · Nogales, AZ
Flood risk 5/10 · Moderate
- FEMA flood zone
- X (unshaded)
- Chance of flooding over 30 yrs
- 0.27%
- Est. flood insurance / yr
- $507 – $1,088
Fire risk 7/10 · Major
- Est. fire insurance / yr
- $610 – $1,132
Heat risk 6/10 · Moderate
- Hot days now (above 99°F)
- 6 days/yr
- Hot days in 30 yrs
- 17 days/yr
Wind risk 1/10 · Minimal
- Chance of severe wind over 30 yrs
- —
Air-quality risk 2/10 · Minimal
- Unhealthy air days now
- 1 days/yr
- Unhealthy air days in 30 yrs
- 1 days/yr
Risk factors via First Street. Map © Google.
Why this score? — see what drove the D grade
The composite is a weighted blend of 9 inputs, each scored 0–100. Each bar is that input's sub-score; the figure is the points it added to the 100-point composite (weight × sub-score).
- Cash flow +10.3/30.0
- Appreciation +10.0/10.0
- ARV discount +7.5/15.0
- Livability +3.4/5.0
- DSCR +2.9/10.0
- Rent growth +2.5/5.0
- Condition / age +2.5/5.0
- 1% rule +1.8/10.0
- Schools +1.4/10.0
$230,000
🖨 Deal sheet (PDF) 📄 Offer letter ✓ Due diligence
Listing remarks MLS
This property is a total fixer upper being sold in as is condition
Key facts
- Remodeled
- Centrally located
- Duplex
Tags
Property features AI
Finance
- Other: Zoning: Nogales - MFR1
- Financial info: Financial details not provided
- HOA & community: Street lights
Exterior
- Parking: Parking information not provided
- Security: Smoke detector(s)
- Utilities: Public water; Sewer connected
- Home design: Single family residence; One story
- Construction: Block construction; Shingle roof; Built year not provided
- Exterior features: Patio; Wood fencing; Flower beds; Hillside lot; Paved city-maintained road
Interior
- Kitchen: Gas range
- Bedrooms: Bedrooms information not provided
- Flooring: Laminate flooring
- Bathrooms: 3 full bathrooms
- Heating & cooling: Mini-split heating; Wall cooling units; Ceiling fans pre-wired
- Interior features: Kitchen island; Walk-in closets; Smoke detectors
- Laundry & utility: Laundry closet
Neighborhood map
What this means for you Summary
Snapshot
- This is a 4-bed/3.0-bath single-family listed at $230k.
Deal economics
- At list price, monthly cash flow is $-127 ($-2k/yr) — negative.
- To cash-flow at today's rent, offer at most $207k (9.8% below list).
- To meet the 1% rule (rent ≥ 1% of price), the offer needs to be $156k (32.0% below list).
- Recommended offer: $156k (32.0% below list) — sets the bar for 1% rule.
- Cap rate 5.6% vs local median 3.4% in Nogales — top-decile yield for the area; either an underpriced asset or a hidden risk that comps aren't pricing in. Stress-test before assuming the spread holds.
Location & tenants
- Location reads 68/100 on livability (#59 in AZ) — a middle-class / working-renter tenant base. Strengths: cost of living A+, health & safety A+, housing B; Watch: crime D+, amenities D-, commute F.
- Nogales Unified District (4457) (town): math 12% / reading 23% proficiency, ranked #207 of 249 in AZ (top 83%) — low school quality limits family demand, transient renter base, plan for 1-2y turnover.
- Zoned schools: Lincoln Elementary School (math 12% / reading 22%, grade F, #814 of 1,109 statewide, top 76%, 438 students, 94% FRL); Wade Carpenter Middle School (math 7% / reading 15%, grade F, #183 of 218 statewide, top 85%, 576 students, 94% FRL); Nogales High School (math 13% / reading 19%, grade F, #258 of 381 statewide, top 68%, 1,796 students, 70% FRL) — zoned schools average 86% FRL vs 55% district-wide (31 pts higher); higher-poverty schools than district average — tighter screening recommended.
- Market conditions: 73 active listings in the ZIP; 340 units permitted in Santa Cruz County in 2024 (0 in 5+ unit buildings).
Forward outlook
- In year one you build about $25k of equity ($2k loan paydown + $23k appreciation (10.0% local appreciation)).
- Santa Cruz County population projected at -22% by 2050 — secular population decline; favor cash flow + early exit over multi-decade hold.
- By year 2, paydown + projected appreciation supports a ~$40k cash-out refi (75% LTV) — recoverable capital for the next deal without selling this one.
Negotiation context
- Only 13 days on market — expect competitive offers; lowballing is unlikely to land.
- 2 sale attempts since 2y ago with the ask held roughly flat each time — persistent listings suggest the price (not the market) is what's stuck; bring a comps-based counter.
- Current owner paid $70k; list at $230k implies a 229% gain — meaningful room to come down on a strong offer.
Risks & watch-outs
- Climate carrying-cost: moderate flood risk; major wildfire risk; extreme-heat days projected 6→17/yr by 2055 (HVAC capex compounding) — expect insurance premiums to compound above CPI over the hold.
Questions for the listing agent
- What do current leases actually rent for vs. the listed asking? Can we see a recent rent roll and the last 12 months of T-12 income?
- Built in 1972 — when were the roof, HVAC, electrical panel, plumbing, and water heater last replaced?
- Is there a deadline driving the sale (1031 exchange, divorce, estate, relocation)? That informs how much negotiation room exists.
- Schools are D-rated, which usually means shorter tenancies and higher turnover. Who's the typical renter profile here, and what's been the actual vacancy rate?
- Crime grade is D in this area — have there been break-ins, vandalism, or insurance claims at this property in the last 3 years? What carrier currently insures it and at what premium?
- The area grade is low — what's the realistic commute time and amenity access for the typical tenant pool here? Any planned neighborhood developments (good or bad) we should know about?
- What's the average days-on-market for RENTAL listings here right now (not sales)? A rising rental-DOM trend means longer vacancies and softer asking-rent achievability than the comps imply.
- What's the recent tenant-quality profile in this submarket — average credit score on applications, eviction rate, late-payment / NSF rate, and stable-employment percentage? A property-management company in the area should have these aggregated.
- How much new for-sale + rental construction is in the pipeline within 1–3 miles? Heavy new supply typically softens prices + rents 12–24 months out; constrained supply supports both.
Investment metrics
- 1% rule
- 0.68% ✗
- Cap rate
- 5.63%
- Cash-on-cash
- -2.37%
- DSCR
- 0.89
- GRM
- 12.3
CMA / ARV
- ARV (on-the-fly)
- $125,664
- Comps found
- 4
Show comp detail 4 sales within ~0.75 mi
| Address | Dist | Beds/Ba | Sqft | Sold | Price | $/sf | Match |
|---|---|---|---|---|---|---|---|
| 162 E Beck St | 0.02mi | 4/2.0 | 1,400 (-6%) | 21mo | $117,500 | $84 | 67 |
| 211 E Hudgins St | 0.04mi | 3/2.0 (-1) | 1,328 (-11%) | 10mo | $66,675 | $50 | 62 |
| 718 N Perkins Ave | 0.72mi | 3/2.0 (-1) | 1,704 (+14%) | 19mo | $145,000 | $85 | 19 |
| 373 W Ellis St | 0.71mi | 3/1.0 (-1) | 1,695 (+13%) | 17mo | $140,000 | $83 | 17 |
Match score weights: distance 35% · size 25% · config 20% · recency 20%. Top-matched comps best support the ARV.
Projected returns pro-forma
10.0% appreciation · 3.0% rent growth · sell at horizon
- IRR
- 22.6%
- Equity multiple
- 2.82×
- Total profit
- $117,034
- Equity at exit
- $207,202
- IRR
- 20.2%
- Equity multiple
- 6.45×
- Total profit
- $350,795
- Equity at exit
- $446,839
Cash invested: $64,400 (down + closing). Projections, not guarantees.
Landlord ↔ Tenant lean methodology
- Overall (STATE)
- 87 Strongly Landlord-Friendly
- State Arizona
- 87 Strongly Landlord-Friendly · R+3
- County
- — inherits STATE
- City
- — inherits STATE
ZIP-level market 85621
- Home prices YoY
- 16.5%
- Active inventory
- 73
- Price-to-rent
- 12.3×
Monthly cashflow live
- Estimated rent
- $1,563 medium interval (Pro) →
- Mortgage (P&I)
- −$1,206
- Tax from tax record
- −$60 /mo · $725/yr
- Insurance
- −$96
- HOA
- −$0
- Vacancy / Maint / Mgmt
- −$328
- Net cashflow
- $-127
Break-even live
Sensitivity live
| Price | -10% $3 | -5% $-62 | +0% $-127 | +5% $-193 | +10% $-258 |
|---|---|---|---|---|---|
| Rent | -10% $-251 | -5% $-189 | +0% $-127 | +5% $-66 | +10% $-4 |
| Rate | -1.0pp $-12 | -0.5pp $-69 | base $-127 | +0.5pp $-187 | +1.0pp $-248 |
UW: 25.0% down · 7.5% · 30yr · 1.5% tax · 5.0% vac · 8.0% maint · 8.0% mgmt
Financing live
Cash to close
- Down payment
- $57,500
- Closing costs
- $6,900
- Reserves months
- —
- Total cash needed
- —
Loan-product check · same deal, 3 products live
Conventional
25% down · 7.5% · 30yr
- Down + closing
- —
- Monthly P&I
- —
- Monthly cashflow
- —
- DSCR
- —
- Eligible?
- —
Personal DTI + credit; lowest rate.
DSCR
20% down · 8.5% · 30yr
- Down + closing
- —
- Monthly P&I
- —
- Monthly cashflow
- —
- DSCR
- —
- Eligible?
- —
No personal income docs; deal must DSCR.
Hard money
10% down · 12.0% · 12mo
- Down + closing
- —
- Monthly P&I
- —
- Monthly cashflow
- —
- DSCR
- —
- Eligible?
- —
Short-term bridge; refi at stabilization.
Listing history 10 events
-
2026-06-21days on market $230,000 Active 13 DOM
-
2026-06-19days on market $230,000 Active 11 DOM
-
2026-06-18days on market $230,000 Active 10 DOM
-
2026-06-17days on market $230,000 Active 9 DOM
-
2026-06-16days on market $230,000 Active 8 DOM
-
2026-06-15days on market $230,000 Active 7 DOM
-
2026-06-14days on market $230,000 Active 5 DOM
-
2026-06-12days on market $230,000 Active 4 DOM
-
2026-06-09remarks 59-char remark
-
2026-06-09$230,000 Active 1 DOM
ⓘ Source: listings_history table (triggers on properties + properties_extension) + one-shot
backfill from property_details.listing_events for pre-trigger history.
Tax reassessment forecast AZ · Resets to sale price
- Current annual tax
- $725 · $60/mo
- Projected year-2 tax
- $1,518 · $126/mo
- Expected delta
- +$793/yr (+$66/mo · 109.4%)
ⓘ Screening estimate from a state-policy table — verify with the county assessor before closing.
Climate risk First Street
- Flood 5/10 Major FEMA zone X (unshaded) · 27% chance over 30 yrs
- Wildfire 7/10 Severe
- Heat 6/10 Major 6 d/yr ≥99°F today · 17 d/yr by 30 yrs out
- Wind 1/10 Low
- Air quality 2/10 Low 1 unhealthy d/yr today · 1 by 30 yrs out
Nearby sold comps map
Loading sold comps map…
Walkable amenities ~0.75 mi
Loading nearby amenities…
Taxation est. · year 1
- Rental income
- $18,759
- − Mortgage interest
- −$12,884
- − Property taxes
- −$725
- − Insurance
- −$1,150
- − Repairs & maintenance
- −$1,501
- − Management
- −$1,501
- − Depreciation
- −$6,691
- Taxable loss
- −$5,692
- Est. tax savings @ 24.0%
- +$1,366
- After-tax cash flow
- $-163/yr
For passive investors: Depreciation is non-cash, so a rental often shows a tax loss while cash-flowing — sheltering income. Rental losses are passive: they offset passive income freely, and up to $25,000/yr can offset ordinary (W-2) income if you actively participate and your MAGI is under $100k (phasing out to $0 by $150k); unused losses carry forward. On sale, claimed depreciation is recaptured at up to 25%, and gains may owe capital-gains tax (a 1031 exchange can defer both). Figures are a year-1 estimate at your 24.0% rate — not tax advice; consult a CPA.
Schools (NCES district)
- District
- Nogales Unified District (4457)
- NCES district ID
- 0405530
- Math proficiency
- 12% ▼ -28.00%
- Reading proficiency
- 23% ▼ -15.00%
- Median HH income
- $28,293
- Composite
- 13.72/100
- National rank
- #9494
- State rank
- #207 of 249 in AZ
Livability — Nogales
- Score
- 68/100
- State rank
- #59
- US rank
- #10055
Category grades
Schools grade is shown separately in the Schools card above.
Census & demographics
- Census place
- Nogales, AZ
- Population (ZIP)
- 21,512
Population outlook (Santa Cruz County) Hauer SSP2
- Today (2025)
- 43,796 people
- By 2030
- 42,097 · -3.9%
- By 2040
- 38,235 · -12.7%
- By 2050
- 34,224 · -21.9%
- By 2075
- 26,014 · -40.6%
- By 2100
- 18,165 · -58.5%
Race, ethnicity, and origin ACS 2023
- Neighborhood character
- Predominantly Hispanic (93%)
- Race & ethnicity
- Hispanic / Latino 93% Two or more races 51% White 5%
- Hispanic origin (detail)
- Mexican 91%
- Foreign-born
- 44% · Canada
- Languages at home
- 9% English-only · Spanish 91%
Political lean MEDSL · Santa Cruz
- 2024 margin
- D (+18.6) · D 58.9% · R 40.3%
- 2008→2024 swing
- -12.7pp toward R · 2008: 31.3pp · 2024: 18.6pp
- All cycles
- 2024: D+18.6 2020: D+35.5 2016: D+47.1 2012: D+37.8 2008: D+31.3
Not yet ingested
- Civics
- —
Market trends
- HPI YoY
- ▲ 54.62%
- Current HPI
- 385.6724
- Rent YoY
- —
- Metro
- —
- State GDP YoY
- ▲ 4.54%
- F500 in state
- 20
Industry mix (Fortune 500 HQ in AZ)
| Industry | F500 HQs | Revenue |
|---|---|---|
| Technology | 2 | $13B |
|
||
| Mining / Metals | 1 | $23B |
|
||
| Environmental Services | 1 | $16B |
|
||
| Metals / Steel | 1 | $14B |
|
||
| Technology Distribution | 1 | $9B |
|
||
| Homebuilding | 1 | $8B |
|
||
Price history
+158.4% since first listed5 events — show timeline
- 2026-06-05 Listed $230,000 MLSSAZ
- 2024-03-01 Sold (MLS) $70,000 MLSSAZ
- 2024-02-15 Sold (Public Records) $70,000 Public Records
- 2024-02-04 Contingent — MLSSAZ
- 2024-01-27 Listed $89,000 MLSSAZ
Property tax history
+3.8%/yrLatest (2025): $725 · +269.5% YoY. Source: county tax records.
Cash-flow waterfall
monthlySold comps — $/sqft
last 12 mo · ≤1 miLoading sold comps…