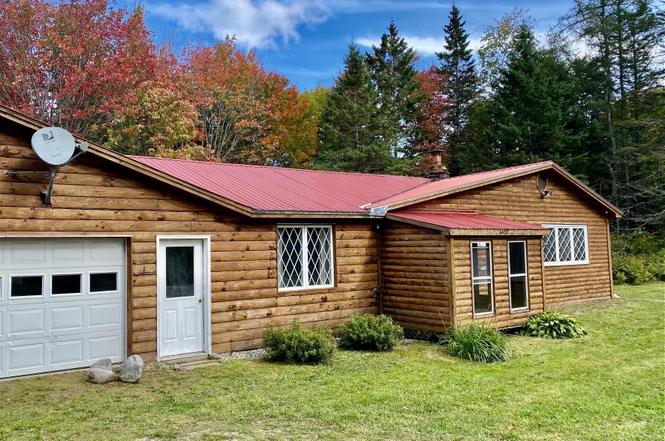
3407 E Haven Rd · Brighton, VT
Flood risk 1/10 · Minimal
- FEMA flood zone
- X
- Chance of flooding over 30 yrs
- 0.0%
- Est. flood insurance / yr
- $473 – $860
Fire risk 1/10 · Minimal
- Est. fire insurance / yr
- $480 – $892
Heat risk 1/10 · Minimal
- Hot days now (above 85°F)
- 7 days/yr
- Hot days in 30 yrs
- 16 days/yr
Wind risk 2/10 · Minimal
- Chance of severe wind over 30 yrs
- 3.0%
Air-quality risk 2/10 · Minimal
- Unhealthy air days now
- 1 days/yr
- Unhealthy air days in 30 yrs
- 1 days/yr
Risk factors via First Street. Map © Google.
Why this score? — see what drove the D+ grade
The composite is a weighted blend of 9 inputs, each scored 0–100. Each bar is that input's sub-score; the figure is the points it added to the 100-point composite (weight × sub-score).
- Cash flow +13.4/30.0
- Appreciation +7.6/10.0
- ARV discount +7.5/15.0
- Schools +5.0/10.0
- DSCR +4.1/10.0
- 1% rule +3.6/10.0
- Rent growth +2.5/5.0
- Livability +2.5/5.0
- Condition / age +2.5/5.0
$189,000
🖨 Deal sheet (PDF) 📄 Offer letter ✓ Due diligence
Listing remarks
Investor opportunity at 3407 East Haven Road in Island Pond. This property is being sold as is and requires work, offering strong potential for renovation, rental, or resale. Set on approximately 2 acres, the 1400 square ft property includes a two-car attached garage and a functional layout with 2 bedrooms 1 bathroom, ready for improvement. Conveniently located near snowmobile trails, Burke Mountain, and Kingdom Trails, 5 miles to the heart of Island Pond with easy access to the many ponds and lakes of the Northeast Kingdom—making it attractive for short-term or long-term rental potential. Motivated sellers. Bring your vision and unlock the value in this well-located property. Being s
Key facts
- 2 acre lot
- 2 garage spots
- Built 1976
Property features AI
Finance
- Other: Furnishings included in sale
Exterior
- Parking: Attached garage with capacity for 2 vehicles; Gravel driveway
- Utilities: Drilled well; Septic system with conventional leach field; 100 Amp electric service; LP/bottle gas available; Telephone service at site; No internet service listed; Local fuel delivered by Freds Energy
- Home design: Ranch-style home; Single-story (main level); Brown exterior
- Construction: Built in 1976; Wood frame construction with log siding; Metal roof
- Exterior features: Level and wooded lot; Near skiing and snowmobile trails; Rural setting; Paved public road frontage
Interior
- Kitchen: Electric range; Refrigerator
- Bedrooms: Two bedrooms, both on the main level
- Flooring: Carpet; Slate/stone; Vinyl
- Bathrooms: One full bathroom
- Heating & cooling: Propane heating; Wood heat; Vented gas heater
- Interior features: Five total rooms; Den; Living room; Kitchen/dining area; Full bathroom
- Laundry & utility: Washer; Dryer; Electric water heater
Neighborhood map
What this means for you Summary
Snapshot
- This is a 2-bed/1.0-bath single-family listed at $189k.
Deal economics
- At list price, monthly cash flow is $5 ($61/yr) — positive.
- The deal already cash-flows at list — no discount required.
- To meet the 1% rule (rent ≥ 1% of price), the offer needs to be $162k (14.2% below list).
- Recommended offer: $162k (14.2% below list) — sets the bar for 1% rule.
Location & tenants
- Location reads: area grade D — affects rentability + tenant quality, not the cash-flow math above.
- Zoned schools: Brighton Elementary School (math 32% / reading 37%, grade F, #123 of 192 statewide, top 66%, 135 students, 62% FRL).
- Market conditions: 17 active listings in the ZIP; 11 units permitted in Essex County in 2024 (0 in 5+ unit buildings).
Forward outlook
- In year one you build about $11k of equity ($1k loan paydown + $10k appreciation (5.3% local appreciation)).
- Essex County population projected at -30% by 2050 — secular population decline; favor cash flow + early exit over multi-decade hold.
- At projected returns (5.3% appreciation + 3.0% rent growth), your $53k cash investment doubles in ~5 years — after that, you're playing with house money.
- By year 4, paydown + projected appreciation supports a ~$38k cash-out refi (75% LTV) — recoverable capital for the next deal without selling this one.
Negotiation context
- It's been on market 149 days — a 12% lower offer ($166k) is reasonable based on typical stale-listing flexibility.
- 3 sale attempts; this cycle's ask has dropped $20k (10%) from the opening price — seller is motivated, your offer sets the floor, not the list.
Questions for the listing agent
- It's been on market 149 days. Have you received any prior offers? Is the seller open to a 14% concession, seller financing, or rate buy-down credit?
- Built in 1976 — when were the roof, HVAC, electrical panel, plumbing, and water heater last replaced?
- Why hasn't it sold? Are there any deal-killer items the seller is aware of (foundation, flood, title, zoning, code violations)?
- Is there a deadline driving the sale (1031 exchange, divorce, estate, relocation)? That informs how much negotiation room exists.
- The area grade is low — what's the realistic commute time and amenity access for the typical tenant pool here? Any planned neighborhood developments (good or bad) we should know about?
- What's the average days-on-market for RENTAL listings here right now (not sales)? A rising rental-DOM trend means longer vacancies and softer asking-rent achievability than the comps imply.
- What's the recent tenant-quality profile in this submarket — average credit score on applications, eviction rate, late-payment / NSF rate, and stable-employment percentage? A property-management company in the area should have these aggregated.
- How much new for-sale + rental construction is in the pipeline within 1–3 miles? Heavy new supply typically softens prices + rents 12–24 months out; constrained supply supports both.
Investment metrics
- 1% rule
- 0.86% ✗
- Cap rate
- 6.33%
- Cash-on-cash
- 0.12%
- DSCR
- 1.01
- GRM
- 9.7
CMA / ARV
- ARV (on-the-fly)
- $705,888
- Comps found
- 1
Show comp detail 1 sale within ~0.75 mi
| Address | Dist | Beds/Ba | Sqft | Sold | Price | $/sf | Match |
|---|---|---|---|---|---|---|---|
| 231 Hancock Rd | 0.65mi | 2/1.0 | 1,328 (-3%) | 10mo | $685,000 | $516 | 56 |
Match score weights: distance 35% · size 25% · config 20% · recency 20%. Top-matched comps best support the ARV.
Projected returns pro-forma
5.26% appreciation · 3.0% rent growth · sell at horizon
- IRR
- 13.6%
- Equity multiple
- 1.88×
- Total profit
- $46,674
- Equity at exit
- $110,065
- IRR
- 14.3%
- Equity multiple
- 3.64×
- Total profit
- $139,600
- Equity at exit
- $192,451
Cash invested: $52,920 (down + closing). Projections, not guarantees.
Landlord ↔ Tenant lean methodology
- Overall (STATE)
- 41 Moderately Tenant-Leaning
- State Vermont
- 41 Moderately Tenant-Leaning · D+15
- County
- — inherits STATE
- City
- — inherits STATE
ZIP-level market 05846
- Home prices YoY
- 3.0%
- Active inventory
- 17
- Price-to-rent
- 9.7×
Monthly cashflow live
- Estimated rent
- $1,621 medium interval (Pro) →
- Mortgage (P&I)
- −$991
- Tax from tax record
- −$206 /mo · $2,466/yr
- Insurance
- −$79
- HOA
- −$0
- Vacancy / Maint / Mgmt
- −$340
- Net cashflow
- $5
Break-even live
Sensitivity live
| Price | -10% $112 | -5% $59 | +0% $5 | +5% $-48 | +10% $-102 |
|---|---|---|---|---|---|
| Rent | -10% $-123 | -5% $-59 | +0% $5 | +5% $69 | +10% $133 |
| Rate | -1.0pp $100 | -0.5pp $53 | base $5 | +0.5pp $-44 | +1.0pp $-94 |
UW: 25.0% down · 7.5% · 30yr · 1.5% tax · 5.0% vac · 8.0% maint · 8.0% mgmt
Financing live
Cash to close
- Down payment
- $47,250
- Closing costs
- $5,670
- Reserves months
- —
- Total cash needed
- —
Loan-product check · same deal, 3 products live
Conventional
25% down · 7.5% · 30yr
- Down + closing
- —
- Monthly P&I
- —
- Monthly cashflow
- —
- DSCR
- —
- Eligible?
- —
Personal DTI + credit; lowest rate.
DSCR
20% down · 8.5% · 30yr
- Down + closing
- —
- Monthly P&I
- —
- Monthly cashflow
- —
- DSCR
- —
- Eligible?
- —
No personal income docs; deal must DSCR.
Hard money
10% down · 12.0% · 12mo
- Down + closing
- —
- Monthly P&I
- —
- Monthly cashflow
- —
- DSCR
- —
- Eligible?
- —
Short-term bridge; refi at stabilization.
Listing history 25 events
-
2026-06-21days on market $189,000 Active 149 DOM
-
2026-06-21days on market $189,000 Active 148 DOM
-
2026-06-18days on market $189,000 Active 146 DOM
-
2026-06-17days on market $189,000 Active 145 DOM
-
2026-06-16days on market $189,000 Active 144 DOM
-
2026-06-15days on market $189,000 Active 143 DOM
-
2026-06-15days on market $189,000 Active 142 DOM
-
2026-06-13days on market $189,000 Active 141 DOM
-
2026-06-12days on market $189,000 Active 140 DOM
-
2026-06-09days on market $189,000 Active 137 DOM
-
2026-06-08days on market $189,000 Active 136 DOM
-
2026-06-08days on market $189,000 Active 135 DOM
-
2026-06-07days on market $189,000 Active 134 DOM
-
2026-06-05days on market $189,000 Active 133 DOM
-
2026-06-03days on market $189,000 Active 131 DOM
-
2026-06-02days on market $189,000 Active 130 DOM
-
2026-06-01days on market $189,000 Active 129 DOM
-
2026-05-31days on market $189,000 Active 128 DOM
-
2026-05-30price $189,000
-
2026-05-29status Active
-
2026-01-19historical
-
2025-10-31status Active
-
2025-10-10historical Active with Contract
-
2025-10-03price $199,000
-
2025-09-15$209,000 Active
ⓘ Source: listings_history table (triggers on properties + properties_extension) + one-shot
backfill from property_details.listing_events for pre-trigger history.
Tax reassessment forecast VT · Partial reset (capped growth)
- Current annual tax
- $2,466 · $206/mo
- Projected year-2 tax
- $3,029 · $252/mo
- Expected delta
- +$562/yr (+$47/mo · 22.8%)
ⓘ Screening estimate from a state-policy table — verify with the county assessor before closing.
Climate risk First Street
- Flood 1/10 Low FEMA zone X · 0% chance over 30 yrs
- Wildfire 1/10 Low
- Heat 1/10 Low 7 d/yr ≥85°F today · 16 d/yr by 30 yrs out
- Wind 2/10 Low 3% chance of damaging wind over 30 yrs
- Air quality 2/10 Low 1 unhealthy d/yr today · 1 by 30 yrs out
Nearby sold comps map
Loading sold comps map…
Walkable amenities ~0.75 mi
Loading nearby amenities…
Taxation est. · year 1
- Rental income
- $19,450
- − Mortgage interest
- −$10,587
- − Property taxes
- −$2,466
- − Insurance
- −$945
- − Repairs & maintenance
- −$1,556
- − Management
- −$1,556
- − Depreciation
- −$5,498
- Taxable loss
- −$3,158
- Est. tax savings @ 24.0%
- +$758
- After-tax cash flow
- $819/yr
For passive investors: Depreciation is non-cash, so a rental often shows a tax loss while cash-flowing — sheltering income. Rental losses are passive: they offset passive income freely, and up to $25,000/yr can offset ordinary (W-2) income if you actively participate and your MAGI is under $100k (phasing out to $0 by $150k); unused losses carry forward. On sale, claimed depreciation is recaptured at up to 25%, and gains may owe capital-gains tax (a 1031 exchange can defer both). Figures are a year-1 estimate at your 24.0% rate — not tax advice; consult a CPA.
Schools (NCES district)
No district data.
Livability — Brighton
No livability data for this city. (Only ~50 U.S. cities are tracked.)
Census & demographics
- Population (ZIP)
- 1,144
Population outlook (Essex County) Hauer SSP2
- Today (2025)
- 5,715 people
- By 2030
- 5,396 · -5.6%
- By 2040
- 4,680 · -18.1%
- By 2050
- 4,025 · -29.6%
- By 2075
- 3,104 · -45.7%
- By 2100
- 2,590 · -54.7%
Race, ethnicity, and origin ACS 2023
- Neighborhood character
- Predominantly White (94%)
- Race & ethnicity
- White 94% Hispanic / Latino 4% Two or more races 2%
- Common ancestry
- Lithuanian 18% Slovak 4% Romanian 2%
- Foreign-born
- 3% · Canada
- Languages at home
- 93% English-only · French/Haitian/Cajun 5% Spanish 3%
Political lean MEDSL · Essex
- 2024 margin
- R (+16.0) · D 39.4% · R 55.4% · Other 5.2%
- 2008→2024 swing
- -30.5pp toward R · 2008: 14.5pp · 2024: -16.0pp
- All cycles
- 2024: R+16.0 2020: R+11.2 2016: R+18.0 2012: D+13.4 2008: D+14.5
Not yet ingested
- Civics
- —
Market trends
- HPI YoY
- ▲ 5.26%
- Current HPI
- 183.2072
- Rent YoY
- —
- Metro
- —
- State GDP YoY
- —
- F500 in state
- 0
Price history
-9.6% since first listed7 events — show timeline
- 2026-05-30 Price Changed $189,000 PrimeMLS
- 2026-05-29 Relisted — PrimeMLS
- 2026-01-19 Delisted — PrimeMLS
- 2025-10-31 Relisted — PrimeMLS
- 2025-10-10 Contingent — PrimeMLS
- 2025-10-03 Price Changed $199,000 PrimeMLS
- 2025-09-15 Listed $209,000 PrimeMLS
Property tax history
+9.9%/yrLatest (2024): $2,466 · +15.1% YoY. Source: county tax records.
Cash-flow waterfall
monthlySold comps — $/sqft
last 12 mo · ≤1 miLoading sold comps…