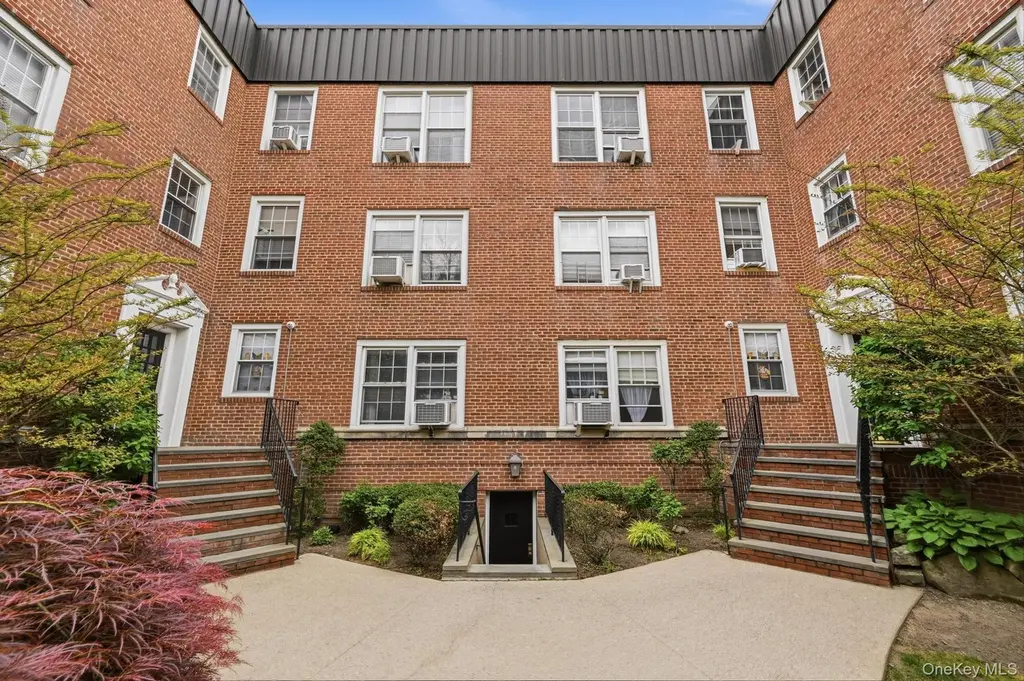
230 Central Ave Unit 1F · Lawrence, NY
Flood risk 1/10 · Minimal
- FEMA flood zone
- X (unshaded)
- Chance of flooding over 30 yrs
- 0.0%
- Est. flood insurance / yr
- $473 – $860
Fire risk 2/10 · Minimal
- Est. fire insurance / yr
- $691 – $1,283
Heat risk 6/10 · Moderate
- Hot days now (above 95°F)
- 7 days/yr
- Hot days in 30 yrs
- 16 days/yr
Wind risk 8/10 · Major
- Chance of severe wind over 30 yrs
- 80.0%
Air-quality risk 4/10 · Minor
- Unhealthy air days now
- 4 days/yr
- Unhealthy air days in 30 yrs
- 6 days/yr
Risk factors via First Street. Map © Google.
Why this score? — see what drove the D+ grade
The composite is a weighted blend of 9 inputs, each scored 0–100. Each bar is that input's sub-score; the figure is the points it added to the 100-point composite (weight × sub-score).
- ARV discount +12.5/15.0
- Appreciation +10.0/10.0
- Cash flow +5.5/30.0
- 1% rule +5.0/10.0
- Schools +4.2/10.0
- Livability +3.0/5.0
- Rent growth +2.5/5.0
- Condition / age +2.5/5.0
- DSCR +0.0/10.0
$365,000
🖨 Deal sheet 📄 Offer letter ✓ Due diligence
Listing remarks
Set within the sought-after Majestic Building, this inviting Lawrence co-op offers a seamless combination of timeless character and modern updates. From the moment you enter, rich hardwood floors and an airy layout create a welcoming feel throughout the living and dining spaces, ideal for both quiet evenings at home and effortless entertaining. The apartment features two comfortable bedrooms with classic parquet flooring and ceiling fans, adding warmth and charm to each space. The renovated kitchen blends style and functionality with granite countertops, stainless steel appliances, ceramic tile flooring, and ample workspace for everyday cooking or hosting guests. Recessed lighting throughou
Key facts
- Garage
- Built 1942
- Listed 15 days
Neighborhood map
What this means for you Summary
Snapshot
- This is a 2-bed/1.0-bath condo listed at $365k.
Deal economics
- At list price, monthly cash flow is $-780 ($-9k/yr) — negative.
- The deal already cash-flows at list — no discount required.
- To meet the 1% rule (rent ≥ 1% of price), the offer needs to be $364k (0.2% below list).
- Recommended offer: $360k (1.5% below list) — sets the bar for market timing.
- Cap rate 3.7% vs local median 2.8% in Lawrence — top-decile yield for the area; either an underpriced asset or a hidden risk that comps aren't pricing in. Stress-test before assuming the spread holds.
Location & tenants
- Location reads 60/100 on livability (#981 in NY) — a middle-class / working-renter tenant base. Strengths: crime A+, employment A+; Watch: housing C-, amenities F, commute F.
- Lawrence Union Free School District (suburban): math 43% / reading 46% proficiency, ranked #399 of 590 in NY (top 68%) — families likely to look elsewhere, expect single-tenant / working-renter base with shorter leases.
- Market conditions: 53 active listings in the ZIP; 7 comparable units currently listed for rent nearby; rentals at typical pace (median 19d on market — plan ~3-4 weeks tenant-placement turnaround); 824 units permitted in Nassau County in 2024 (153 in 5+ unit buildings).
Forward outlook
- In year one you build about $39k of equity ($3k loan paydown + $36k appreciation (10.0% local appreciation)).
- Nassau County population projected at +7% by 2050 — modest demand growth; plan on rents tracking national, not racing it.
- By year 2, paydown + projected appreciation supports a ~$63k cash-out refi (75% LTV) — recoverable capital for the next deal without selling this one.
Negotiation context
- It's been on market 16 days — a 2% lower offer ($360k) is reasonable based on typical stale-listing flexibility.
- 7 sale attempts since 14y ago; this cycle's ask has dropped $34k (9%) from the opening price — seller is motivated, your offer sets the floor, not the list.
Risks & watch-outs
- Watch-outs: HOA is 31% of rent; built in 1942 — expect roof / HVAC / electrical / plumbing capex.
- Climate carrying-cost: severe wind risk, 80% chance of damaging wind over 30y; extreme-heat days projected 7→16/yr by 2055 (HVAC capex compounding) — expect insurance premiums to compound above CPI over the hold.
Questions for the listing agent
- What do current leases actually rent for vs. the listed asking? Can we see a recent rent roll and the last 12 months of T-12 income?
- Built in 1942 — when were the roof, HVAC, electrical panel, plumbing, and water heater last replaced?
- What does the HOA fee cover, when was the last increase, and are there any pending special assessments or reserve-fund shortfalls?
- Any open or pending special assessments — roof, HVAC, plumbing, elevator, façade? What's the per-unit balance and payoff schedule, and is the seller paying it off at close or rolling it to the buyer?
- Is there a deadline driving the sale (1031 exchange, divorce, estate, relocation)? That informs how much negotiation room exists.
- The area grade is low — what's the realistic commute time and amenity access for the typical tenant pool here? Any planned neighborhood developments (good or bad) we should know about?
- What's the average days-on-market for RENTAL listings here right now (not sales)? A rising rental-DOM trend means longer vacancies and softer asking-rent achievability than the comps imply.
- What's the recent tenant-quality profile in this submarket — average credit score on applications, eviction rate, late-payment / NSF rate, and stable-employment percentage? A property-management company in the area should have these aggregated.
- How much new apartment / multifamily construction is in the pipeline within 1–3 miles? Heavy new supply (>2% of stock underway) typically softens rents 12–24 months out; light construction supports rent growth.
Investment metrics
- 1% rule
- 1.00% ✗
- Cap rate
- 3.73%
- Cash-on-cash
- -9.16%
- DSCR
- 0.59
- GRM
- 8.3
CMA / ARV
- ARV (median comp)
- $410,362
- List price
- $365,000
- Delta
- -8.62%
- Verdict
- FAIR
- Comps
- 20 within 1.0 mi
Projected returns pro-forma
10.0% appreciation · 3.0% rent growth · sell at horizon
- IRR
- 17.9%
- Equity multiple
- 2.47×
- Total profit
- $149,881
- Equity at exit
- $328,821
- IRR
- 16.8%
- Equity multiple
- 5.72×
- Total profit
- $481,925
- Equity at exit
- $709,115
Cash invested: $102,200 (down + closing). Projections, not guarantees.
Landlord ↔ Tenant lean methodology
- Overall (STATE)
- 15 Strongly Tenant-Friendly
- State New York
- 15 Strongly Tenant-Friendly · D+10
- County
- — inherits STATE
- City
- — inherits STATE
ZIP-level market 11559
- Home prices YoY
- 4.1%
- Active inventory
- 53
- Price-to-rent
- 8.3×
Monthly cashflow live
- Estimated rent
- $3,644 high interval (Pro) →
- Mortgage (P&I)
- −$1,914
- Tax est. 1.5%
- −$456 /mo · $5,475/yr
- Insurance
- −$152
- HOA est. from 2 same-building comps
- −$1,136
- Vacancy / Maint / Mgmt
- −$765
- Net cashflow
- $-780
Break-even live
UW: 25.0% down · 7.5% · 30yr · 1.5% tax · 5.0% vac · 8.0% maint · 8.0% mgmt
Financing live
Cash to close
- Down payment
- $91,250
- Closing costs
- $10,950
- Reserves months
- —
- Total cash needed
- —
Loan-product check · same deal, 3 products live
Conventional
25% down · 7.5% · 30yr
- Down + closing
- —
- Monthly P&I
- —
- Monthly cashflow
- —
- DSCR
- —
- Eligible?
- —
Personal DTI + credit; lowest rate.
DSCR
20% down · 8.5% · 30yr
- Down + closing
- —
- Monthly P&I
- —
- Monthly cashflow
- —
- DSCR
- —
- Eligible?
- —
No personal income docs; deal must DSCR.
Hard money
10% down · 12.0% · 12mo
- Down + closing
- —
- Monthly P&I
- —
- Monthly cashflow
- —
- DSCR
- —
- Eligible?
- —
Short-term bridge; refi at stabilization.
Rent comps 7 comps
| Address | Beds | Baths | Sqft | Rent | $/sqft | DOM | Units | Dist |
|---|---|---|---|---|---|---|---|---|
| 120 Maple Ave Unit 2nd FLOOR Cedarhurst, NY | 3.0 | 2.0 | 1150 | $4,275 | $3.72 | 10d | 1 | 0.93mi |
| 11 Bayview Ave Inwood, NY | 3.0 | 2.0 | 1246 | $4,500 | $3.61 | 24d | 1 | 0.93mi |
| 49 Roger Ave Inwood, NY | 3.0 | 1.0 | 800 | $3,200 | $4.00 | 43d | 1 | 0.94mi |
| 601 Chestnut St Unit A-21 Cedarhurst, NY | 1.0 | 1.0 | 700 | $2,850 | $4.07 | 43d | 1 | 0.95mi |
| 623 Central Ave Unit 306 Cedarhurst, NY | 1.0 | 1.0 | 1000 | $2,550 | $2.55 | 18d | 1 | 0.96mi |
| 757 Chestnut St Unit 1st Fl Cedarhurst, NY | 2.0 | 2.0 | 1200 | $4,195 | $3.50 | 1d | 1 | 1.04mi |
| 13-15 Heyson Rd Unit 2 Far Rockaway, NY | 3.0 | 1.0 | 1200 | $3,600 | $3.00 | 18d | 1 | 1.48mi |
HOA detail condo
- Monthly dues
- $0 · $0/yr
- Assessments
- None detected in remarks — confirm with the listing agent.
Listing history 27 events
-
2026-06-18days on market $365,000 Active 16 DOM
-
2026-06-17days on market $365,000 Active 15 DOM
-
2026-06-16days on market $365,000 Active 14 DOM
-
2026-06-15days on market $365,000 Active 13 DOM
-
2026-06-13days on market $365,000 Active 11 DOM
-
2026-06-13days on market $365,000 Active 10 DOM
-
2026-06-09days on market $365,000 Active 7 DOM
-
2026-06-08days on market $365,000 Active 6 DOM
-
2026-06-07days on market $365,000 Active 5 DOM
-
2026-06-04days on market $365,000 Active 2 DOM
-
2026-06-03status $365,000 Active 1 DOM
-
2026-06-02remarks 699-char remark
-
2026-06-02pricestatusdays on market $365,000 Coming Soon 1 DOM
-
2026-05-13historical
-
2026-04-05price $375,000
-
2026-02-27price $395,000
-
2025-11-05$399,000 Active
-
2024-05-01status Active
-
2023-12-18status Active
-
2023-12-15historical
-
2023-12-15$399,000 Active
-
2023-12-11historical
-
2023-12-11$399,000 Active
-
2015-09-22historical
-
2014-10-02$159,000
-
2013-09-30historical
-
2012-07-13$169,000
ⓘ Source: listings_history table (triggers on properties + properties_extension) + one-shot
backfill from property_details.listing_events for pre-trigger history.
Climate risk First Street
- Flood 1/10 Low FEMA zone X (unshaded) · 0% chance over 30 yrs
- Wildfire 2/10 Low
- Heat 6/10 Major 7 d/yr ≥95°F today · 16 d/yr by 30 yrs out
- Wind 8/10 Severe 80% chance of damaging wind over 30 yrs
- Air quality 4/10 Moderate 4 unhealthy d/yr today · 6 by 30 yrs out
Nearby sold comps map
Loading sold comps map…
Walkable amenities ~0.75 mi
Loading nearby amenities…
Taxation est. · year 1
- Rental income
- $43,727
- − Mortgage interest
- −$20,446
- − Property taxes
- −$5,475
- − Insurance
- −$1,825
- − Repairs & maintenance
- −$3,498
- − Management
- −$3,498
- − HOA
- −$13,632
- − Depreciation
- −$10,618
- Taxable loss
- −$15,265
- Est. tax savings @ 24.0%
- +$3,664
- After-tax cash flow
- $-5,693/yr
For passive investors: Depreciation is non-cash, so a rental often shows a tax loss while cash-flowing — sheltering income. Rental losses are passive: they offset passive income freely, and up to $25,000/yr can offset ordinary (W-2) income if you actively participate and your MAGI is under $100k (phasing out to $0 by $150k); unused losses carry forward. On sale, claimed depreciation is recaptured at up to 25%, and gains may owe capital-gains tax (a 1031 exchange can defer both). Figures are a year-1 estimate at your 24.0% rate — not tax advice; consult a CPA.
Schools (NCES district)
- District
- Lawrence Union Free School District
- NCES district ID
- 3616830
- Math proficiency
- 43% ▼ -2.00%
- Reading proficiency
- 46% ▼ -8.00%
- Median HH income
- $91,008
- Composite
- 42.14/100
- National rank
- #3307
- State rank
- #399 of 590 in NY
Livability — Lawrence
- Score
- 60/100
- State rank
- #981
- US rank
- #19168
Category grades
Schools grade is shown separately in the Schools card above.
Census & demographics
- Census place
- Lawrence, NY
- City population
- 9,130
- Population (ZIP)
- 9,130
Population outlook (Nassau County) Hauer SSP2
- Today (2025)
- 1,409,302 people
- By 2030
- 1,431,482 · +1.6%
- By 2040
- 1,471,607 · +4.4%
- By 2050
- 1,502,845 · +6.6%
- By 2075
- 1,575,403 · +11.8%
- By 2100
- 1,554,356 · +10.3%
Race, ethnicity, and origin ACS 2023
- Neighborhood character
- Predominantly White (76%)
- Race & ethnicity
- White 76% Hispanic / Latino 17% Black 5% Two or more races 2% Asian 2%
- Hispanic origin (detail)
- Puerto Rican 3% Dominican 2%
- Common ancestry
- Romanian 19% Slovak 3% Hispanic 3%
- Foreign-born
- 20% · Canada
- Languages at home
- 67% English-only · Spanish 11% French/Haitian/Cajun 4% Russian/Polish/Slavic 3%
Political lean MEDSL · Nassau
- 2024 margin
- Toss-up / Even · D 47.9% · R 52.1%
- 2008→2024 swing
- -12.6pp toward R · 2008: 8.4pp · 2024: -4.2pp
- All cycles
- 2024: R+4.2 2020: D+9.5 2016: D+5.3 2012: D+6.7 2008: D+8.4
Not yet ingested
- Civics
- —
Market trends
- HPI YoY
- ▲ 17.24%
- Current HPI
- 436.7253
- Rent YoY
- —
- Metro
- —
- State GDP YoY
- ▲ 2.60%
- F500 in state
- 92
Industry mix (Fortune 500 HQ in NY)
| Industry | F500 HQs | Revenue |
|---|---|---|
| Financial Services | 10 | $950B |
|
||
| Consumer Goods | 9 | $162B |
|
||
| Insurance | 4 | $225B |
|
||
| Telecommunications | 2 | $144B |
|
||
| Pharmaceuticals | 2 | $112B |
|
||
| Media / Entertainment | 2 | $69B |
|
||
Price history
+121.9% since first listed14 events — show timeline
- 2026-05-13 Listing Removed — OneKey® MLS as Distributed by MLS Grid
- 2026-04-05 Price Changed $375,000 OneKey® MLS as Distributed by MLS Grid
- 2026-02-27 Price Changed $395,000 OneKey® MLS as Distributed by MLS Grid
- 2025-11-05 Listed $399,000 OneKey® MLS as Distributed by MLS Grid
- 2024-05-01 Relisted — OneKey® MLS as Distributed by MLS Grid
- 2023-12-18 Relisted — OneKey® MLS as Distributed by MLS Grid
- 2023-12-15 Listing Removed — OneKey® MLS as Distributed by MLS Grid
- 2023-12-15 Listed $399,000 OneKey® MLS as Distributed by MLS Grid
- 2023-12-11 Coming Soon — OneKey® MLS as Distributed by MLS Grid
- 2023-12-11 Listed $399,000 OneKey® MLS as Distributed by MLS Grid
- 2015-09-22 Listing Removed — OneKey® MLS as Distributed by MLS Grid
- 2014-10-02 Listed $159,000 OneKey® MLS as Distributed by MLS Grid
- 2013-09-30 Listing Removed — OneKey® MLS as Distributed by MLS Grid
- 2012-07-13 Listed $169,000 OneKey® MLS as Distributed by MLS Grid
Cash-flow waterfall
monthlySold comps — $/sqft
last 12 mo · ≤1 miLoading sold comps…