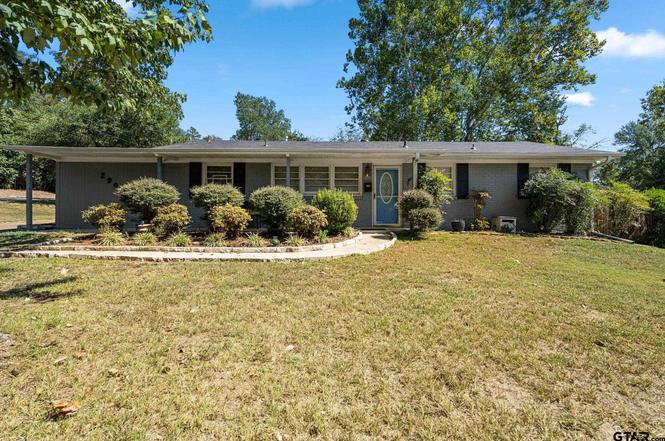
2904 New Copeland Rd · Tyler, TX
Flood risk 1/10 · Minimal
- FEMA flood zone
- X (unshaded)
- Chance of flooding over 30 yrs
- 0.0%
- Est. flood insurance / yr
- $507 – $1,088
Fire risk 1/10 · Minimal
- Est. fire insurance / yr
- $1,222 – $2,270
Heat risk 6/10 · Moderate
- Hot days now (above 109°F)
- 7 days/yr
- Hot days in 30 yrs
- 24 days/yr
Wind risk 6/10 · Moderate
- Chance of severe wind over 30 yrs
- 61.0%
Air-quality risk 2/10 · Minimal
- Unhealthy air days now
- 0 days/yr
- Unhealthy air days in 30 yrs
- 1 days/yr
Risk factors via First Street. Map © Google.
Why this score? — see what drove the F grade
The composite is a weighted blend of 9 inputs, each scored 0–100. Each bar is that input's sub-score; the figure is the points it added to the 100-point composite (weight × sub-score).
- Cash flow +9.7/30.0
- Livability +3.8/5.0
- Rent growth +3.4/5.0
- ARV discount +3.3/15.0
- Schools +3.3/10.0
- DSCR +2.8/10.0
- Condition / age +2.5/5.0
- 1% rule +2.4/10.0
- Appreciation +0.0/10.0
$229,750
🖨 Deal sheet 📄 Offer letter ✓ Due diligence
Listing remarks MLS
Discover this beautifully maintained classic home nestled on a spacious corner lot in the heart of Tyler. With convenient road access from New Copeland and Watkins, this residence offers both character and convenience. Inside, you'll find two generously sized bedrooms and a full bath featuring a walk-in tile shower and elegant marble countertop. The inviting wood laminate plank flooring flows throughout the living spaces, while the kitchen boasts large tile flooring, custom cabinetry, and ample storage for all your culinary needs. A versatile small craft room with a utility closet and a large storage closet offers flexibility, previously serving as an office or small bedroom. The expansive flex space, adorned with vinyl plank flooring, provides the perfect area for recreation or additional living space. Enjoy outdoor entertaining on two lovely wood deck areas, ideal for hosting guests. The detached two-car garage comes with two large storage areas, and the spacious fenced backyard features a convenient metal storage building. This charming home exudes warmth and character, presenting endless possibilities!
Key facts
- Custom cabinetry
- Marble countertop
- Walk-in tile shower
Tags
Property features AI
Finance
- Other: Will not subdivide; Parcel number: 150000082400006000
- HOA & community: No association
Exterior
- Parking: 2 covered parking spaces; 2-car garage (oversized, faces side) with storage; Has garage
- Utilities: City water; City sewer; Electricity available and connected; Cable available; Asphalt roads and curbs; Individual gas meter; No municipal utility district
- Home design: Single family residence; Residential property; One story; Accessible grip (accessibility feature); Not attached to another property; Restrictions: animals, deed restrictions, no mobile home
- Construction: Built in 1953 (preowned); Brick and wood construction; Slab foundation; Composition roof
- Exterior features: Private yard; Uncovered courtyard; Storage; Back yard fencing (wood); Fenced yard; Corner lot; Few trees; Grassed and partially wooded vegetation
Interior
- Kitchen: Dishwasher; Electric cooktop; Electric oven; Electric range; Microwave; Refrigerator; Eat-in kitchen
- Bedrooms: 3 bedrooms (primary bedroom on main level)
- Flooring: Tile; Vinyl; Wood
- Bathrooms: 1 full bathroom
- Heating & cooling: Central heating (natural gas); Central air conditioning (electric); Ceiling fan(s)
- Interior features: Cable TV available; Eat-in kitchen; High-speed internet available; Walk-in closet(s); Two living areas; Room count: 3; One-level home
- Laundry & utility: Individual gas meter
Neighborhood map
What this means for you Summary
Snapshot
- This is a 3-bed/1.0-bath single-family listed at $230k.
Deal economics
- At list price, monthly cash flow is $-149 ($-2k/yr) — negative.
- To cash-flow at today's rent, offer at most $203k (11.5% below list).
- To meet the 1% rule (rent ≥ 1% of price), the offer needs to be $169k (26.5% below list).
- Recommended offer: $169k (26.5% below list) — sets the bar for 1% rule.
- Cap rate 5.5% vs local median 3.6% in Tyler — top-decile yield for the area; either an underpriced asset or a hidden risk that comps aren't pricing in. Stress-test before assuming the spread holds.
Location & tenants
- Location reads 75/100 on livability (#147 in TX, #4,181 nationally) — a middle-class / working-renter tenant base. Strengths: cost of living A+, housing A+, health & safety A+; Watch: employment C-, crime D+, commute F.
- Tyler ISD (urban): math 39% / reading 38% proficiency, ranked #449 of 826 in TX (top 54%) — families likely to look elsewhere, expect single-tenant / working-renter base with shorter leases; 66% free/reduced lunch — lower-income household profile, screen leases tightly.
- Zoned schools: Woods El (math 54% / reading 51%, grade C-, #720 of 4,322 statewide, top 17%, 756 students, 48% FRL) — zoned schools average 48% FRL vs 66% district-wide (18 pts lower); this property's tenant base skews higher-income than the district average.
- Zoned-school proficiency averages 52% at this address vs 38% district-wide (+14 pts) — the actual schools serving this property are materially stronger than the Tyler ISD average implies; a family-tenant draw the district grade alone would hide.
- Market conditions: Rents rising (+3.7%/yr); 327 active listings in the ZIP; 29 comparable units currently listed for rent nearby; rentals leasing fast (median 14d on market — plan ~1-2 weeks tenant-placement turnaround); 595 units permitted in Smith County in 2024 (45 in 5+ unit buildings).
- This rent runs 31% of the median local income ($66k/yr) — at the standard rent-burdened threshold; future hikes will face affordability resistance.
Forward outlook
- Local home prices are declining (-3.0%/yr); year-one equity from $2k of loan paydown is wiped out by about $7k of value loss. Plan a longer hold.
- Smith County population projected at +24% by 2050 — long-run rental-demand tailwind backs the buy-and-hold thesis.
Negotiation context
- It's been on market 195 days — a 12% lower offer ($202k) is reasonable based on typical stale-listing flexibility.
- 4 sale attempts since 2y ago with the ask held roughly flat each time — persistent listings suggest the price (not the market) is what's stuck; bring a comps-based counter.
Risks & watch-outs
- Watch-outs: built in 1953 — expect roof / HVAC / electrical / plumbing capex.
- Climate carrying-cost: major wind risk, 61% chance of damaging wind over 30y; extreme-heat days projected 7→24/yr by 2055 (HVAC capex compounding) — expect insurance premiums to compound above CPI over the hold.
Questions for the listing agent
- What do current leases actually rent for vs. the listed asking? Can we see a recent rent roll and the last 12 months of T-12 income?
- It's been on market 195 days. Have you received any prior offers? Is the seller open to a 26% concession, seller financing, or rate buy-down credit?
- Built in 1953 — when were the roof, HVAC, electrical panel, plumbing, and water heater last replaced?
- Why hasn't it sold? Are there any deal-killer items the seller is aware of (foundation, flood, title, zoning, code violations)?
- Is there a deadline driving the sale (1031 exchange, divorce, estate, relocation)? That informs how much negotiation room exists.
- Schools are D-rated, which usually means shorter tenancies and higher turnover. Who's the typical renter profile here, and what's been the actual vacancy rate?
- Crime grade is D in this area — have there been break-ins, vandalism, or insurance claims at this property in the last 3 years? What carrier currently insures it and at what premium?
- The area grade is low — what's the realistic commute time and amenity access for the typical tenant pool here? Any planned neighborhood developments (good or bad) we should know about?
- What's the average days-on-market for RENTAL listings here right now (not sales)? A rising rental-DOM trend means longer vacancies and softer asking-rent achievability than the comps imply.
- What's the recent tenant-quality profile in this submarket — average credit score on applications, eviction rate, late-payment / NSF rate, and stable-employment percentage? A property-management company in the area should have these aggregated.
- How much new for-sale + rental construction is in the pipeline within 1–3 miles? Heavy new supply typically softens prices + rents 12–24 months out; constrained supply supports both.
Investment metrics
- 1% rule
- 0.74% ✗
- Cap rate
- 5.51%
- Cash-on-cash
- -2.78%
- DSCR
- 0.88
- GRM
- 11.3
CMA / ARV
- ARV (on-the-fly)
- $210,025
- Comps found
- 1
Show comp detail 1 sale within ~0.75 mi
| Address | Dist | Beds/Ba | Sqft | Sold | Price | $/sf | Match |
|---|---|---|---|---|---|---|---|
| 611 E Watkins St | 0.02mi | 3/1.0 | 1,478 (+9%) | 3mo | $229,000 | $155 | 82 |
Match score weights: distance 35% · size 25% · config 20% · recency 20%. Top-matched comps best support the ARV.
Projected returns pro-forma
-3.0% appreciation · 3.66% rent growth · sell at horizon
- IRR
- -20.3%
- Equity multiple
- 0.29×
- Total profit
- $-45,644
- Equity at exit
- $34,256
- IRR
- -12.1%
- Equity multiple
- 0.26×
- Total profit
- $-47,445
- Equity at exit
- $19,865
Cash invested: $64,330 (down + closing). Projections, not guarantees.
Landlord ↔ Tenant lean methodology
- Overall (STATE)
- 87 Strongly Landlord-Friendly
- State Texas
- 87 Strongly Landlord-Friendly · R+5
- County
- — inherits STATE
- City
- — inherits STATE
ZIP-level market 75701
- Rents YoY
- 3.7%
- Active inventory
- 327
- Price-to-rent
- 11.3×
Monthly cashflow live
- Estimated rent
- $1,689 high interval (Pro) →
- Mortgage (P&I)
- −$1,205
- Tax from tax record
- −$183 /mo · $2,200/yr
- Insurance
- −$96
- HOA
- −$0
- Vacancy / Maint / Mgmt
- −$355
- Net cashflow
- $-149
Break-even live
UW: 25.0% down · 7.5% · 30yr · 1.5% tax · 5.0% vac · 8.0% maint · 8.0% mgmt
Financing live
Cash to close
- Down payment
- $57,438
- Closing costs
- $6,892
- Reserves months
- —
- Total cash needed
- —
Loan-product check · same deal, 3 products live
Conventional
25% down · 7.5% · 30yr
- Down + closing
- —
- Monthly P&I
- —
- Monthly cashflow
- —
- DSCR
- —
- Eligible?
- —
Personal DTI + credit; lowest rate.
DSCR
20% down · 8.5% · 30yr
- Down + closing
- —
- Monthly P&I
- —
- Monthly cashflow
- —
- DSCR
- —
- Eligible?
- —
No personal income docs; deal must DSCR.
Hard money
10% down · 12.0% · 12mo
- Down + closing
- —
- Monthly P&I
- —
- Monthly cashflow
- —
- DSCR
- —
- Eligible?
- —
Short-term bridge; refi at stabilization.
Rent comps 29 comps
| Address | Beds | Baths | Sqft | Rent | $/sqft | DOM | Units | Dist |
|---|---|---|---|---|---|---|---|---|
| 3106 S Donnybrook Ave Tyler, TX | 3.0 | 1.0 | 1251 | $1,525 | $1.22 | 13d | 1 | 0.18mi |
| 3206 Bain Pl Tyler, TX | 3.0 | 2.5 | 1840 | $1,895 | $1.03 | 44d | 1 | 0.25mi |
| 3210 S Donnybrook Ave Tyler, TX | 3.0 | 2.0 | 1584 | $1,945 | $1.23 | 21d | 1 | 0.28mi |
| 117 Ridgecrest Dr Tyler, TX | 3.0 | 2.0 | 1571 | $2,150 | $1.37 | 44d | 1 | 0.29mi |
| 2720 S Broadway Ave Tyler, TX | 1.0–3.0 | 1.0–2.0 | 1064 | $1,330 | $1.25 | 13d | 14 | 0.34mi |
| 826 Wilma St Tyler, TX | 3.0 | 2.0 | 1210 | $1,800 | $1.49 | 13d | 1 | 0.34mi |
| 3301 S Broadway Ave Tyler, TX | 1.0–2.0 | 1.0–2.0 | 841 | $1,056 | $1.26 | 44d | 2 | 0.48mi |
| 3712 Colony Park Dr Tyler, TX | 3.0 | 2.0 | 1802 | $1,850 | $1.03 | 13d | 1 | 0.65mi |
| 1225 San Antonio St Tyler, TX | 3.0 | 2.0 | 1754 | $1,695 | $0.97 | 13d | 1 | 0.96mi |
| 614 Woodland Hills Dr Tyler, TX | 2.0 | 2.0 | 1690 | $2,200 | $1.30 | 44d | 1 | 1.01mi |
| 1107 Dogwood St Tyler, TX | 3.0 | 1.5 | 1620 | $1,475 | $0.91 | 21d | 1 | 1.14mi |
| 1403 S Donnybrook Ave Tyler, TX | 3.0 | 3.0 | 1834 | $2,150 | $1.17 | 44d | 1 | 1.18mi |
| 711 W 6th St Tyler, TX | 3.0 | 2.0 | 1854 | $1,850 | $1.00 | 13d | 1 | 1.19mi |
| 1712 Redbud Ave Tyler, TX | 3.0 | 1.5 | 1561 | $1,475 | $0.94 | 13d | 1 | 1.20mi |
| 1712 Redbud Ave Tyler, TX | 3.0 | 1.5 | 1305 | $1,475 | $1.13 | 21d | 1 | 1.20mi |
| 1224 S Azalea Dr Tyler, TX | 3.0 | 1.0 | 1276 | $1,300 | $1.02 | 13d | 1 | 1.22mi |
| 908 W 6th St Tyler, TX | 2.0 | 1.0 | 1112 | $1,300 | $1.17 | 13d | 1 | 1.26mi |
| 902 W 5th St Tyler, TX | 2.0 | 1.0 | 1369 | $1,200 | $0.88 | 13d | 1 | 1.28mi |
| 1655 S Kennedy Ave Tyler, TX | 2.0 | 2.5 | 1174 | $1,595 | $1.36 | 44d | 1 | 1.30mi |
| 1655 S Kennedy Ave Unit 203 Tyler, TX | 2.0 | 2.5 | 1174 | $1,650 | $1.41 | 44d | 1 | 1.30mi |
| 305 E Lake St Tyler, TX | 2.0 | 1.5 | 1287 | $1,695 | $1.32 | 13d | 1 | 1.34mi |
| 1909 Sybil Ln Tyler, TX | 1.0–3.0 | 1.0–2.0 | 1067 | $1,510 | $1.42 | 13d | 9 | 1.36mi |
| 1118 S Fleishel Ave Tyler, TX | 3.0 | 2.0 | 1425 | $1,495 | $1.05 | 13d | 1 | 1.37mi |
| 328 Mockingbird Ln Tyler, TX | 2.0 | 1.0 | 1200 | $950 | $0.79 | 13d | 1 | 1.39mi |
| 4118 Southpark Dr Tyler, TX | 3.0 | 2.0 | 1552 | $1,450 | $0.93 | 44d | 1 | 1.40mi |
| 4400 Paluxy Dr Tyler, TX | 1.0–3.0 | 1.0–2.0 | 905 | $1,227 | $1.36 | 13d | 60 | 1.47mi |
| 420 E Dodge St Tyler, TX | 3.0 | 2.0 | 940 | $950 | $1.01 | 13d | 1 | 1.48mi |
| 4309 Aberdeen Dr Tyler, TX | 3.0 | 2.0 | 1219 | $1,475 | $1.21 | 44d | 1 | 1.49mi |
| 1115 S Robertson Ave Tyler, TX | 2.0 | 1.0 | 1366 | $1,550 | $1.13 | 13d | 1 | 1.49mi |
Listing history 26 events
-
2026-06-19days on market $229,750 Active 195 DOM
-
2026-06-18days on market $229,750 Active 194 DOM
-
2026-06-17days on market $229,750 Active 193 DOM
-
2026-06-16days on market $229,750 Active 192 DOM
-
2026-06-15days on market $229,750 Active 191 DOM
-
2026-06-14days on market $229,750 Active 189 DOM
-
2026-06-13days on market $229,750 Active 188 DOM
-
2026-06-10days on market $229,750 Active 186 DOM
-
2026-06-09days on market $229,750 Active 185 DOM
-
2026-06-08days on market $229,750 Active 184 DOM
-
2026-06-07days on market $229,750 Active 183 DOM
-
2026-06-05days on market $229,750 Active 180 DOM
-
2026-06-02statusdays on market $229,750 Active 178 DOM
-
2026-06-01days on market $229,750 Active Contingent 76 DOM
-
2026-05-31days on market $229,750 Active Contingent 75 DOM
-
2026-05-30days on market $229,750 Active Contingent 74 DOM
-
2026-03-26historical Active Contingent
-
2026-03-01$229,750 Active
-
2025-12-06$229,750 Active 1123-char remark
Show marketing remark (1123 chars)
Discover this beautifully maintained classic home nestled on a spacious corner lot in the heart of Tyler. With convenient road access from New Copeland and Watkins, this residence offers both character and convenience. Inside, you'll find two generously sized bedrooms and a full bath featuring a walk-in tile shower and elegant marble countertop. The inviting wood laminate plank flooring flows throughout the living spaces, while the kitchen boasts large tile flooring, custom cabinetry, and ample storage for all your culinary needs. A versatile small craft room with a utility closet and a large storage closet offers flexibility, previously serving as an office or small bedroom. The expansive flex space, adorned with vinyl plank flooring, provides the perfect area for recreation or additional living space. Enjoy outdoor entertaining on two lovely wood deck areas, ideal for hosting guests. The detached two-car garage comes with two large storage areas, and the spacious fenced backyard features a convenient metal storage building. This charming home exudes warmth and character, presenting endless possibilities!
-
2025-05-05price $234,500
-
2025-05-01historical
-
2025-03-12$239,900 Active
-
2025-01-10price $239,900
-
2024-12-25historical
-
2024-10-07$245,500 Active
-
1964-02-27soldstatus
ⓘ Source: listings_history table (triggers on properties + properties_extension) + one-shot
backfill from property_details.listing_events for pre-trigger history.
Tax reassessment forecast TX · Resets to sale price
- Current annual tax
- $2,200 · $183/mo
- Projected year-2 tax
- $4,204 · $350/mo
- Expected delta
- +$2,004/yr (+$167/mo · 91.1%)
ⓘ Screening estimate from a state-policy table — verify with the county assessor before closing.
Climate risk First Street
- Flood 1/10 Low FEMA zone X (unshaded) · 0% chance over 30 yrs
- Wildfire 1/10 Low
- Heat 6/10 Major 7 d/yr ≥109°F today · 24 d/yr by 30 yrs out
- Wind 6/10 Major 61% chance of damaging wind over 30 yrs
- Air quality 2/10 Low 0 unhealthy d/yr today · 1 by 30 yrs out
Nearby sold comps map
Loading sold comps map…
Walkable amenities ~0.75 mi
Loading nearby amenities…
Taxation est. · year 1
- Rental income
- $20,274
- − Mortgage interest
- −$12,870
- − Property taxes
- −$2,200
- − Insurance
- −$1,149
- − Repairs & maintenance
- −$1,622
- − Management
- −$1,622
- − Depreciation
- −$6,684
- Taxable loss
- −$5,872
- Est. tax savings @ 24.0%
- +$1,409
- After-tax cash flow
- $-382/yr
For passive investors: Depreciation is non-cash, so a rental often shows a tax loss while cash-flowing — sheltering income. Rental losses are passive: they offset passive income freely, and up to $25,000/yr can offset ordinary (W-2) income if you actively participate and your MAGI is under $100k (phasing out to $0 by $150k); unused losses carry forward. On sale, claimed depreciation is recaptured at up to 25%, and gains may owe capital-gains tax (a 1031 exchange can defer both). Figures are a year-1 estimate at your 24.0% rate — not tax advice; consult a CPA.
Schools (NCES district)
- District
- Tyler ISD
- NCES district ID
- 4843470
- Math proficiency
- 39% ▼ -4.00%
- Reading proficiency
- 38% ▼ -1.00%
- Median HH income
- $44,090
- Composite
- 32.69/100
- National rank
- #5650
- State rank
- #449 of 826 in TX
Livability — Tyler
- Score
- 75/100
- State rank
- #147
- US rank
- #4181
Category grades
Schools grade is shown separately in the Schools card above.
Census & demographics
- Census place
- Tyler, TX
- County
- Smith County · 180,570 people
- City population
- 127,842
- Metro
- Tyler, TX
- Population (ZIP)
- 36,344
- Household income
- $66,401
- Rent vs Own
- Severe rent burden
- 1116.0
Population outlook (Smith County) Hauer SSP2
- Today (2025)
- 248,890 people
- By 2030
- 261,665 · +5.1%
- By 2040
- 286,114 · +15.0%
- By 2050
- 308,006 · +23.8%
- By 2075
- 354,171 · +42.3%
- By 2100
- 372,828 · +49.8%
Race, ethnicity, and origin ACS 2023
- Neighborhood character
- Diverse neighborhood (Simpson 0.64)
- Race & ethnicity
- White 53% Black 21% Hispanic / Latino 19% Two or more races 8% Asian 2%
- Hispanic origin (detail)
- Mexican 17%
- Common ancestry
- Slovak 2% Italian 1% Lithuanian 1%
- Foreign-born
- 8% · Canada
- Languages at home
- 84% English-only · Spanish 14% Other Indo-European 1%
Political lean MEDSL · Smith
- 2024 margin
- Solid R (+45.1) · D 27.0% · R 72.1%
- 2008→2024 swing
- -5.6pp toward R · 2008: -39.5pp · 2024: -45.1pp
- All cycles
- 2024: R+45.1 2020: R+39.4 2016: R+43.9 2012: R+46.9 2008: R+39.5
Not yet ingested
- Civics
- —
Market trends
- HPI YoY
- ▼ -299.78%
- Current HPI
- 207.238
- Rent YoY
- ▲ 3.66%
- Metro
- Tyler, TX
- State GDP YoY
- ▲ 3.95%
- F500 in state
- 110
Industry mix (Fortune 500 HQ in TX)
| Industry | F500 HQs | Revenue |
|---|---|---|
| Energy | 16 | $1,198B |
|
||
| Technology | 5 | $198B |
|
||
| Engineering / Construction | 4 | $72B |
|
||
| Energy Services | 3 | $60B |
|
||
| Utilities | 3 | $41B |
|
||
| Healthcare | 2 | $330B |
|
||
Price history
-6.4% since first listed10 events — show timeline
- 2026-03-26 Contingent — NTREIS
- 2026-03-01 Listed $229,750 NTREIS
- 2025-12-06 Listed $229,750 GTAR
- 2025-05-05 Price Changed $234,500 GTAR
- 2025-05-01 Listing Removed — NTREIS
- 2025-03-12 Listed $239,900 NTREIS
- 2025-01-10 Price Changed $239,900 GTAR
- 2024-12-25 Listing Removed — NTREIS
- 2024-10-07 Listed $245,500 NTREIS
- 1964-02-27 Sold (Public Records) — Public Records
Property tax history
+2.5%/yrLatest (2024): $2,200 · +7.4% YoY. Source: county tax records.
Cash-flow waterfall
monthlySold comps — $/sqft
last 12 mo · ≤1 miLoading sold comps…