884 W Holly St · Fayetteville, AR
Flood risk 1/10 · Minimal
- FEMA flood zone
- X (unshaded)
- Chance of flooding over 30 yrs
- 0.0%
- Est. flood insurance / yr
- $507 – $1,088
Fire risk 2/10 · Minimal
- Est. fire insurance / yr
- $1,499 – $2,785
Heat risk 5/10 · Moderate
- Hot days now (above 106°F)
- 7 days/yr
- Hot days in 30 yrs
- 21 days/yr
Wind risk 2/10 · Minimal
- Chance of severe wind over 30 yrs
- 2.0%
Air-quality risk 1/10 · Minimal
- Unhealthy air days now
- 0 days/yr
- Unhealthy air days in 30 yrs
- 0 days/yr
Risk factors via First Street. Map © Google.
Why this score? — see what drove the F grade
The composite is a weighted blend of 9 inputs, each scored 0–100. Each bar is that input's sub-score; the figure is the points it added to the 100-point composite (weight × sub-score).
- ARV discount +7.5/15.0
- Livability +4.2/5.0
- Schools +4.1/10.0
- Rent growth +3.0/5.0
- Condition / age +2.5/5.0
- Cash flow +0.0/30.0
- 1% rule +0.0/10.0
- DSCR +0.0/10.0
- Appreciation +0.0/10.0
$3,000,000
🖨 Deal sheet 📄 Offer letter ✓ Due diligence
Listing remarks MLS
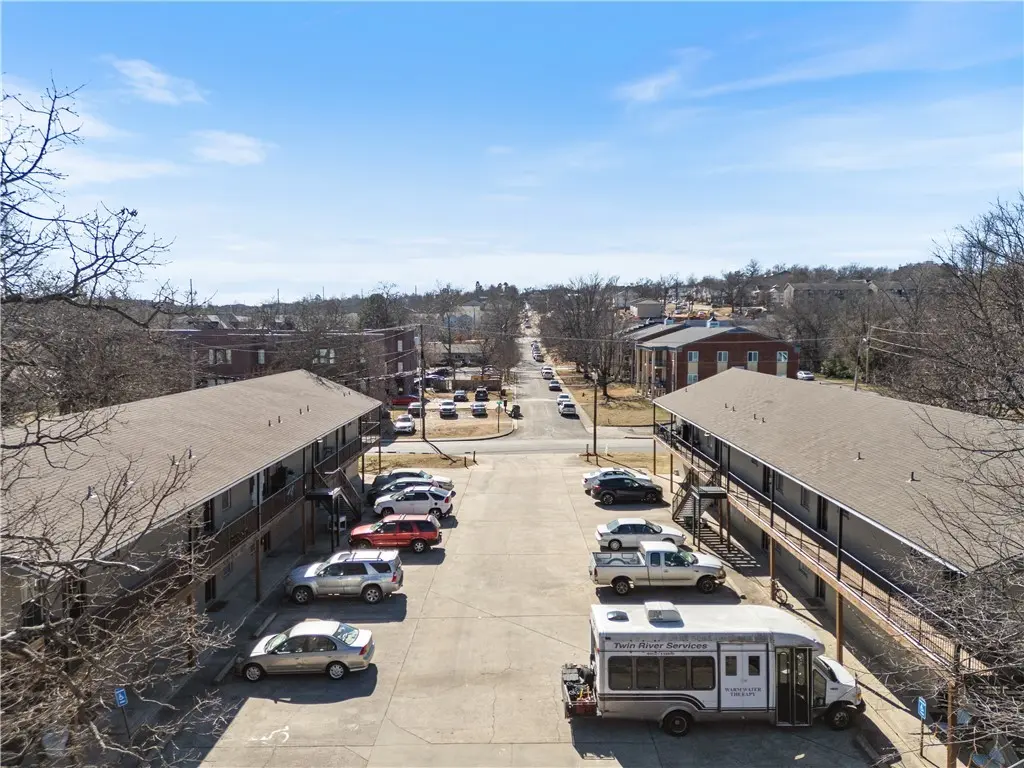
Arbor Vine is a 20-unit well-located multifamily property consisting of all two-bedroom units with significant capital improvements over the past five years including new roofs, siding, HVAC units, decks, and full interior renovations featuring LVP floors, granite counters, black appliances, and smart home thermostats. The property carries zero deferred maintenance and offers an ideal location for student and workforce housing, with close proximity to the University of Arkansas, major employers, and walkable retail and dining. Each unit is individually metered for water and electric and includes full-size washers, dryers, and dishwashers. Despite its fully renovated condition, current rents trail comparable properties by $200–$300 per month, representing immediate upside for a new owner. Additional value-add opportunities include introducing pet rent, admin fees, and trash/pest billing — none of which are currently charged — as well as reducing the above-market landscaping cost of $439/month.
Key facts
- New siding
- New roofs
- New hvac units
Tags
Neighborhood map
What this means for you Summary
Snapshot
- This is a townhouse listed at $3.00M.
Deal economics
- At list price, monthly cash flow is $-17k ($-210k/yr) — negative.
- To cash-flow at today's rent, offer at most $169k (94.4% below list).
- To meet the 1% rule (rent ≥ 1% of price), the offer needs to be $148k (95.1% below list).
- Recommended offer: $148k (95.1% below list) — sets the bar for 1% rule.
- Cap rate -0.7% vs local median 3.5% in Fayetteville — below-typical yield; the buyer is paying a premium for something (appreciation thesis, condition, location) that the cap rate doesn't capture.
Location & tenants
- Location reads 83/100 on livability (#3 in AR, #871 nationally) — a professional / high-income tenant draw. Strengths: amenities A+, commute A+, health & safety A+; Watch: employment D+, crime D-.
- Fayetteville School District (urban): math 50% / reading 49% proficiency, ranked #19 of 238 in AR (top 8%) — families likely to look elsewhere, expect single-tenant / working-renter base with shorter leases.
- Market conditions: Rents rising (+2.0%/yr); 309 active listings in the ZIP; 3,494 units permitted in Washington County in 2024 (1,497 in 5+ unit buildings).
Forward outlook
- Local home prices are declining (-3.0%/yr); year-one equity from $21k of loan paydown is wiped out by about $90k of value loss. Plan a longer hold.
- Washington County population projected at +47% by 2050 — long-run rental-demand tailwind backs the buy-and-hold thesis.
Negotiation context
- It's been on market 59 days — a 3% lower offer ($2.91M) is reasonable based on typical stale-listing flexibility.
- 8 sale attempts since 2y ago; this cycle's ask is 285614% above the opening price — seller raised mid-cycle; expect resistance to lowballs.
- Current owner paid $760k; list at $3.00M implies a 295% gain — meaningful room to come down on a strong offer.
Risks & watch-outs
- Climate carrying-cost: extreme-heat days projected 7→21/yr by 2055 (HVAC capex compounding) — expect insurance premiums to compound above CPI over the hold.
Questions for the listing agent
- What do current leases actually rent for vs. the listed asking? Can we see a recent rent roll and the last 12 months of T-12 income?
- It's been on market 59 days. Have you received any prior offers? Is the seller open to a 95% concession, seller financing, or rate buy-down credit?
- Is there a deadline driving the sale (1031 exchange, divorce, estate, relocation)? That informs how much negotiation room exists.
- Schools are B-rated — typically a magnet for longer-tenancy family renters. What's the average tenant stay here, and is there a school-zone premium baked into asking?
- Crime grade is D in this area — have there been break-ins, vandalism, or insurance claims at this property in the last 3 years? What carrier currently insures it and at what premium?
- The area grade is low — what's the realistic commute time and amenity access for the typical tenant pool here? Any planned neighborhood developments (good or bad) we should know about?
- What's the average days-on-market for RENTAL listings here right now (not sales)? A rising rental-DOM trend means longer vacancies and softer asking-rent achievability than the comps imply.
- What's the recent tenant-quality profile in this submarket — average credit score on applications, eviction rate, late-payment / NSF rate, and stable-employment percentage? A property-management company in the area should have these aggregated.
- How much new for-sale + rental construction is in the pipeline within 1–3 miles? Heavy new supply typically softens prices + rents 12–24 months out; constrained supply supports both.
Investment metrics
- 1% rule
- 0.05% ✗
- Cap rate
- -0.69%
- Cash-on-cash
- -24.95%
- DSCR
- -0.11
- GRM
- 169.5
CMA / ARV
- ARV (median comp)
- $1,525,000
- List price
- $3,000,000
- Delta
- 96.72%
- Verdict
- OVERPRICED
- Comps
- 1 within 2.0 mi
Show comp detail 1 sale within ~0.75 mi
| Address | Dist | Beds/Ba | Sqft | Sold | Price | $/sf | Match |
|---|---|---|---|---|---|---|---|
| 1228 W James St | 0.32mi | 15/18.0 | 8,709 (+8%) | 4mo | $2,650,000 | $304 | 69 |
Match score weights: distance 35% · size 25% · config 20% · recency 20%. Top-matched comps best support the ARV.
Projected returns pro-forma
-3.0% appreciation · 2.01% rent growth · sell at horizon
- IRR
- -72.6%
- Equity multiple
- -0.91×
- Total profit
- $-1,601,397
- Equity at exit
- $447,310
- IRR
- —
- Equity multiple
- -2.38×
- Total profit
- $-2,838,051
- Equity at exit
- $259,385
Cash invested: $840,000 (down + closing). Projections, not guarantees.
Landlord ↔ Tenant lean methodology
- Overall (STATE)
- 92 Strongly Landlord-Friendly
- State Arkansas
- 92 Strongly Landlord-Friendly · R+14
- County
- — inherits STATE
- City
- — inherits STATE
ZIP-level market 72703
- Rents YoY
- 2.0%
- Active inventory
- 309
- Price-to-rent
- 169.5×
Monthly cashflow live
- Estimated rent
- $1,475 medium interval (Pro) →
- Mortgage (P&I)
- −$15,732
- Tax from tax record
- −$1,651 /mo · $19,811/yr
- Insurance
- −$1,250
- HOA
- −$0
- Vacancy / Maint / Mgmt
- −$310
- Net cashflow
- $-17,468
Break-even live
UW: 25.0% down · 7.5% · 30yr · 1.5% tax · 5.0% vac · 8.0% maint · 8.0% mgmt
Financing live
Cash to close
- Down payment
- $750,000
- Closing costs
- $90,000
- Reserves months
- —
- Total cash needed
- —
Loan-product check · same deal, 3 products live
Conventional
25% down · 7.5% · 30yr
- Down + closing
- —
- Monthly P&I
- —
- Monthly cashflow
- —
- DSCR
- —
- Eligible?
- —
Personal DTI + credit; lowest rate.
DSCR
20% down · 8.5% · 30yr
- Down + closing
- —
- Monthly P&I
- —
- Monthly cashflow
- —
- DSCR
- —
- Eligible?
- —
No personal income docs; deal must DSCR.
Hard money
10% down · 12.0% · 12mo
- Down + closing
- —
- Monthly P&I
- —
- Monthly cashflow
- —
- DSCR
- —
- Eligible?
- —
Short-term bridge; refi at stabilization.
Listing history 34 events
-
2026-06-18days on market $3,000,000 Active 59 DOM
-
2026-06-17days on market $3,000,000 Active 58 DOM
-
2026-06-16days on market $3,000,000 Active 57 DOM
-
2026-06-15days on market $3,000,000 Active 56 DOM
-
2026-06-14days on market $3,000,000 Active 54 DOM
-
2026-06-13days on market $3,000,000 Active 53 DOM
-
2026-06-10days on market $3,000,000 Active 51 DOM
-
2026-06-09days on market $3,000,000 Active 50 DOM
-
2026-06-08days on market $3,000,000 Active 49 DOM
-
2026-06-07days on market $3,000,000 Active 48 DOM
-
2026-06-05days on market $3,000,000 Active 45 DOM
-
2026-06-03days on market $3,000,000 Active 44 DOM
-
2026-06-02days on market $3,000,000 Active 43 DOM
-
2026-06-01days on market $3,000,000 Active 42 DOM
-
2026-05-31days on market $3,000,000 Active 41 DOM
-
2026-05-31days on market $3,000,000 Active 40 DOM
-
2026-05-16$1,050
-
2026-05-15historical $1,050
-
2026-04-20$3,000,000 Active 1025-char remark
Show marketing remark (1025 chars)
Arbor Vine is a 20-unit well-located multifamily property consisting of all two-bedroom units with significant capital improvements over the past five years including new roofs, siding, HVAC units, decks, and full interior renovations featuring LVP floors, granite counters, black appliances, and smart home thermostats. The property carries zero deferred maintenance and offers an ideal location for student and workforce housing, with close proximity to the University of Arkansas, major employers, and walkable retail and dining. Each unit is individually metered for water and electric and includes full-size washers, dryers, and dishwashers. Despite its fully renovated condition, current rents trail comparable properties by $200–$300 per month, representing immediate upside for a new owner. Additional value-add opportunities include introducing pet rent, admin fees, and trash/pest billing — none of which are currently charged — as well as reducing the above-market landscaping cost of $439/month.
-
2026-02-26price $1,050
-
2026-01-28$975
-
2026-01-24historical $975
-
2025-11-08$975
-
2025-11-07historical $975
-
2025-10-11$975
-
2025-10-10historical $975
-
2025-09-16$975
-
2025-09-16historical $975
-
2025-08-20$975
-
2024-12-11historical $1,050
-
2024-09-24$1,050
-
2013-11-15soldstatus $760,000
-
2006-12-01soldstatus $800,000
-
2005-12-05soldstatus $1,097,848
ⓘ Source: listings_history table (triggers on properties + properties_extension) + one-shot
backfill from property_details.listing_events for pre-trigger history.
Tax reassessment forecast AR · Resets to sale price
- Current annual tax
- $19,811 · $1,651/mo
- Projected year-2 tax
- $19,811 · $1,651/mo
- Expected delta
- $0/yr ($0/mo · 0.0%)
ⓘ Screening estimate from a state-policy table — verify with the county assessor before closing.
Climate risk First Street
- Flood 1/10 Low FEMA zone X (unshaded) · 0% chance over 30 yrs
- Wildfire 2/10 Low
- Heat 5/10 Major 7 d/yr ≥106°F today · 21 d/yr by 30 yrs out
- Wind 2/10 Low 2% chance of damaging wind over 30 yrs
- Air quality 1/10 Low 0 unhealthy d/yr today · 0 by 30 yrs out
Nearby sold comps map
Loading sold comps map…
Walkable amenities ~0.75 mi
Loading nearby amenities…
Taxation est. · year 1
- Rental income
- $17,701
- − Mortgage interest
- −$168,047
- − Property taxes
- −$19,811
- − Insurance
- −$15,000
- − Repairs & maintenance
- −$1,416
- − Management
- −$1,416
- − Depreciation
- −$87,273
- Taxable loss
- −$275,262
- Est. tax savings @ 24.0%
- +$66,063
- After-tax cash flow
- $-143,553/yr
For passive investors: Depreciation is non-cash, so a rental often shows a tax loss while cash-flowing — sheltering income. Rental losses are passive: they offset passive income freely, and up to $25,000/yr can offset ordinary (W-2) income if you actively participate and your MAGI is under $100k (phasing out to $0 by $150k); unused losses carry forward. On sale, claimed depreciation is recaptured at up to 25%, and gains may owe capital-gains tax (a 1031 exchange can defer both). Figures are a year-1 estimate at your 24.0% rate — not tax advice; consult a CPA.
Schools (NCES district)
- District
- Fayetteville School District
- NCES district ID
- 0506120
- Math proficiency
- 50% ▼ -11.00%
- Reading proficiency
- 49% ▼ -8.00%
- Median HH income
- $39,595
- Composite
- 41.39/100
- National rank
- #3477
- State rank
- #19 of 238 in AR
Livability — Fayetteville
- Score
- 83/100
- State rank
- #3
- US rank
- #871
Category grades
Schools grade is shown separately in the Schools card above.
Census & demographics
- Census place
- Fayetteville, AR
- County
- Washington County · 252,056 people
- City population
- 118,228
- Metro
- Fayetteville-Springdale-Rogers, AR
- Population (ZIP)
- 35,896
- Household income
- $60,568
- Rent vs Own
- Severe rent burden
- 2372.0
Population outlook (Washington County) Hauer SSP2
- Today (2025)
- 271,748 people
- By 2030
- 296,414 · +9.1%
- By 2040
- 346,874 · +27.6%
- By 2050
- 398,552 · +46.7%
- By 2075
- 523,309 · +92.6%
- By 2100
- 615,280 · +126.4%
Race, ethnicity, and origin ACS 2023
- Neighborhood character
- Predominantly White (75%)
- Race & ethnicity
- White 75% Two or more races 12% Hispanic / Latino 7% Black 5% Asian 3%
- Hispanic origin (detail)
- Mexican 4%
- Common ancestry
- Lithuanian 3% Slovak 2% Italian 2%
- Foreign-born
- 7% · Canada, China
- Languages at home
- 92% English-only · Spanish 3% Chinese 1% French/Haitian/Cajun 1%
Political lean MEDSL · Washington
- 2024 margin
- Lean R (+6.7) · D 45.1% · R 51.7% · Other 3.2%
- 2008→2024 swing
- +6.4pp toward D · 2008: -13.1pp · 2024: -6.7pp
- All cycles
- 2024: R+6.7 2020: R+3.9 2016: R+10.4 2012: R+16.3 2008: R+13.1
Not yet ingested
- Civics
- —
Market trends
- HPI YoY
- ▼ -269.77%
- Current HPI
- 317.7085
- Rent YoY
- ▲ 2.01%
- Metro
- Fayetteville-Springdale-Rogers, AR
- State GDP YoY
- ▲ 3.80%
- F500 in state
- 10
Industry mix (Fortune 500 HQ in AR)
| Industry | F500 HQs | Revenue |
|---|---|---|
| Retail | 1 | $681B |
|
||
| Food / Agriculture | 1 | $53B |
|
||
| Retail / Energy | 1 | $22B |
|
||
| Transportation / Logistics | 1 | $12B |
|
||
| Energy | 1 | $4B |
|
||
Price history
-99.9% since first listed18 events — show timeline
- 2026-05-16 Listed for Rent $1,050 NWARMLS
- 2026-05-15 Rental Removed $1,050 NWARMLS
- 2026-04-20 Listed $3,000,000 NWARMLS
- 2026-02-26 Price Changed $1,050 NWARMLS
- 2026-01-28 Listed for Rent $975 NWARMLS
- 2026-01-24 Rental Removed $975 NWARMLS
- 2025-11-08 Listed for Rent $975 NWARMLS
- 2025-11-07 Rental Removed $975 NWARMLS
- 2025-10-11 Listed for Rent $975 NWARMLS
- 2025-10-10 Rental Removed $975 NWARMLS
- 2025-09-16 Listed for Rent $975 NWARMLS
- 2025-09-16 Rental Removed $975 NWARMLS
- 2025-08-20 Listed for Rent $975 NWARMLS
- 2024-12-11 Rental Removed $1,050 NWARMLS
- 2024-09-24 Listed for Rent $1,050 NWARMLS
- 2013-11-15 Sold (Public Records) $760,000 Public Records
- 2006-12-01 Sold (Public Records) $800,000 Public Records
- 2005-12-05 Sold (Public Records) $1,097,848 Public Records
Property tax history
+17.4%/yrLatest (2025): $19,811 · +0.0% YoY. Source: county tax records.
Cash-flow waterfall
monthlySold comps — $/sqft
last 12 mo · ≤1 miLoading sold comps…