 🌊 Lakefront
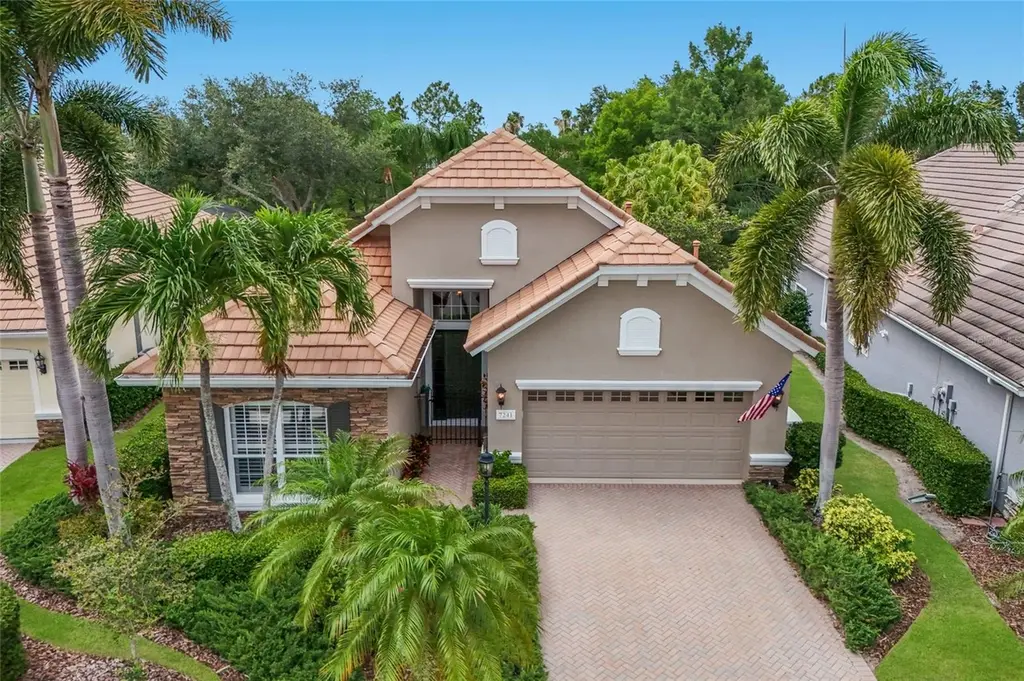
7241 Orchid Island Pl · Lakewood Ranch, FL
Flood risk 1/10 · Minimal
- FEMA flood zone
- X (unshaded)
- Chance of flooding over 30 yrs
- 0.0%
- Est. flood insurance / yr
- $507 – $1,088
Fire risk 4/10 · Minor
- Est. fire insurance / yr
- $947 – $1,759
Heat risk 10/10 · Severe
- Hot days now (above 108°F)
- 7 days/yr
- Hot days in 30 yrs
- 29 days/yr
Wind risk 10/10 · Severe
- Chance of severe wind over 30 yrs
- 99.0%
Air-quality risk 3/10 · Minor
- Unhealthy air days now
- 2 days/yr
- Unhealthy air days in 30 yrs
- 2 days/yr
Risk factors via First Street. Map © Google.
Why this score? — see what drove the D+ grade
The composite is a weighted blend of 9 inputs, each scored 0–100. Each bar is that input's sub-score; the figure is the points it added to the 100-point composite (weight × sub-score).
- ARV discount +15.0/15.0
- Cash flow +9.6/30.0
- Appreciation +4.4/10.0
- Schools +4.4/10.0
- 1% rule +3.3/10.0
- DSCR +2.7/10.0
- Livability +2.5/5.0
- Condition / age +2.5/5.0
- Rent growth +2.4/5.0
$589,000
🖨 Deal sheet 📄 Offer letter ✓ Due diligence
Listing remarks
Equipped with a whole-house generator, this charming and spacious 2,260 sq. ft. residence in the gated, maintenance-free enclave of Orchid Island within the Lakewood Ranch Golf & Country Club offers comfort, quality, and serene lakefront surroundings. Thoughtfully designed, the home features an expansive primary suite with a sitting area, two oversized walk-in closets, dual vanities, soaking tub, and walk-in shower, along with a generous guest en suite and a spacious den or office complete with double-door pocket entry and custom built-ins. Interior appointments include wood flooring throughout, crown moldings, and tray ceilings. A generously sized flex space positioned off the main l
Key facts
- Dual vanities
- 7,910 sq ft lot
- 2 garage spots
Tags
Property features AI
Finance
- Other: Lease restrictions apply; Pets allowed; Community features: golf, pool, sidewalks, golf carts allowed
- Financial info: Other annual assessment amount $3,268; Total annual fees $2,958 (total monthly $246.50)
- HOA & community: Has HOA (Lakewood Ranch Townhall); Monthly HOA fee of $12.50; Annual association fee $150; Additional monthly maintenance amount $234; Association approval required; Association amenities include pool, maintenance of grounds, security, vehicle restrictions, gated access
Exterior
- Parking: Attached garage (2 spaces)
- Security: Gated community; Community security included with association
- Utilities: Public water; Public sewer; Electricity connected; Natural gas connected; Cable available; BB/HS internet available; Phone available
- Home design: Single family residence; One story; Faces south; Residential property in a gated community; Located on a lot of approximately 0.18 acres; Lake view
- Construction: Stucco construction; Tile roof; Slab foundation; Built with living area recorded at 2260 square feet
- Exterior features: Patio (screened); Exterior lighting; Rain gutters; Sliding doors
Interior
- Kitchen: Dishwasher; Range; Microwave; Refrigerator
- Bedrooms: 2 bedrooms
- Flooring: Tile; Wood
- Bathrooms: 2 full bathrooms
- Heating & cooling: Central heating; Central air
- Interior features: Attic ventilator; Built-in features; Ceiling fans; Crown molding; High ceilings; Open floorplan; Tray ceilings; Walk-in closets; Window treatments; Shutters
- Laundry & utility: Washer; Dryer; Laundry room inside
Neighborhood map
What this means for you Summary
Snapshot
- This is a 2-bed/2.0-bath single-family listed at $589k.
Deal economics
- At list price, monthly cash flow is $-401 ($-5k/yr) — negative.
- To cash-flow at today's rent, offer at most $518k (12.0% below list).
- To meet the 1% rule (rent ≥ 1% of price), the offer needs to be $488k (17.1% below list).
- Recommended offer: $488k (17.1% below list) — sets the bar for 1% rule.
- Cap rate 5.5% vs local median 3.3% in Lakewood Ranch — top-decile yield for the area; either an underpriced asset or a hidden risk that comps aren't pricing in. Stress-test before assuming the spread holds.
Location & tenants
- Location reads: area grade D — affects rentability + tenant quality, not the cash-flow math above.
- Manatee (suburban): math 54% / reading 50% proficiency, ranked #26 of 73 in FL (top 36%) — acceptable for families but not a draw, mixed tenant base, ~2y average lease.
- Zoned schools: Robert Willis Elementary School (math 83% / reading 79%, grade A+, #95 of 2,144 statewide, top 5%, 765 students, 22% FRL); Lakewood Ranch High School (math 47% / reading 63%, grade C, #135 of 667 statewide, top 20%, 2,435 students, 22% FRL) — zoned schools average 22% FRL vs 51% district-wide (28 pts lower); this property's tenant base skews higher-income than the district average.
- Zoned-school proficiency averages 68% at this address vs 52% district-wide (+16 pts) — the actual schools serving this property are materially stronger than the Manatee average implies; a family-tenant draw the district grade alone would hide.
- Market conditions: Rents soft (-0.5%/yr); 497 active listings in the ZIP; 10 comparable units currently listed for rent nearby; rentals at typical pace (median 24d on market — plan ~3-4 weeks tenant-placement turnaround); high-income renter base; 7,472 units permitted in Manatee County in 2024 (1,782 in 5+ unit buildings).
- At $4,883/mo this rent would consume 48% of the median local household income ($122k/yr) (locally 574% of renters already pay >50% of income on rent) — very limited rent-growth headroom before tenants either downsize or default.
Forward outlook
- Local home prices are declining (-1.2%/yr); year-one equity from $4k of loan paydown is wiped out by about $7k of value loss. Plan a longer hold.
- Manatee County population projected at +43% by 2050 — long-run rental-demand tailwind backs the buy-and-hold thesis.
Negotiation context
- It's been on market 15 days — a 2% lower offer ($580k) is reasonable based on typical stale-listing flexibility.
- 3 sale attempts with the ask held roughly flat each time — persistent listings suggest the price (not the market) is what's stuck; bring a comps-based counter.
- Current owner paid $458k; 29% above their basis — modest negotiation headroom, anchor on the comps not their cost.
Risks & watch-outs
- Climate carrying-cost: severe wind risk, 99% chance of damaging wind over 30y; extreme-heat days projected 7→29/yr by 2055 (HVAC capex compounding) — expect insurance premiums to compound above CPI over the hold.
Questions for the listing agent
- What do current leases actually rent for vs. the listed asking? Can we see a recent rent roll and the last 12 months of T-12 income?
- What does the HOA fee cover, when was the last increase, and are there any pending special assessments or reserve-fund shortfalls?
- Is there a deadline driving the sale (1031 exchange, divorce, estate, relocation)? That informs how much negotiation room exists.
- The area grade is low — what's the realistic commute time and amenity access for the typical tenant pool here? Any planned neighborhood developments (good or bad) we should know about?
- This sits on a lake — are riparian / water-frontage rights deeded with the parcel? Any dock permits, shoreline easements, or HOA water-use restrictions?
- What's the documented flood / surge / shoreline-erosion history here (FEMA AND non-FEMA — e.g., storm surge, creek backup, septic-field saturation)?
- Any water-quality or seasonal algae-bloom issues that affect tenant satisfaction or short-term-rental demand?
- What's the average days-on-market for RENTAL listings here right now (not sales)? A rising rental-DOM trend means longer vacancies and softer asking-rent achievability than the comps imply.
- What's the recent tenant-quality profile in this submarket — average credit score on applications, eviction rate, late-payment / NSF rate, and stable-employment percentage? A property-management company in the area should have these aggregated.
- How much new for-sale + rental construction is in the pipeline within 1–3 miles? Heavy new supply typically softens prices + rents 12–24 months out; constrained supply supports both.
Investment metrics
- 1% rule
- 0.83% ✗
- Cap rate
- 5.48%
- Cash-on-cash
- -2.92%
- DSCR
- 0.87
- GRM
- 10.1
CMA / ARV
- ARV (on-the-fly)
- $766,140
- Comps found
- 12
Show comp detail 12 sales within ~0.75 mi
| Address | Dist | Beds/Ba | Sqft | Sold | Price | $/sf | Match |
|---|---|---|---|---|---|---|---|
| 7249 Orchid Island Pl | 0.02mi | 3/2.0 (+1) | 2,235 (-1%) | 1mo | $613,400 | $274 | 91 |
| 13828 Siena Loop | 0.06mi | 3/2.0 (+1) | 2,311 (+2%) | 1mo | $799,000 | $346 | 88 |
| 7137 Orchid Island Pl | 0.12mi | 2/2.0 | 2,326 (+3%) | 2mo | $585,000 | $252 | 88 |
| 13844 Siena Loop | 0.05mi | 2/2.0 | 2,134 (-6%) | 5mo | $619,425 | $290 | 84 |
| 13861 Siena Loop | 0.10mi | 3/2.0 (+1) | 2,134 (-6%) | 3mo | $610,000 | $286 | 78 |
| 7448 Riviera Cv | 0.30mi | 3/2.5 (+1) | 2,436 (+8%) | 2mo | $825,000 | $339 | 64 |
| 7232 Presidio Gln | 0.60mi | 3/2.0 (+1) | 2,160 (-4%) | 0mo | $650,000 | $301 | 60 |
| 7753 US Open Loop | 0.66mi | 2/2.0 | 2,131 (-6%) | 1mo | $765,000 | $359 | 59 |
| 14725 Newtonmore Ln | 0.60mi | 3/2.0 (+1) | 2,109 (-7%) | 4mo | $825,000 | $391 | 52 |
| 7626 Desert Inn Way | 0.73mi | 3/2.0 (+1) | 2,145 (-5%) | 3mo | $530,000 | $247 | 50 |
| 14519 Leopard Creek Pl | 0.48mi | 3/2.5 (+1) | 2,556 (+13%) | 3mo | $1,150,000 | $450 | 46 |
| 7012 Twin Hills Ter | 0.58mi | 3/3.0 (+1) | 2,487 (+10%) | 3mo | $999,999 | $402 | 45 |
Match score weights: distance 35% · size 25% · config 20% · recency 20%. Top-matched comps best support the ARV.
Projected returns pro-forma
-1.2% appreciation · 0.0% rent growth · sell at horizon
- IRR
- -13.1%
- Equity multiple
- 0.46×
- Total profit
- $-89,258
- Equity at exit
- $136,579
- IRR
- -9.3%
- Equity multiple
- 0.26×
- Total profit
- $-122,530
- Equity at exit
- $138,701
Cash invested: $164,920 (down + closing). Projections, not guarantees.
Landlord ↔ Tenant lean methodology
- Overall (STATE)
- 87 Strongly Landlord-Friendly
- State Florida
- 87 Strongly Landlord-Friendly · R+3
- County
- — inherits STATE
- City
- — inherits STATE
ZIP-level market 34202
- Home prices YoY
- -0.5%
- Rents YoY
- -0.5%
- Active inventory
- 497
- Price-to-rent
- 10.1×
Monthly cashflow live
- Estimated rent
- $4,883 high interval (Pro) →
- Mortgage (P&I)
- −$3,089
- Tax from tax record
- −$678 /mo · $8,142/yr
- Insurance
- −$245
- HOA
- −$246
- Vacancy / Maint / Mgmt
- −$1,026
- Net cashflow
- $-401
Break-even live
UW: 25.0% down · 7.5% · 30yr · 1.5% tax · 5.0% vac · 8.0% maint · 8.0% mgmt
Financing live
Cash to close
- Down payment
- $147,250
- Closing costs
- $17,670
- Reserves months
- —
- Total cash needed
- —
Loan-product check · same deal, 3 products live
Conventional
25% down · 7.5% · 30yr
- Down + closing
- —
- Monthly P&I
- —
- Monthly cashflow
- —
- DSCR
- —
- Eligible?
- —
Personal DTI + credit; lowest rate.
DSCR
20% down · 8.5% · 30yr
- Down + closing
- —
- Monthly P&I
- —
- Monthly cashflow
- —
- DSCR
- —
- Eligible?
- —
No personal income docs; deal must DSCR.
Hard money
10% down · 12.0% · 12mo
- Down + closing
- —
- Monthly P&I
- —
- Monthly cashflow
- —
- DSCR
- —
- Eligible?
- —
Short-term bridge; refi at stabilization.
Rent comps 10 comps
| Address | Beds | Baths | Sqft | Rent | $/sqft | DOM | Units | Dist |
|---|---|---|---|---|---|---|---|---|
| 7236 Orchid Island Pl Bradenton, FL | 3.0 | 3.0 | 2289 | $7,800 | $3.41 | 23d | 1 | 0.02mi |
| 7423 Riviera Cv Lakewood Ranch, FL | 3.0 | 2.0 | 1970 | $3,000 | $1.52 | 3d | 1 | 0.39mi |
| 7236 Presidio Gln Lakewood Ranch, FL | 2.0 | 2.0 | 2153 | $3,500 | $1.63 | 23d | 1 | 0.61mi |
| 8044 Gulfstream Ct Bradenton, FL | 3.0–4.0 | 2.5–3.0 | 1861 | $2,711 | $1.46 | 3d | 6 | 0.63mi |
| 14551 Whitemoss Ter Lakewood Ranch, FL | 3.0 | 2.0 | 2148 | $3,700 | $1.72 | 23d | 1 | 0.76mi |
| 8263 Miramar Way Lakewood Ranch, FL | 3.0 | 2.0 | 1812 | $4,000 | $2.21 | 3d | 1 | 0.87mi |
| 8263 Miramar Way Lakewood Ranch, FL | 3.0 | 2.0 | 1812 | $4,000 | $2.21 | 23d | 1 | 0.87mi |
| 8261 Miramar Way #202 Lakewood Ranch, FL | 3.0 | 2.0 | 1812 | $2,750 | $1.52 | 23d | 1 | 0.87mi |
| 7328 Lake Forest Gln Lakewood Ranch, FL | 3.0 | 2.0 | 1876 | $5,000 | $2.67 | 23d | 1 | 0.96mi |
| 8363 Miramar Way Unit 203 Lakewood Ranch, FL | 3.0 | 2.0 | 1812 | $2,700 | $1.49 | 20d | 1 | 0.98mi |
HOA detail
- Monthly dues
- $246 · $2,952/yr
- Likely covers
- security
Listing history 13 events
-
2026-06-18days on market $589,000 Active 15 DOM
-
2026-06-17price $589,000 Active 14 DOM
-
2026-06-17days on market $599,000 Active 14 DOM
-
2026-06-16days on market $599,000 Active 13 DOM
-
2026-06-15days on market $599,000 Active 12 DOM
-
2026-06-13days on market $599,000 Active 10 DOM
-
2026-06-13days on market $599,000 Active 9 DOM
-
2026-06-10days on market $599,000 Active 7 DOM
-
2026-06-09days on market $599,000 Active 6 DOM
-
2026-06-08days on market $599,000 Active 5 DOM
-
2026-06-07days on market $599,000 Active 4 DOM
-
2026-06-03remarks 695-char remark
-
2026-06-03$599,000 Active 1 DOM
ⓘ Source: listings_history table (triggers on properties + properties_extension) + one-shot
backfill from property_details.listing_events for pre-trigger history.
Tax reassessment forecast FL · Resets to sale price
- Current annual tax
- $8,142 · $678/mo
- Projected year-2 tax
- $8,142 · $678/mo
- Expected delta
- $0/yr ($0/mo · 0.0%)
ⓘ Screening estimate from a state-policy table — verify with the county assessor before closing.
Climate risk First Street
- Flood 1/10 Low FEMA zone X (unshaded) · 0% chance over 30 yrs
- Wildfire 4/10 Moderate
- Heat 10/10 Extreme 7 d/yr ≥108°F today · 29 d/yr by 30 yrs out
- Wind 10/10 Extreme 99% chance of damaging wind over 30 yrs
- Air quality 3/10 Moderate 2 unhealthy d/yr today · 2 by 30 yrs out
Nearby sold comps map
Loading sold comps map…
Walkable amenities ~0.75 mi
Loading nearby amenities…
Taxation est. · year 1
- Rental income
- $58,602
- − Mortgage interest
- −$32,993
- − Property taxes
- −$8,142
- − Insurance
- −$2,945
- − Repairs & maintenance
- −$4,688
- − Management
- −$4,688
- − HOA
- −$2,952
- − Depreciation
- −$17,135
- Taxable loss
- −$14,941
- Est. tax savings @ 24.0%
- +$3,586
- After-tax cash flow
- $-1,223/yr
For passive investors: Depreciation is non-cash, so a rental often shows a tax loss while cash-flowing — sheltering income. Rental losses are passive: they offset passive income freely, and up to $25,000/yr can offset ordinary (W-2) income if you actively participate and your MAGI is under $100k (phasing out to $0 by $150k); unused losses carry forward. On sale, claimed depreciation is recaptured at up to 25%, and gains may owe capital-gains tax (a 1031 exchange can defer both). Figures are a year-1 estimate at your 24.0% rate — not tax advice; consult a CPA.
Schools (NCES district)
- District
- Manatee
- NCES district ID
- 1201230
- Math proficiency
- 54% ▼ -6.00%
- Reading proficiency
- 50% ▼ -2.00%
- Median HH income
- $49,607
- Composite
- 44.43/100
- National rank
- #2806
- State rank
- #26 of 73 in FL
Livability — Lakewood Ranch
No livability data for this city. (Only ~50 U.S. cities are tracked.)
Census & demographics
- Census place
- Lakewood Ranch, FL
- County
- Manatee County · 416,364 people
- City population
- 52,177
- Metro
- North Port-Sarasota-Bradenton, FL
- Population (ZIP)
- 27,197
- Household income
- $121,659
- Rent vs Own
- Severe rent burden
- 574.0
Population outlook (Manatee County) Hauer SSP2
- Today (2025)
- 447,342 people
- By 2030
- 488,911 · +9.3%
- By 2040
- 567,934 · +27.0%
- By 2050
- 637,995 · +42.6%
- By 2075
- 781,970 · +74.8%
- By 2100
- 848,272 · +89.6%
Race, ethnicity, and origin ACS 2023
- Neighborhood character
- Predominantly White (80%)
- Race & ethnicity
- White 80% Two or more races 10% Hispanic / Latino 9% Asian 3% Black 2%
- Hispanic origin (detail)
- Puerto Rican 4% Cuban 2%
- Common ancestry
- Romanian 4% Italian 4% Slovak 3%
- Foreign-born
- 12% · Canada, Vietnam, China
- Languages at home
- 88% English-only · Spanish 5% Arabic 1% Other Asian/Pacific 1%
Political lean MEDSL · Manatee
- 2024 margin
- Strong R (+23.5) · D 37.9% · R 61.4%
- 2008→2024 swing
- -16.5pp toward R · 2008: -7.0pp · 2024: -23.5pp
- All cycles
- 2024: R+23.5 2020: R+16.1 2016: R+17.1 2012: R+12.5 2008: R+7.0
Not yet ingested
- Civics
- —
Market trends
- HPI YoY
- ▼ -1.20%
- Current HPI
- 240.7087
- Rent YoY
- ▼ -0.54%
- Metro
- North Port-Sarasota-Bradenton, FL
- State GDP YoY
- ▲ 3.28%
- F500 in state
- 36
Industry mix (Fortune 500 HQ in FL)
| Industry | F500 HQs | Revenue |
|---|---|---|
| Industrial Technology | 2 | $29B |
|
||
| Insurance | 2 | $17B |
|
||
| Retail | 1 | $60B |
|
||
| Technology Distribution | 1 | $58B |
|
||
| Homebuilding | 1 | $35B |
|
||
| Technology Manufacturing | 1 | $35B |
|
||
Price history
+30.9% since first listed8 events — show timeline
- 2026-06-03 Listed $599,000 Stellar MLS as Distributed by MLS Grid
- 2026-05-20 Listing Removed — Stellar MLS as Distributed by MLS Grid
- 2026-04-09 Price Changed $599,900 Stellar MLS as Distributed by MLS Grid
- 2026-03-11 Relisted — Stellar MLS as Distributed by MLS Grid
- 2026-03-03 Pending — Stellar MLS as Distributed by MLS Grid
- 2026-02-13 Price Changed $604,500 Stellar MLS as Distributed by MLS Grid
- 2025-11-13 Listed $624,500 Stellar MLS as Distributed by MLS Grid
- 2002-07-01 Sold (Public Records) $457,700 Public Records
Property tax history
+2.1%/yrLatest (2025): $8,142 · +3.5% YoY. Source: county tax records.
Cash-flow waterfall
monthlySold comps — $/sqft
last 12 mo · ≤1 miLoading sold comps…