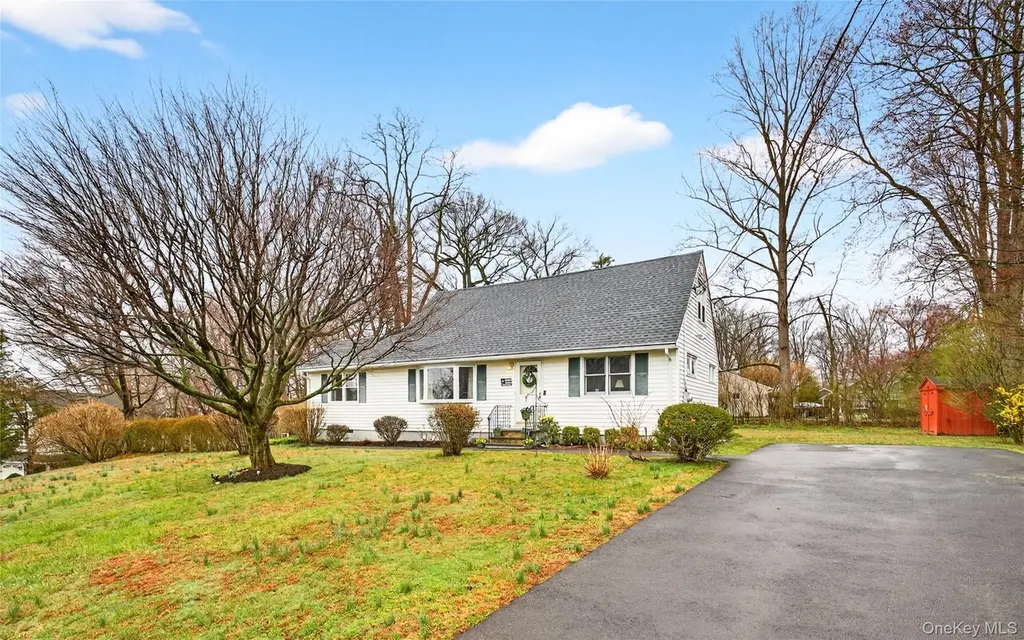
107 Whittier Dr · Thornwood, NY
Flood risk 1/10 · Minimal
- FEMA flood zone
- X (unshaded)
- Chance of flooding over 30 yrs
- 0.0%
- Est. flood insurance / yr
- $473 – $860
Fire risk 2/10 · Minimal
- Est. fire insurance / yr
- $691 – $1,283
Heat risk 5/10 · Moderate
- Hot days now (above 98°F)
- 7 days/yr
- Hot days in 30 yrs
- 15 days/yr
Wind risk 6/10 · Moderate
- Chance of severe wind over 30 yrs
- 27.0%
Air-quality risk 4/10 · Minor
- Unhealthy air days now
- 4 days/yr
- Unhealthy air days in 30 yrs
- 6 days/yr
Risk factors via First Street. Map © Google.
Why this score? — see what drove the F grade
The composite is a weighted blend of 9 inputs, each scored 0–100. Each bar is that input's sub-score; the figure is the points it added to the 100-point composite (weight × sub-score).
- Schools +6.0/10.0
- ARV discount +5.2/15.0
- Livability +3.6/5.0
- Cash flow +2.5/30.0
- Rent growth +2.5/5.0
- Condition / age +2.5/5.0
- 1% rule +0.0/10.0
- DSCR +0.0/10.0
- Appreciation +0.0/10.0
$825,000
🖨 Deal sheet 📄 Offer letter ✓ Due diligence
Listing remarks
Bathed in sunshine on the desirable sunny side of the street, this classic four-bedroom Cape offers a wonderful blend of charm, comfort, and everyday convenience. From the moment you step inside, you’re welcomed by a warm, inviting atmosphere that instantly feels like home. Generously sized rooms with wood floors, help to create a sense of ease and livability, while the eat-in kitchen provides the perfect gathering space for casual meals and conversation. A tastefully renovated first-floor bath features a step-in shower, adding modern comfort and convenience. One of the home’s most thoughtful features is the oversized pantry with direct access to the backyard—ideal as a pr
Key facts
- Eat-in kitchen
- Stone patio
- Oversized pantry
Tags
Property features AI
Exterior
- Parking: Driveway parking; On-street parking; Total of 4 parking spaces
- Utilities: Con-Edison electric; Natural gas connected; Public water; Public sewer; Trash collection (public); Cable available
- Home design: Single family residence; Two stories; Measured living area
- Construction: Vinyl siding; Built with a full, unfinished basement
- Exterior features: Back and front yard; Landscaped yard; Sloped lot; Backyard fencing; Patio
Interior
- Kitchen: Granite counters; Eat-in and galley-style layout; Gas oven; Dishwasher; Refrigerator
- Bedrooms: Two-level home with bedroom(s) on the first floor
- Flooring: Wood flooring; Tile flooring
- Bathrooms: 2 full bathrooms
- Heating & cooling: Natural gas heating; Wall/window air conditioning units
- Interior features: First-floor bedroom; First-floor full bathroom; Eat-in kitchen; Formal dining room; Galley-style kitchen; Granite countertops; Washer/dryer hookup; Patio
- Laundry & utility: Washer and dryer included; Laundry located in basement; Full unfinished basement
Neighborhood map
What this means for you Summary
Snapshot
- This is a 2-bed/1.0-bath single-family listed at $825k.
Deal economics
- At list price, monthly cash flow is $-3k ($-34k/yr) — negative.
- To cash-flow at today's rent, offer at most $318k (61.4% below list).
- To meet the 1% rule (rent ≥ 1% of price), the offer needs to be $333k (59.6% below list).
- Recommended offer: $318k (61.4% below list) — sets the bar for cash-flow.
- Cap rate 2.1% vs local median 5.7% in Thornwood — below-typical yield; the buyer is paying a premium for something (appreciation thesis, condition, location) that the cap rate doesn't capture.
Location & tenants
- Location reads 71/100 on livability (#389 in NY) — a middle-class / working-renter tenant base. Strengths: crime A+, employment A+, housing A+; Watch: amenities F, commute F, cost of living F.
- Mount Pleasant Central School District (suburban): math 62% / reading 65% proficiency, ranked #146 of 590 in NY (top 25%) — acceptable for families but not a draw, mixed tenant base, ~2y average lease; only 5% free/reduced lunch — higher-income household profile.
- Zoned schools: Hawthorne Elementary School (460 students, 10% FRL); Westlake Middle School (math 55% / reading 61%, grade B, #184 of 729 statewide, top 25%, 429 students, 14% FRL); Westlake High School (math 72% / reading 95%, grade A, #409 of 1,100 statewide, top 39%, 547 students, 19% FRL).
- Market conditions: 33 active listings in the ZIP; 2 comparable units currently listed for rent nearby; 954 units permitted in Westchester County in 2024 (649 in 5+ unit buildings).
Forward outlook
- Local home prices are declining (-3.0%/yr); year-one equity from $6k of loan paydown is wiped out by about $25k of value loss. Plan a longer hold.
- Westchester County population projected at +10% by 2050 — modest demand growth; plan on rents tracking national, not racing it.
Negotiation context
- Only 13 days on market — expect competitive offers; lowballing is unlikely to land.
Risks & watch-outs
- Watch-outs: built in 1956 — expect roof / HVAC / electrical / plumbing capex.
- Climate carrying-cost: major wind risk, 27% chance of damaging wind over 30y; extreme-heat days projected 7→15/yr by 2055 (HVAC capex compounding) — expect insurance premiums to compound above CPI over the hold.
Questions for the listing agent
- What do current leases actually rent for vs. the listed asking? Can we see a recent rent roll and the last 12 months of T-12 income?
- Built in 1956 — when were the roof, HVAC, electrical panel, plumbing, and water heater last replaced?
- Is there a deadline driving the sale (1031 exchange, divorce, estate, relocation)? That informs how much negotiation room exists.
- Schools are A-rated — typically a magnet for longer-tenancy family renters. What's the average tenant stay here, and is there a school-zone premium baked into asking?
- The area grade is low — what's the realistic commute time and amenity access for the typical tenant pool here? Any planned neighborhood developments (good or bad) we should know about?
- What's the average days-on-market for RENTAL listings here right now (not sales)? A rising rental-DOM trend means longer vacancies and softer asking-rent achievability than the comps imply.
- What's the recent tenant-quality profile in this submarket — average credit score on applications, eviction rate, late-payment / NSF rate, and stable-employment percentage? A property-management company in the area should have these aggregated.
- How much new for-sale + rental construction is in the pipeline within 1–3 miles? Heavy new supply typically softens prices + rents 12–24 months out; constrained supply supports both.
Investment metrics
- 1% rule
- 0.40% ✗
- Cap rate
- 2.12%
- Cash-on-cash
- -14.90%
- DSCR
- 0.34
- GRM
- 20.6
CMA / ARV
- ARV (on-the-fly)
- $784,992
- Comps found
- 5
Show comp detail 5 sales within ~0.75 mi
| Address | Dist | Beds/Ba | Sqft | Sold | Price | $/sf | Match |
|---|---|---|---|---|---|---|---|
| 86 Bainbridge Ave | 0.27mi | 3/2.5 (+1) | 1,626 (-0%) | 23mo | $620,000 | $381 | 56 |
| 70 Highland Rd | 0.53mi | 3/2.5 (+1) | 1,656 (+2%) | 8mo | $800,000 | $483 | 55 |
| 5 Ridgeview Dr | 0.67mi | 3/2.0 (+1) | 1,605 (-2%) | 9mo | $790,000 | $492 | 49 |
| 21 Meadowbrook Rd | 0.58mi | 3/2.0 (+1) | 1,745 (+7%) | 16mo | $839,000 | $481 | 39 |
| 72 Westchester Ave | 0.39mi | 3/3.0 (+1) | 1,790 (+10%) | 21mo | $825,000 | $461 | 35 |
Match score weights: distance 35% · size 25% · config 20% · recency 20%. Top-matched comps best support the ARV.
Projected returns pro-forma
-3.0% appreciation · 3.0% rent growth · sell at horizon
- IRR
- -44.9%
- Equity multiple
- -0.37×
- Total profit
- $-316,484
- Equity at exit
- $123,010
- IRR
- -81.8%
- Equity multiple
- -1.21×
- Total profit
- $-511,172
- Equity at exit
- $71,331
Cash invested: $231,000 (down + closing). Projections, not guarantees.
Landlord ↔ Tenant lean methodology
- Overall (STATE)
- 15 Strongly Tenant-Friendly
- State New York
- 15 Strongly Tenant-Friendly · D+10
- County
- — inherits STATE
- City
- — inherits STATE
ZIP-level market 10594
- Home prices YoY
- -18.7%
- Active inventory
- 33
- Price-to-rent
- 20.6×
Monthly cashflow live
- Estimated rent
- $3,332 medium interval (Pro) →
- Mortgage (P&I)
- −$4,326
- Tax from tax record
- −$831 /mo · $9,976/yr
- Insurance
- −$344
- HOA
- −$0
- Vacancy / Maint / Mgmt
- −$700
- Net cashflow
- $-2,869
Break-even live
UW: 25.0% down · 7.5% · 30yr · 1.5% tax · 5.0% vac · 8.0% maint · 8.0% mgmt
Financing live
Cash to close
- Down payment
- $206,250
- Closing costs
- $24,750
- Reserves months
- —
- Total cash needed
- —
Loan-product check · same deal, 3 products live
Conventional
25% down · 7.5% · 30yr
- Down + closing
- —
- Monthly P&I
- —
- Monthly cashflow
- —
- DSCR
- —
- Eligible?
- —
Personal DTI + credit; lowest rate.
DSCR
20% down · 8.5% · 30yr
- Down + closing
- —
- Monthly P&I
- —
- Monthly cashflow
- —
- DSCR
- —
- Eligible?
- —
No personal income docs; deal must DSCR.
Hard money
10% down · 12.0% · 12mo
- Down + closing
- —
- Monthly P&I
- —
- Monthly cashflow
- —
- DSCR
- —
- Eligible?
- —
Short-term bridge; refi at stabilization.
Rent comps 2 comps
| Address | Beds | Baths | Sqft | Rent | $/sqft | DOM | Units | Dist |
|---|---|---|---|---|---|---|---|---|
| 665 Commerce St Thornwood, NY | 2.0 | 1.0 | 1120 | $2,700 | $2.41 | 22d | 1 | 0.97mi |
| 500 Commerce St Unit see remarks Hawthorne, NY | 2.0 | 1.0 | 1150 | $4,200 | $3.65 | 1d | 1 | 1.36mi |
Listing history 2 events
-
2026-05-05status Pending
-
2026-04-02$825,000 Active
ⓘ Source: listings_history table (triggers on properties + properties_extension) + one-shot
backfill from property_details.listing_events for pre-trigger history.
Tax reassessment forecast NY · Partial reset (capped growth)
- Current annual tax
- $9,976 · $831/mo
- Projected year-2 tax
- $11,959 · $997/mo
- Expected delta
- +$1,983/yr (+$165/mo · 19.9%)
ⓘ Screening estimate from a state-policy table — verify with the county assessor before closing.
Climate risk First Street
- Flood 1/10 Low FEMA zone X (unshaded) · 0% chance over 30 yrs
- Wildfire 2/10 Low
- Heat 5/10 Major 7 d/yr ≥98°F today · 15 d/yr by 30 yrs out
- Wind 6/10 Major 27% chance of damaging wind over 30 yrs
- Air quality 4/10 Moderate 4 unhealthy d/yr today · 6 by 30 yrs out
Nearby sold comps map
Loading sold comps map…
Walkable amenities ~0.75 mi
Loading nearby amenities…
Taxation est. · year 1
- Rental income
- $39,987
- − Mortgage interest
- −$46,213
- − Property taxes
- −$9,976
- − Insurance
- −$4,125
- − Repairs & maintenance
- −$3,199
- − Management
- −$3,199
- − Depreciation
- −$24,000
- Taxable loss
- −$50,724
- Est. tax savings @ 24.0%
- +$12,174
- After-tax cash flow
- $-22,254/yr
For passive investors: Depreciation is non-cash, so a rental often shows a tax loss while cash-flowing — sheltering income. Rental losses are passive: they offset passive income freely, and up to $25,000/yr can offset ordinary (W-2) income if you actively participate and your MAGI is under $100k (phasing out to $0 by $150k); unused losses carry forward. On sale, claimed depreciation is recaptured at up to 25%, and gains may owe capital-gains tax (a 1031 exchange can defer both). Figures are a year-1 estimate at your 24.0% rate — not tax advice; consult a CPA.
Schools (NCES district)
- District
- Mount Pleasant Central School District
- NCES district ID
- 3620160
- Math proficiency
- 62% ▼ -16.00%
- Reading proficiency
- 65% ▲ 3.00%
- Median HH income
- $109,054
- Composite
- 59.62/100
- National rank
- #911
- State rank
- #146 of 590 in NY
Livability — Thornwood
- Score
- 71/100
- State rank
- #389
- US rank
- #6724
Category grades
Schools grade is shown separately in the Schools card above.
Census & demographics
- Census place
- Thornwood, NY
- Population (ZIP)
- 5,512
Population outlook (Westchester County) Hauer SSP2
- Today (2025)
- 1,028,035 people
- By 2030
- 1,051,636 · +2.3%
- By 2040
- 1,098,520 · +6.9%
- By 2050
- 1,136,044 · +10.5%
- By 2075
- 1,196,925 · +16.4%
- By 2100
- 1,175,147 · +14.3%
Race, ethnicity, and origin ACS 2023
- Neighborhood character
- Predominantly White (83%)
- Race & ethnicity
- White 83% Hispanic / Latino 9% Two or more races 4% Asian 4%
- Hispanic origin (detail)
- Mexican 4%
- Common ancestry
- Romanian 4% Scotch-Irish 2% Russian 2%
- Foreign-born
- 16% · Canada, China
- Languages at home
- 78% English-only · Other Indo-European 12% Spanish 7% Other Asian/Pacific 1%
Political lean MEDSL · Westchester
- 2024 margin
- Strong D (+26.3) · D 63.1% · R 36.9%
- 2008→2024 swing
- -1.3pp toward R · 2008: 27.6pp · 2024: 26.3pp
- All cycles
- 2024: D+26.3 2020: D+36.3 2016: D+32.8 2012: D+22.2 2008: D+27.6
Not yet ingested
- Civics
- —
Market trends
- HPI YoY
- ▼ -65.72%
- Current HPI
- 286.025
- Rent YoY
- —
- Metro
- —
- State GDP YoY
- ▲ 2.60%
- F500 in state
- 92
Industry mix (Fortune 500 HQ in NY)
| Industry | F500 HQs | Revenue |
|---|---|---|
| Financial Services | 10 | $950B |
|
||
| Consumer Goods | 9 | $162B |
|
||
| Insurance | 4 | $225B |
|
||
| Telecommunications | 2 | $144B |
|
||
| Pharmaceuticals | 2 | $112B |
|
||
| Media / Entertainment | 2 | $69B |
|
||
Price history
2 events — show timeline
- 2026-05-05 Pending — OneKey® MLS as Distributed by MLS Grid
- 2026-04-02 Listed $825,000 OneKey® MLS as Distributed by MLS Grid
Property tax history
+0.7%/yrLatest (2025): $9,976 · +7.1% YoY. Source: county tax records.
Cash-flow waterfall
monthlySold comps — $/sqft
last 12 mo · ≤1 miLoading sold comps…