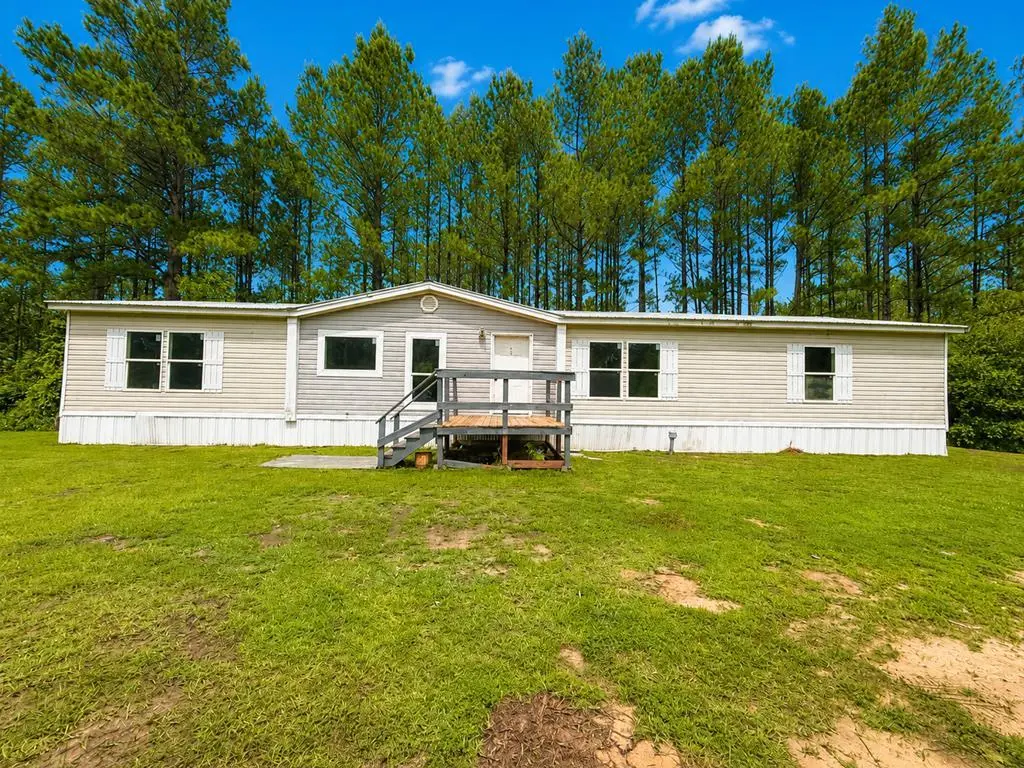
19 Willow Dr · Saucier, MS
Flood risk 1/10 · Minimal
- FEMA flood zone
- X (unshaded)
- Chance of flooding over 30 yrs
- 0.0%
- Est. flood insurance / yr
- $507 – $1,088
Fire risk 7/10 · Major
- Est. fire insurance / yr
- $1,241 – $2,305
Heat risk 8/10 · Major
- Hot days now (above 108°F)
- 7 days/yr
- Hot days in 30 yrs
- 20 days/yr
Wind risk 9/10 · Severe
- Chance of severe wind over 30 yrs
- 99.0%
Air-quality risk 1/10 · Minimal
- Unhealthy air days now
- 0 days/yr
- Unhealthy air days in 30 yrs
- 0 days/yr
Risk factors via First Street. Map © Google.
Why this score? — see what drove the C+ grade
The composite is a weighted blend of 9 inputs, each scored 0–100. Each bar is that input's sub-score; the figure is the points it added to the 100-point composite (weight × sub-score).
- Cash flow +20.8/30.0
- ARV discount +12.6/15.0
- Appreciation +7.6/10.0
- DSCR +6.6/10.0
- 1% rule +4.3/10.0
- Schools +4.1/10.0
- Livability +3.3/5.0
- Rent growth +2.5/5.0
- Condition / age +2.5/5.0
$139,900
🖨 Deal sheet 📄 Offer letter ✓ Due diligence
Listing remarks
This beautifully updated 4-bedroom, 2-bath doublewide manufactured home sits on a desirable double lot, offering plenty of room to spread out, entertain, and enjoy peaceful country living while remaining conveniently close to city amenities. Inside, you'll find fresh updates throughout, including a new roof, all-new carpet, new kitchen cabinetry, and new vinyl flooring in the living room, kitchen, and dining areas. The spacious floor plan provides comfortable living with generously sized bedrooms, an inviting living area, and a functional kitchen designed for everyday living and family gatherings. The double lot offers abundant outdoor space for gardening, pets, or future improvements, maki
Key facts
- Double lot
- Outdoor space
- New roof
Tags
Property features AI
Exterior
- Parking: No designated parking
- Utilities: Septic tank
- Home design: Single-story mobile home; Residential property in the Beaver Dam Crossing subdivision
- Construction: Vinyl siding; Crawl space foundation; Built with composition roofing
- Exterior features: Composition roof; Approximately 0.5-acre lot
Interior
- Kitchen: Dishwasher; Refrigerator
- Bathrooms: 2 full bathrooms
- Heating & cooling: Ceiling fan(s); Has cooling
- Interior features: Walk-in closet(s); Insulated windows
- Laundry & utility: Electric water heater
Neighborhood map
What this means for you Summary
Snapshot
- This is a 4-bed/2.0-bath manufactured listed at $140k.
Deal economics
- At list price, monthly cash flow is $191 ($2k/yr) — positive.
- The deal already cash-flows at list — no discount required.
- To meet the 1% rule (rent ≥ 1% of price), the offer needs to be $130k (6.8% below list).
- Recommended offer: $130k (6.8% below list) — sets the bar for 1% rule.
- Cap rate 7.9% vs local median 4.4% in Saucier — top-decile yield for the area; either an underpriced asset or a hidden risk that comps aren't pricing in. Stress-test before assuming the spread holds.
Location & tenants
- Location reads 66/100 on livability (#91 in MS) — a middle-class / working-renter tenant base. Strengths: crime A+, cost of living A+; Watch: amenities F, commute F, health & safety F.
- Stone County School District (town): math 52% / reading 46% proficiency, ranked #15 of 130 in MS (top 12%) — families likely to look elsewhere, expect single-tenant / working-renter base with shorter leases.
- Market conditions: 37 active listings in the ZIP; 60 units permitted in Stone County in 2024 (0 in 5+ unit buildings).
Forward outlook
- In year one you build about $8k of equity ($967 loan paydown + $7k appreciation (5.2% local appreciation)).
- Stone County population projected to shrink 4% by 2050 — rents likely to lag national; underwrite the cash flow, not the appreciation.
- At projected returns (5.2% appreciation + 3.0% rent growth), your $39k cash investment doubles in ~4 years — after that, you're playing with house money.
- By year 5, paydown + projected appreciation supports a ~$36k cash-out refi (75% LTV) — recoverable capital for the next deal without selling this one.
Negotiation context
- Only 14 days on market — expect competitive offers; lowballing is unlikely to land.
Risks & watch-outs
- Climate carrying-cost: severe wind risk, 99% chance of damaging wind over 30y; major wildfire risk; extreme-heat days projected 7→20/yr by 2055 (HVAC capex compounding) — expect insurance premiums to compound above CPI over the hold.
Questions for the listing agent
- Is there a deadline driving the sale (1031 exchange, divorce, estate, relocation)? That informs how much negotiation room exists.
- What's the average days-on-market for RENTAL listings here right now (not sales)? A rising rental-DOM trend means longer vacancies and softer asking-rent achievability than the comps imply.
- What's the recent tenant-quality profile in this submarket — average credit score on applications, eviction rate, late-payment / NSF rate, and stable-employment percentage? A property-management company in the area should have these aggregated.
- How much new for-sale + rental construction is in the pipeline within 1–3 miles? Heavy new supply typically softens prices + rents 12–24 months out; constrained supply supports both.
Investment metrics
- 1% rule
- 0.93% ✗
- Cap rate
- 7.93%
- Cash-on-cash
- 5.85%
- DSCR
- 1.26
- GRM
- 8.9
CMA / ARV
- ARV (on-the-fly)
- $157,624
- Comps found
- 1
Show comp detail 1 sale within ~0.75 mi
| Address | Dist | Beds/Ba | Sqft | Sold | Price | $/sf | Match |
|---|---|---|---|---|---|---|---|
| 7 Willow Cv | 0.20mi | 4/2.0 | 2,450 (-5%) | 4mo | $149,900 | $61 | 79 |
Match score weights: distance 35% · size 25% · config 20% · recency 20%. Top-matched comps best support the ARV.
Projected returns pro-forma
5.23% appreciation · 3.0% rent growth · sell at horizon
- IRR
- 18.4%
- Equity multiple
- 2.18×
- Total profit
- $46,206
- Equity at exit
- $81,263
- IRR
- 18.3%
- Equity multiple
- 4.27×
- Total profit
- $128,238
- Equity at exit
- $141,916
Cash invested: $39,172 (down + closing). Projections, not guarantees.
Landlord ↔ Tenant lean methodology
- Overall (STATE)
- 90 Strongly Landlord-Friendly
- State Mississippi
- 90 Strongly Landlord-Friendly · R+11
- County
- — inherits STATE
- City
- — inherits STATE
ZIP-level market 39561
- Home prices YoY
- 3.0%
- Active inventory
- 37
- Price-to-rent
- 8.9×
Monthly cashflow live
- Estimated rent
- $1,305 medium interval (Pro) →
- Mortgage (P&I)
- −$734
- Tax from tax record
- −$48 /mo · $573/yr
- Insurance
- −$58
- HOA
- −$0
- Vacancy / Maint / Mgmt
- −$274
- Net cashflow
- $191
Break-even live
UW: 25.0% down · 7.5% · 30yr · 1.5% tax · 5.0% vac · 8.0% maint · 8.0% mgmt
Financing live
Cash to close
- Down payment
- $34,975
- Closing costs
- $4,197
- Reserves months
- —
- Total cash needed
- —
Loan-product check · same deal, 3 products live
Conventional
25% down · 7.5% · 30yr
- Down + closing
- —
- Monthly P&I
- —
- Monthly cashflow
- —
- DSCR
- —
- Eligible?
- —
Personal DTI + credit; lowest rate.
DSCR
20% down · 8.5% · 30yr
- Down + closing
- —
- Monthly P&I
- —
- Monthly cashflow
- —
- DSCR
- —
- Eligible?
- —
No personal income docs; deal must DSCR.
Hard money
10% down · 12.0% · 12mo
- Down + closing
- —
- Monthly P&I
- —
- Monthly cashflow
- —
- DSCR
- —
- Eligible?
- —
Short-term bridge; refi at stabilization.
Listing history 11 events
-
2026-06-18days on market $139,900 Active 14 DOM
-
2026-06-17days on market $139,900 Active 13 DOM
-
2026-06-16days on market $139,900 Active 12 DOM
-
2026-06-15days on market $139,900 Active 11 DOM
-
2026-06-13days on market $139,900 Active 9 DOM
-
2026-06-12days on market $139,900 Active 8 DOM
-
2026-06-09days on market $139,900 Active 5 DOM
-
2026-06-08days on market $139,900 Active 4 DOM
-
2026-06-07days on market $139,900 Active 3 DOM
-
2026-06-07remarks 699-char remark
-
2026-06-07$139,900 Active 2 DOM
ⓘ Source: listings_history table (triggers on properties + properties_extension) + one-shot
backfill from property_details.listing_events for pre-trigger history.
Tax reassessment forecast MS · Resets to sale price
- Current annual tax
- $573 · $48/mo
- Projected year-2 tax
- $1,105 · $92/mo
- Expected delta
- +$532/yr (+$44/mo · 92.7%)
ⓘ Screening estimate from a state-policy table — verify with the county assessor before closing.
Climate risk First Street
- Flood 1/10 Low FEMA zone X (unshaded) · 0% chance over 30 yrs
- Wildfire 7/10 Severe
- Heat 8/10 Severe 7 d/yr ≥108°F today · 20 d/yr by 30 yrs out
- Wind 9/10 Extreme 99% chance of damaging wind over 30 yrs
- Air quality 1/10 Low 0 unhealthy d/yr today · 0 by 30 yrs out
Nearby sold comps map
Loading sold comps map…
Walkable amenities ~0.75 mi
Loading nearby amenities…
Taxation est. · year 1
- Rental income
- $15,654
- − Mortgage interest
- −$7,837
- − Property taxes
- −$573
- − Insurance
- −$700
- − Repairs & maintenance
- −$1,252
- − Management
- −$1,252
- − Depreciation
- −$4,070
- Taxable loss
- −$30
- Est. tax savings @ 24.0%
- +$7
- After-tax cash flow
- $2,297/yr
For passive investors: Depreciation is non-cash, so a rental often shows a tax loss while cash-flowing — sheltering income. Rental losses are passive: they offset passive income freely, and up to $25,000/yr can offset ordinary (W-2) income if you actively participate and your MAGI is under $100k (phasing out to $0 by $150k); unused losses carry forward. On sale, claimed depreciation is recaptured at up to 25%, and gains may owe capital-gains tax (a 1031 exchange can defer both). Figures are a year-1 estimate at your 24.0% rate — not tax advice; consult a CPA.
Schools (NCES district)
- District
- Stone County School District
- NCES district ID
- 2804170
- Math proficiency
- 52% ▼ -8.00%
- Reading proficiency
- 46% ▼ -7.00%
- Median HH income
- $43,785
- Composite
- 41.4/100
- National rank
- #3476
- State rank
- #15 of 130 in MS
Livability — Saucier
- Score
- 66/100
- State rank
- #91
- US rank
- #11386
Category grades
Schools grade is shown separately in the Schools card above.
Census & demographics
- Population (ZIP)
- 2,224
Population outlook (Stone County) Hauer SSP2
- Today (2025)
- 18,528 people
- By 2030
- 18,585 · +0.3%
- By 2040
- 18,429 · -0.5%
- By 2050
- 17,825 · -3.8%
- By 2075
- 16,095 · -13.1%
- By 2100
- 14,276 · -22.9%
Race, ethnicity, and origin ACS 2023
- Neighborhood character
- Predominantly White (94%)
- Race & ethnicity
- White 94% Two or more races 6%
- Common ancestry
- Serbian 4% Slovak 2% Lithuanian 1%
- Foreign-born
- 1% · Canada
Political lean MEDSL · Stone
- 2024 margin
- Solid R (+58.0) · D 20.5% · R 78.5% · Other 1.1%
- 2008→2024 swing
- -14.5pp toward R · 2008: -43.5pp · 2024: -58.0pp
- All cycles
- 2024: R+58.0 2020: R+52.8 2016: R+53.5 2012: R+45.9 2008: R+43.5
Not yet ingested
- Civics
- —
Market trends
- HPI YoY
- ▲ 5.23%
- Current HPI
- 182.594
- Rent YoY
- —
- Metro
- —
- State GDP YoY
- —
- F500 in state
- 0
Price history
1 event — show timeline
- 2026-06-05 Listed $139,900 LBOR
Property tax history
-7.1%/yrLatest (2025): $573 · -16.4% YoY. Source: county tax records.
Cash-flow waterfall
monthlySold comps — $/sqft
last 12 mo · ≤1 miLoading sold comps…