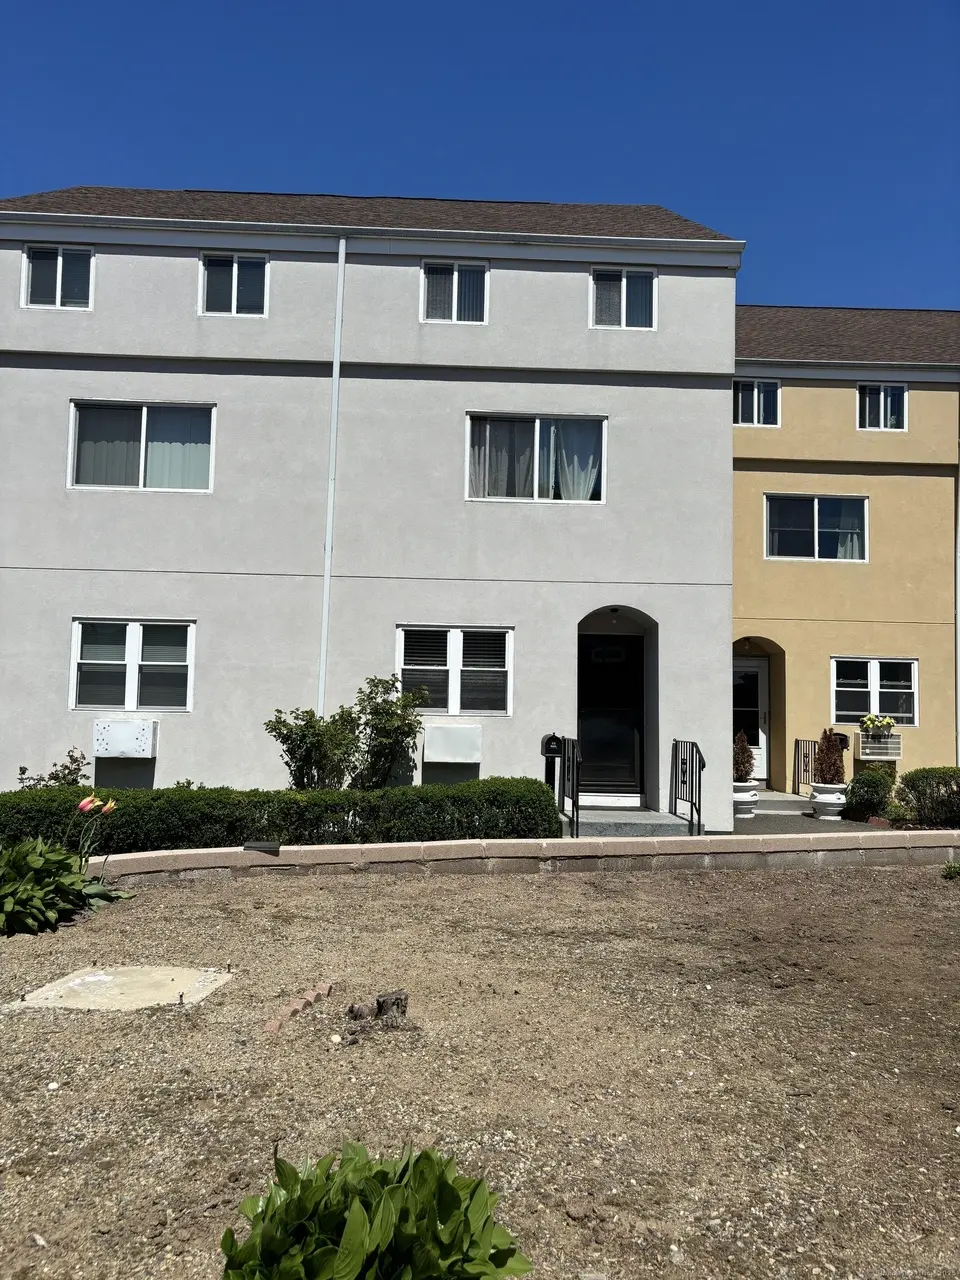
60 Gilmore St #21 · Bridgeport, CT
Flood risk 1/10 · Minimal
- FEMA flood zone
- X (unshaded)
- Chance of flooding over 30 yrs
- 0.0%
- Est. flood insurance / yr
- $507 – $1,088
Fire risk 1/10 · Minimal
- Est. fire insurance / yr
- $829 – $1,539
Heat risk 7/10 · Major
- Hot days now (above 97°F)
- 7 days/yr
- Hot days in 30 yrs
- 16 days/yr
Wind risk 6/10 · Moderate
- Chance of severe wind over 30 yrs
- 44.0%
Air-quality risk 4/10 · Minor
- Unhealthy air days now
- 5 days/yr
- Unhealthy air days in 30 yrs
- 7 days/yr
Risk factors via First Street. Map © Google.
Why this score? — see what drove the C- grade
The composite is a weighted blend of 9 inputs, each scored 0–100. Each bar is that input's sub-score; the figure is the points it added to the 100-point composite (weight × sub-score).
- ARV discount +15.0/15.0
- Appreciation +10.0/10.0
- Cash flow +7.3/30.0
- 1% rule +7.1/10.0
- Livability +4.0/5.0
- Rent growth +3.6/5.0
- Condition / age +2.2/5.0
- DSCR +1.5/10.0
- Schools +1.2/10.0
$169,900
🖨 Deal sheet 📄 Offer letter ✓ Due diligence
Listing remarks MLS
Charming & cozy duplex style home nested in the heart of Bridgeport's East Side. Nice sized livingroom opens to eat in kitchen with sliders to expansive brick patio. Beautiful versital outdoor space with full vinyl privacy fencing. 2nd level offers 2 comfortable bedrooms and well apportioned bathroom. The third level is a huge multifunctioal area for 3rd bedroom/ master/ rec room... and makes this unit exceptional. This residence is for perfect for those seeking convenience and accessability.
Key facts
- Duplex style home
- $675 HOA
- Built 1981
Tags
Neighborhood map
What this means for you Summary
Snapshot
- This is a 2-bed/1.0-bath condo listed at $170k. Condition is rated fair.
Deal economics
- At list price, monthly cash flow is $-226 ($-3k/yr) — negative.
- To cash-flow at today's rent, offer at most $137k (19.2% below list).
- Meets the 1% rule at list price ($2k rent vs $170k).
- Recommended offer: $137k (19.2% below list) — sets the bar for cash-flow.
Location & tenants
- Location reads 81/100 on livability (#15 in CT, #1,374 nationally) — a professional / high-income tenant draw. Strengths: amenities A+, commute A+, health & safety A+; Watch: crime C-, employment D+, schools D-.
- Bridgeport School District (urban): math 9% / reading 19% proficiency, ranked #151 of 153 in CT (top 99%) — low school quality limits family demand, transient renter base, plan for 1-2y turnover; 97% free/reduced lunch — lower-income household profile, screen leases tightly.
- Market conditions: Rents rising fast (+4.3%/yr); 30 active listings in the ZIP; 40 comparable units currently listed for rent nearby; rentals at typical pace (median 24d on market — plan ~3-4 weeks tenant-placement turnaround); 48% of comp listings sitting > 30 days — soft ceiling on asking rent; 852 units permitted in Greater Bridgeport Planning Region in 2024 (698 in 5+ unit buildings).
- At $2,055/mo this rent would consume 54% of the median local household income ($46k/yr) (locally 910% of renters already pay >50% of income on rent) — very limited rent-growth headroom before tenants either downsize or default.
Forward outlook
- In year one you build about $18k of equity ($1k loan paydown + $17k appreciation (10.0% local appreciation)).
- By year 3, paydown + projected appreciation supports a ~$46k cash-out refi (75% LTV) — recoverable capital for the next deal without selling this one.
Negotiation context
- It's been on market 153 days — a 12% lower offer ($150k) is reasonable based on typical stale-listing flexibility.
Risks & watch-outs
- Watch-outs: HOA is 33% of rent.
- Climate carrying-cost: major wind risk, 44% chance of damaging wind over 30y; extreme-heat days projected 7→16/yr by 2055 (HVAC capex compounding) — expect insurance premiums to compound above CPI over the hold.
Questions for the listing agent
- What do current leases actually rent for vs. the listed asking? Can we see a recent rent roll and the last 12 months of T-12 income?
- It's been on market 153 days. Have you received any prior offers? Is the seller open to a 19% concession, seller financing, or rate buy-down credit?
- Have any recent inspections been done? Can we get a copy of the seller's disclosures and any deferred-maintenance estimates?
- What does the HOA fee cover, when was the last increase, and are there any pending special assessments or reserve-fund shortfalls?
- Any open or pending special assessments — roof, HVAC, plumbing, elevator, façade? What's the per-unit balance and payoff schedule, and is the seller paying it off at close or rolling it to the buyer?
- Why hasn't it sold? Are there any deal-killer items the seller is aware of (foundation, flood, title, zoning, code violations)?
- Is there a deadline driving the sale (1031 exchange, divorce, estate, relocation)? That informs how much negotiation room exists.
- Schools are D-rated, which usually means shorter tenancies and higher turnover. Who's the typical renter profile here, and what's been the actual vacancy rate?
- What's the average days-on-market for RENTAL listings here right now (not sales)? A rising rental-DOM trend means longer vacancies and softer asking-rent achievability than the comps imply.
- What's the recent tenant-quality profile in this submarket — average credit score on applications, eviction rate, late-payment / NSF rate, and stable-employment percentage? A property-management company in the area should have these aggregated.
- How much new apartment / multifamily construction is in the pipeline within 1–3 miles? Heavy new supply (>2% of stock underway) typically softens rents 12–24 months out; light construction supports rent growth.
Investment metrics
- 1% rule
- 1.21% ✓
- Cap rate
- 4.70%
- Cash-on-cash
- -5.69%
- DSCR
- 0.75
- GRM
- 6.9
CMA / ARV
- ARV (median comp)
- $211,989
- List price
- $169,900
- Delta
- -19.85%
- Verdict
- UNDERPRICED
- Comps
- 18 within 1.0 mi
Projected returns pro-forma
10.0% appreciation · 4.35% rent growth · sell at horizon
- IRR
- 21.0%
- Equity multiple
- 2.71×
- Total profit
- $81,436
- Equity at exit
- $153,059
- IRR
- 19.6%
- Equity multiple
- 6.42×
- Total profit
- $258,068
- Equity at exit
- $330,078
Cash invested: $47,572 (down + closing). Projections, not guarantees.
Landlord ↔ Tenant lean methodology
- Overall (STATE)
- 27 Tenant-Leaning
- State Connecticut
- 27 Tenant-Leaning · D+7
- County
- — inherits STATE
- City
- — inherits STATE
ZIP-level market 06608
- Home prices YoY
- 3.6%
- Rents YoY
- 4.3%
- Active inventory
- 30
- Price-to-rent
- 6.9×
Monthly cashflow live
- Estimated rent
- $2,055 high interval (Pro) →
- Mortgage (P&I)
- −$891
- Tax est. 1.5%
- −$212 /mo · $2,548/yr
- Insurance
- −$71
- HOA
- −$675
- Vacancy / Maint / Mgmt
- −$432
- Net cashflow
- $-226
Break-even live
UW: 25.0% down · 7.5% · 30yr · 1.5% tax · 5.0% vac · 8.0% maint · 8.0% mgmt
Financing live
Cash to close
- Down payment
- $42,475
- Closing costs
- $5,097
- Reserves months
- —
- Total cash needed
- —
Loan-product check · same deal, 3 products live
Conventional
25% down · 7.5% · 30yr
- Down + closing
- —
- Monthly P&I
- —
- Monthly cashflow
- —
- DSCR
- —
- Eligible?
- —
Personal DTI + credit; lowest rate.
DSCR
20% down · 8.5% · 30yr
- Down + closing
- —
- Monthly P&I
- —
- Monthly cashflow
- —
- DSCR
- —
- Eligible?
- —
No personal income docs; deal must DSCR.
Hard money
10% down · 12.0% · 12mo
- Down + closing
- —
- Monthly P&I
- —
- Monthly cashflow
- —
- DSCR
- —
- Eligible?
- —
Short-term bridge; refi at stabilization.
Rent comps 40 comps
| Address | Beds | Baths | Sqft | Rent | $/sqft | DOM | Units | Dist |
|---|---|---|---|---|---|---|---|---|
| 588-612 E Main St Unit D Bridgeport, CT | 2.0 | 1.0 | 750 | $2,125 | $2.83 | 43d | 1 | 0.20mi |
| 588-612 E Main St Unit 592 Bridgeport, CT | 3.0 | 2.0 | 1000 | $2,350 | $2.35 | 14d | 1 | 0.20mi |
| 588-612 E Main St Unit 598 Bridgeport, CT | 3.0 | 1.0 | 1000 | $2,300 | $2.30 | 14d | 1 | 0.20mi |
| 588-612 E Main St Unit 598 Bridgeport, CT | 2.0 | 1.0 | 750 | $1,975 | $2.63 | 10d | 1 | 0.20mi |
| 588 E Main St Unit C Bridgeport, CT | 3.0 | 1.0 | 1400 | $2,475 | $1.77 | 14d | 1 | 0.21mi |
| 515 E Main St Bridgeport, CT | 3.0 | 2.0 | 800 | $2,550 | $3.19 | 43d | 1 | 0.22mi |
| 511 E Main St Bridgeport, CT | 3.0 | 1.0 | 1100 | $2,300 | $2.09 | 43d | 1 | 0.22mi |
| 507 E Main St Bridgeport, CT | 3.0 | 1.0 | 1120 | $2,198 | $1.96 | 43d | 1 | 0.22mi |
| 505 E Main St Bridgeport, CT | 3.0 | 1.0 | 1120 | $2,199 | $1.96 | 43d | 1 | 0.22mi |
| 126 Burroughs St #130 Bridgeport, CT | 3.0 | 1.0 | 906 | $2,075 | $2.29 | 23d | 1 | 0.29mi |
| 463-465 Connecticut Ave Unit 3 Bridgeport, CT | 2.0 | 1.0 | 820 | $1,700 | $2.07 | 23d | 1 | 0.47mi |
| 467 Connecticut Ave Unit 3 Bridgeport, CT | 2.0 | 1.0 | 820 | $1,700 | $2.07 | 23d | 1 | 0.47mi |
| 1071 Pembroke St Unit 2B Bridgeport, CT | 2.0 | 1.0 | 848 | $1,750 | $2.06 | 21d | 1 | 0.48mi |
| 55 E Main St Bridgeport, CT | 3.0 | 1.0–3.0 | 1115 | $6,712 | $6.02 | 3d | 189 | 0.49mi |
| 166 6th St Bridgeport, CT | 3.0 | 1.0 | 1100 | $2,300 | $2.09 | 19d | 1 | 0.50mi |
| 245 Brooks St Unit 3R Bridgeport, CT | 2.0 | 1.0 | 1000 | $1,750 | $1.75 | 23d | 1 | 0.54mi |
| 530 Jane St Unit 2 Bridgeport, CT | 2.0 | 1.0 | 800 | $2,200 | $2.75 | 43d | 1 | 0.54mi |
| 62 Clifford St Bridgeport, CT | 3.0 | 1.5 | 1134 | $2,500 | $2.20 | 23d | 1 | 0.57mi |
| 116 Knowlton St Unit 2C Bridgeport, CT | 3.0 | 1.0 | 750 | $1,200 | $1.60 | 19d | 1 | 0.58mi |
| 1880 Seaview Ave Unit 3 Bridgeport, CT | 1.0 | 1.0 | 1003 | $1,300 | $1.30 | 14d | 1 | 0.59mi |
| 222 Beardsley St Unit 3rd floor Bridgeport, CT | 2.0 | 1.0 | 732 | $2,000 | $2.73 | 43d | 1 | 0.61mi |
| 222 Beardsley St Unit 2nd floor Bridgeport, CT | 2.0 | 1.0 | 934 | $2,000 | $2.14 | 11d | 1 | 0.61mi |
| 647 Union Ave Unit 2 Bridgeport, CT | 2.0 | 1.0 | 750 | $1,675 | $2.23 | 3d | 1 | 0.62mi |
| 279 Harriet St Bridgeport, CT | 3.0 | 1.5 | 1392 | $3,000 | $2.16 | 23d | 1 | 0.62mi |
| 619 Shelton St Fl R Bridgeport, CT | 2.0 | 1.0 | 837 | $2,050 | $2.45 | 43d | 1 | 0.62mi |
| 601 Newfield Ave Bridgeport, CT | 3.0 | 1.0 | 1047 | $2,300 | $2.20 | 43d | 1 | 0.62mi |
| 1525 Central Ave Bridgeport, CT | 1.0 | 1.0 | 625 | $1,550 | $2.48 | 43d | 3 | 0.62mi |
| 184 Park St Bridgeport, CT | 2.0 | 1.0 | 1200 | $2,000 | $1.67 | 43d | 1 | 0.63mi |
| 1248 Pembroke St Unit First Bridgeport, CT | 3.0 | 1.0 | 1000 | $1,950 | $1.95 | 21d | 1 | 0.63mi |
| 1248 Pembroke St Bridgeport, CT | 3.0 | 1.0 | 1000 | $1,850 | $1.85 | 23d | 1 | 0.63mi |
| 1254 Pembroke St Unit 1st Floor Bridgeport, CT | 2.0 | 1.0 | 738 | $1,850 | $2.51 | 14d | 1 | 0.64mi |
| 127 Eagle St Bridgeport, CT | 2.0 | 1.0 | 1000 | $2,000 | $2.00 | 43d | 1 | 0.66mi |
| 1102 Main St Unit 1 Bridgeport, CT | 2.0 | 1.0 | 1117 | $1,700 | $1.52 | 43d | 1 | 0.66mi |
| 13 Armstrong Pl Unit 2 Bridgeport, CT | 3.0 | 1.0 | 1029 | $1,700 | $1.65 | 43d | 1 | 0.67mi |
| 1269 Main St Bridgeport, CT | 2.0 | 2.0 | 980 | $2,350 | $2.40 | 43d | 1 | 0.69mi |
| 991 Main St Bridgeport, CT | 1.0 | 1.0 | 751 | $1,675 | $2.23 | 43d | 1 | 0.70mi |
| 476 Brooks St Unit 2-478 Bridgeport, CT | 2.0 | 1.0 | 963 | $1,750 | $1.82 | 23d | 1 | 0.74mi |
| 1415 Stratford Ave Bridgeport, CT | 2.0 | 1.0 | 1260 | $2,300 | $1.83 | 43d | 1 | 0.75mi |
| 1400 Stratford Ave Bridgeport, CT | 2.0 | 1.0 | 950 | $2,000 | $2.11 | 43d | 1 | 0.75mi |
| 1150 Ogden Street Ext Unit 305 Bridgeport, CT | 1.0 | 1.0 | 780 | $1,425 | $1.83 | 43d | 1 | 0.77mi |
HOA detail condo
- Monthly dues
- $675 · $8,100/yr
- Assessments
- None detected in remarks — confirm with the listing agent.
Listing history 17 events
-
2026-06-18days on market $169,900 Active 153 DOM
-
2026-06-17days on market $169,900 Active 152 DOM
-
2026-06-16days on market $169,900 Active 151 DOM
-
2026-06-15days on market $169,900 Active 150 DOM
-
2026-06-13days on market $169,900 Active 148 DOM
-
2026-06-13days on market $169,900 Active 147 DOM
-
2026-06-10days on market $169,900 Active 145 DOM
-
2026-06-09days on market $169,900 Active 144 DOM
-
2026-06-08days on market $169,900 Active 143 DOM
-
2026-06-07days on market $169,900 Active 142 DOM
-
2026-06-05days on market $169,900 Active 139 DOM
-
2026-06-03days on market $169,900 Active 138 DOM
-
2026-06-03days on market $169,900 Active 137 DOM
-
2026-06-01days on market $169,900 Active 136 DOM
-
2026-05-31days on market $169,900 Active 135 DOM
-
2026-04-03price $169,900 501-char remark
Show marketing remark (501 chars)
Charming & cozy duplex style home nested in the heart of Bridgeport's East Side. Nice sized livingroom opens to eat in kitchen with sliders to expansive brick patio. Beautiful versital outdoor space with full vinyl privacy fencing. 2nd level offers 2 comfortable bedrooms and well apportioned bathroom. The third level is a huge multifunctioal area for 3rd bedroom/ master/ rec room... and makes this unit exceptional. This residence is for perfect for those seeking convenience and accessability.
-
2026-01-16$184,900 Active 501-char remark
Show marketing remark (501 chars)
Charming & cozy duplex style home nested in the heart of Bridgeport's East Side. Nice sized livingroom opens to eat in kitchen with sliders to expansive brick patio. Beautiful versital outdoor space with full vinyl privacy fencing. 2nd level offers 2 comfortable bedrooms and well apportioned bathroom. The third level is a huge multifunctioal area for 3rd bedroom/ master/ rec room... and makes this unit exceptional. This residence is for perfect for those seeking convenience and accessability.
ⓘ Source: listings_history table (triggers on properties + properties_extension) + one-shot
backfill from property_details.listing_events for pre-trigger history.
Climate risk First Street
- Flood 1/10 Low FEMA zone X (unshaded) · 0% chance over 30 yrs
- Wildfire 1/10 Low
- Heat 7/10 Severe 7 d/yr ≥97°F today · 16 d/yr by 30 yrs out
- Wind 6/10 Major 44% chance of damaging wind over 30 yrs
- Air quality 4/10 Moderate 5 unhealthy d/yr today · 7 by 30 yrs out
Nearby sold comps map
Loading sold comps map…
Walkable amenities ~0.75 mi
Loading nearby amenities…
Taxation est. · year 1
- Rental income
- $24,661
- − Mortgage interest
- −$9,517
- − Property taxes
- −$2,548
- − Insurance
- −$850
- − Repairs & maintenance
- −$1,973
- − Management
- −$1,973
- − HOA
- −$8,100
- − Depreciation
- −$4,943
- Taxable loss
- −$5,242
- Est. tax savings @ 24.0%
- +$1,258
- After-tax cash flow
- $-1,449/yr
For passive investors: Depreciation is non-cash, so a rental often shows a tax loss while cash-flowing — sheltering income. Rental losses are passive: they offset passive income freely, and up to $25,000/yr can offset ordinary (W-2) income if you actively participate and your MAGI is under $100k (phasing out to $0 by $150k); unused losses carry forward. On sale, claimed depreciation is recaptured at up to 25%, and gains may owe capital-gains tax (a 1031 exchange can defer both). Figures are a year-1 estimate at your 24.0% rate — not tax advice; consult a CPA.
Condition & rehab AI · 12 photos
This home requires moderate renovations to improve its condition and appeal. Key updates include fresh paint, new kitchen cabinets, and updated bathroom fixtures.
Repairs flagged
- Moderate kitchen cabinets — dated and in need of updating
- Moderate bathroom fixtures — dated and in need of updating
- Minor exterior paint — some fading
Value-add opportunities
- Resale paint interior walls — fresh paint enhances curb appeal
- Resale replace kitchen cabinets — new cabinets improve functionality and aesthetics
- Resale update bathroom fixtures — new fixtures enhance functionality and aesthetics
- Resale repair exterior paint — fresh paint enhances curb appeal
Renovation cost estimate screening
| Repair item | Severity | Est. cost |
|---|---|---|
| kitchen cabinets · dated and in need of updating | Moderate | $3,000–15,000 |
| bathroom fixtures · dated and in need of updating | Moderate | $3,000–15,000 |
| exterior paint · some fading | Minor | $500–3,000 |
| Total estimated repair cost · 3 items | $6,500–33,000 |
Value-add ROI direction
- Resale paint interior walls — fresh paint enhances curb appeal ↑
- Resale replace kitchen cabinets — new cabinets improve functionality and aesthetics ↑
- Resale update bathroom fixtures — new fixtures enhance functionality and aesthetics ↑
- Resale repair exterior paint — fresh paint enhances curb appeal ↑
ⓘ Cost ranges are severity-bucket heuristics (US national rule-of-thumb). Get contractor quotes + a written scope before underwriting a rehab budget.
Schools (NCES district)
- District
- Bridgeport School District
- NCES district ID
- 0900450
- Math proficiency
- 9% ▼ -7.00%
- Reading proficiency
- 19% ▼ -10.00%
- Median HH income
- $41,507
- Composite
- 12.09/100
- National rank
- #9656
- State rank
- #151 of 153 in CT
Livability — Bridgeport
- Score
- 81/100
- State rank
- #15
- US rank
- #1374
Category grades
Schools grade is shown separately in the Schools card above.
Census & demographics
- Census place
- Bridgeport, CT
- County
- Fairfield County · 765,532 people
- City population
- 149,153
- Metro
- Bridgeport-Stamford-Norwalk, CT
- Population (ZIP)
- 12,146
- Household income
- $45,754
- Rent vs Own
- Severe rent burden
- 910.0
Population outlook (Greater Bridgeport County) Hauer SSP2
- By 2040
- 365,581
Race, ethnicity, and origin ACS 2023
- Neighborhood character
- Predominantly Hispanic (69%)
- Race & ethnicity
- Hispanic / Latino 69% Black 22% Two or more races 19% White 4% Asian 4%
- Hispanic origin (detail)
- Mexican 5% Puerto Rican 32% Cuban 1% Dominican 14%
- Common ancestry
- Hispanic 1% Russian 1% Estonian 0%
- Foreign-born
- 34% · Canada, Jamaica
- Languages at home
- 33% English-only · Spanish 56% French/Haitian/Cajun 4% Other Asian/Pacific 3%
Political lean MEDSL · Greater Bridgeport
- 2024 margin
- Strong D (+23.3) · D 60.9% · R 37.6% · Other 1.5%
- All cycles
- 2024: D+23.3
Not yet ingested
- Civics
- —
Market trends
- HPI YoY
- ▲ 18.29%
- Current HPI
- 530.5125
- Rent YoY
- ▲ 4.35%
- Metro
- Bridgeport-Stamford-Norwalk, CT
- State GDP YoY
- ▲ 1.06%
- F500 in state
- 38
Industry mix (Fortune 500 HQ in CT)
| Industry | F500 HQs | Revenue |
|---|---|---|
| Industrial Machinery | 4 | $38B |
|
||
| Insurance | 3 | $71B |
|
||
| Financial Services | 2 | $25B |
|
||
| Transportation / Logistics | 2 | $18B |
|
||
| Healthcare | 1 | $247B |
|
||
| Telecommunications | 1 | $55B |
|
||
Price history
-8.1% since first listed2 events — show timeline
- 2026-04-03 Price Changed $169,900 Smart MLS
- 2026-01-16 Listed $184,900 Smart MLS
Cash-flow waterfall
monthlySold comps — $/sqft
last 12 mo · ≤1 miLoading sold comps…